WBA - My Dividend Stock Portfolio: New All-Time Dividend Record - 99 Holdings With 25 Buys
2023-04-12 10:00:00 ET
Summary
- Inflation and (expected) actions by the Federal Reserve continue to dominate market movements even though the turmoil in the financial sector shortly took center stage.
- Markets have started the new year with very solid gains following expectations about a more dovish Federal Reserve and a solid earnings season.
- My dividend income in March amounted to a record $950. This represents growth of 61% Y/Y and 40% sequentially.
- Gifted Working Time in 2023: Around 71.2 hours or 8.9 days of active work have been replaced with passive income in 2023 already which is almost two full-time work weeks funded with dividends.
Portfolio Changes in March
Investment activity in March started slowly and then got supercharged fueled by the turmoil in the financial sector following the sudden collapse of Silicon Valley Bank and concerns about contagion. This type of knee-jerk reaction where solid stocks, especially in the BDC sector, drop 20% and more over a couple of days are exactly the opportunities I am always looking for and hoping to be prepared when they finally arrive.
Overall net investments totaled around $2,500 with the majority of purchases targeted towards the financial sector in general and high-yielding BDCs in particular.
My top three purchases, Ares Capital ( ARCC ), Hercules Capital Corporation ( HTGC ) and MidCap Financial Investment Corporation ( MFIC ), were and are all yielding in excess of 10% which is enough of a cushion for me to sit out any temporary stock price weakness. Notably, all three of them have already strongly recovered from the firesale lows and I will continue to thoroughly monitor the situation.
I have been accumulating my stake in ZIM Integrated Shipping Services ( ZIM ) as the stock continues to trade in a price range I cannot understand and deem far too low regardless of the interest rate level. The earnings results were positive and the massive final mega dividend was enough to convince me to wait out a prolonged period of lower shipping rates. ZIM is profitable and while the current dividend will likely shrink into the low double-digit cent territory I have already earned back more than half of my investment from dividends and will be patient as I always aim to be.
Apart from that most of the other purchases were triggered by the almost weekly savings plans or opportunistic and irregular purchases around earnings dates.
Due to the nature of how the monthly investment plan process works, I am investing relatively equally into these stocks at two points of time during the month - at the beginning of the month and mid-month - which breaks down as shown below. Figures are in Euro and show that, for instance, at the beginning of the month, I am investing between 50 and 75 EUR each into Microsoft ( MSFT ), The Home Depot (NYSE: HD ), Visa (NYSE: V ), W. P. Carey ( WPC ), and BP (NYSE: BP ). Mid-month, I am adding between 33 and 40 EUR each into STAG Industrial (NYSE: STAG ), AT&T ( T ), NextEra Energy (NYSE: NEE ), Toronto-Dominion Bank (NYSE: TD ), Main Street Capital (NYSE: MAIN ) and JPMorgan (NYSE: JPM ).
I have added several investment plans starting mid-September 2020 which include AGNC Investment Corp. (NASDAQ: AGNC ), Ares Capital (NASDAQ: ARCC ), Medical Properties Trust (NYSE: MPW ), The Bank of Nova Scotia (NYSE: BNS ) and The Trade Desk (NASDAQ: TTD ). Investments here will be focused on high-yield as well as high-growth stocks in the technology, therapeutic and renewables sectors.
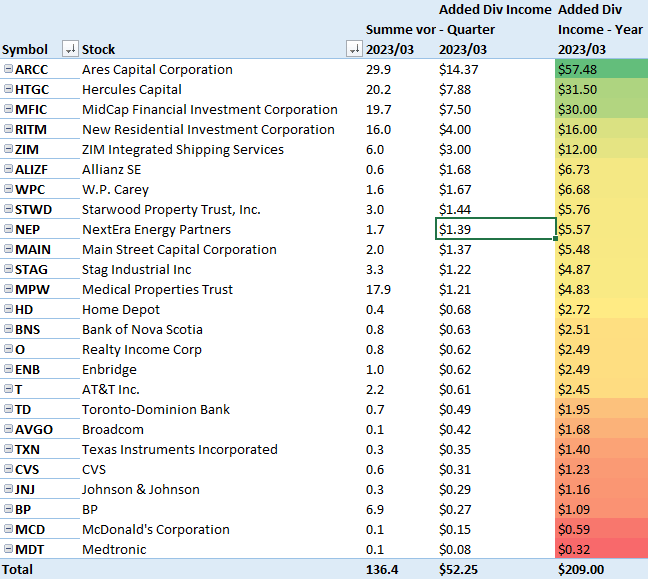
Following the sales of STORE Capital, Medical Properties Trust, Annaly Capital Management and Gladstone Commercial my forward annual dividend income dropped by around $320 and while I was very aggressive in redeploying these funds I came short by around $37. However, in March I expect to add at least $100 to my forward dividend income basis which is my minimum goal every month. All these purchases break down as follows:
Added Dividend Income (Designed by author)
All net purchases in March can be found below:
Net Purchases in March (Designed by author)
Dividend Income: What Happened on the Dividend Side?
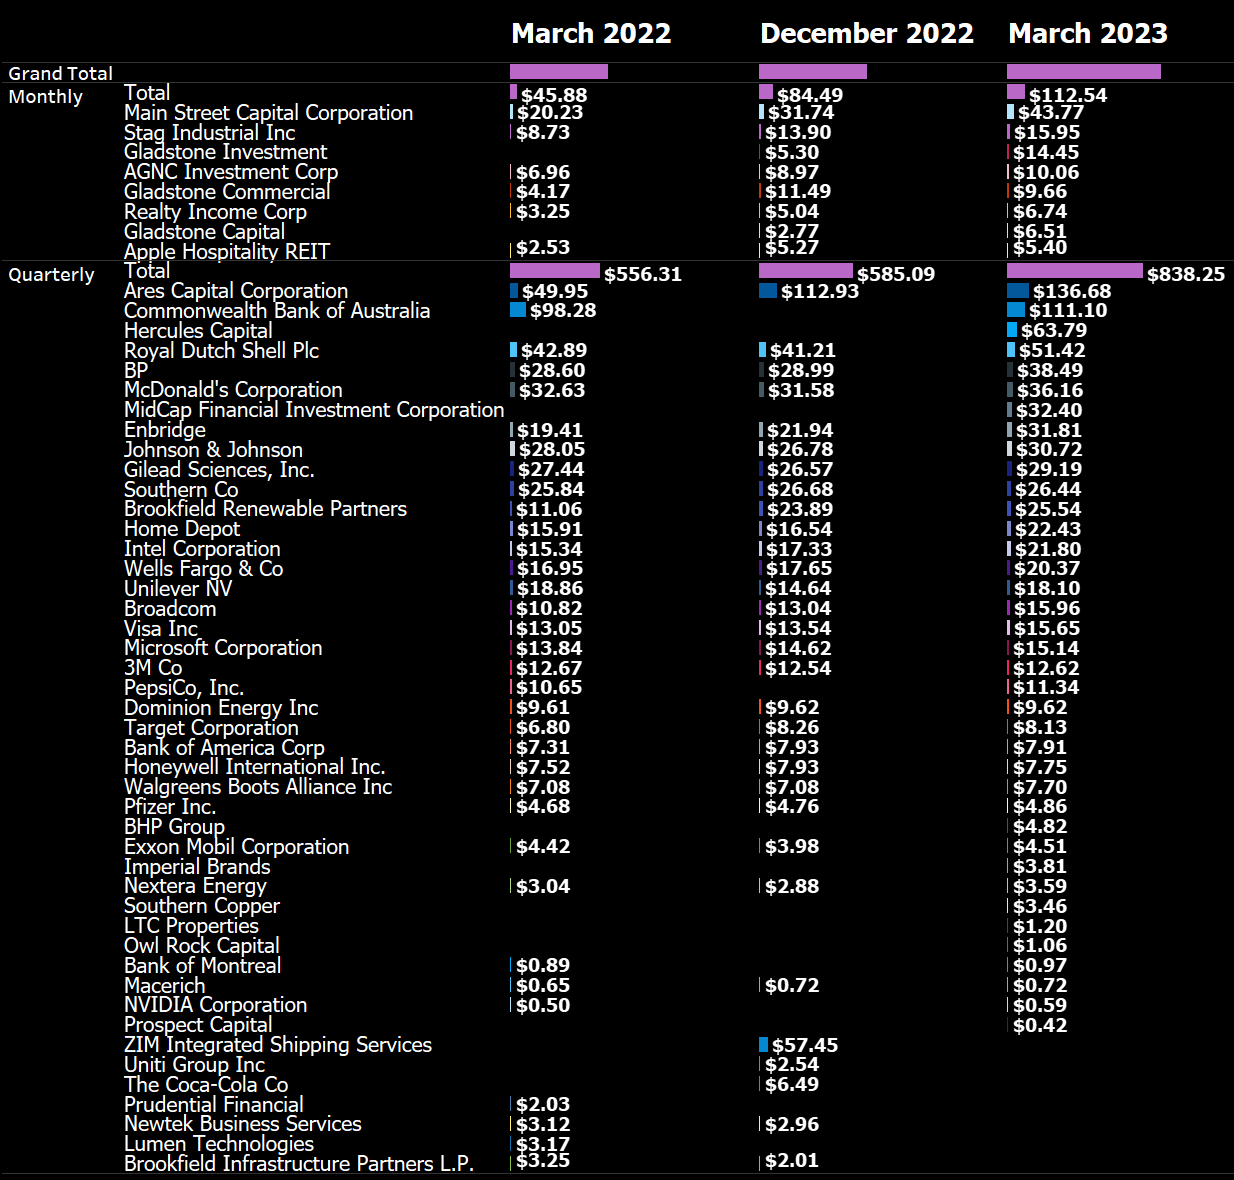
Dividend income hit a new blistering all-time record in March of $950. This represents growth of 61% Y/Y and 40% sequentially. These figures are more than impressive to me but the March 2023 dividend income benefits from several special circumstances. Adjusting these figures for the semi-annual dividend payment of the Commonwealth Bank of Australia ( OTCPK:CBAUF ) as well as the unusual payment pattern from Hercules Capital ( HTGC ) and MidCap Financial Investment Corporation ( MFIC ) Y/Y dividend income is still up 50% and by 20% sequentially.
Disregarding special dividends, on an annual basis, the biggest income driver is by far the Ares Capital, a stock I am running on a bi-weekly savings plan and where my contributions quickly translated into meaningful dividend income. Dividends from Ares have now already cleared the first psychologically important level of $100 and are well on its way towards the next milestone of $200. BDCs like ARCC have come under fire following the collapse of the Silicon Valley Bank and I am embracing these sales as great opportunities.
Similarly striking is that net dividends from monthly dividend payers have for the first time cleared $100 thanks to the big supplemental dividends from Main Street Capital ( MAIN ) and Gladstone Investment ( GAIN ).
March 2023 Dividend Income (Designed by author)
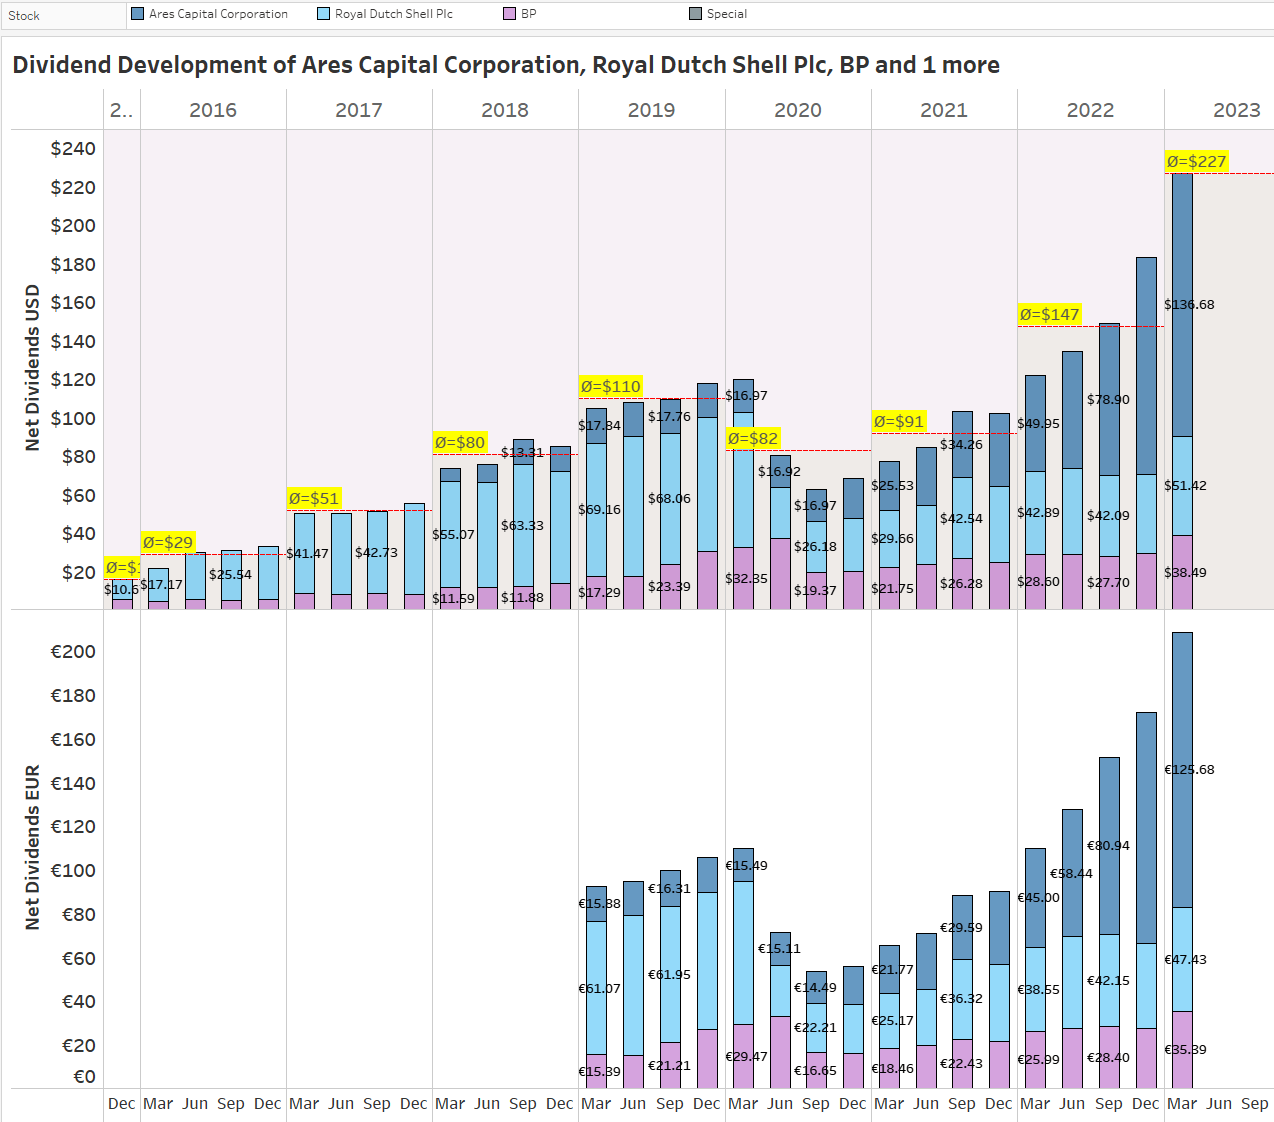
The growing share of ARCC dividends can also be seen when just looking at the top three dividend payers in March and the other quarter-ending months. In 2022 my top three regular March-June-September-December (MJSD) dividend payers generated an average of $147 per quarter which was sharply up from the $91 on average in 2021. Now the March quarter of 2023 has seen income from the Top-3 soar to $227 following heavy investments into ARCC and organic dividend raises from all three. This is the type of development I want to see and I can't believe that already these three combined will provide at least $1,000 this year, more likely something between $1,100 to $1,200 as I am planning to keep up my investment pace with ARCC. All this is depicted below:
Top 3 Dividend Payers (Designed by author)
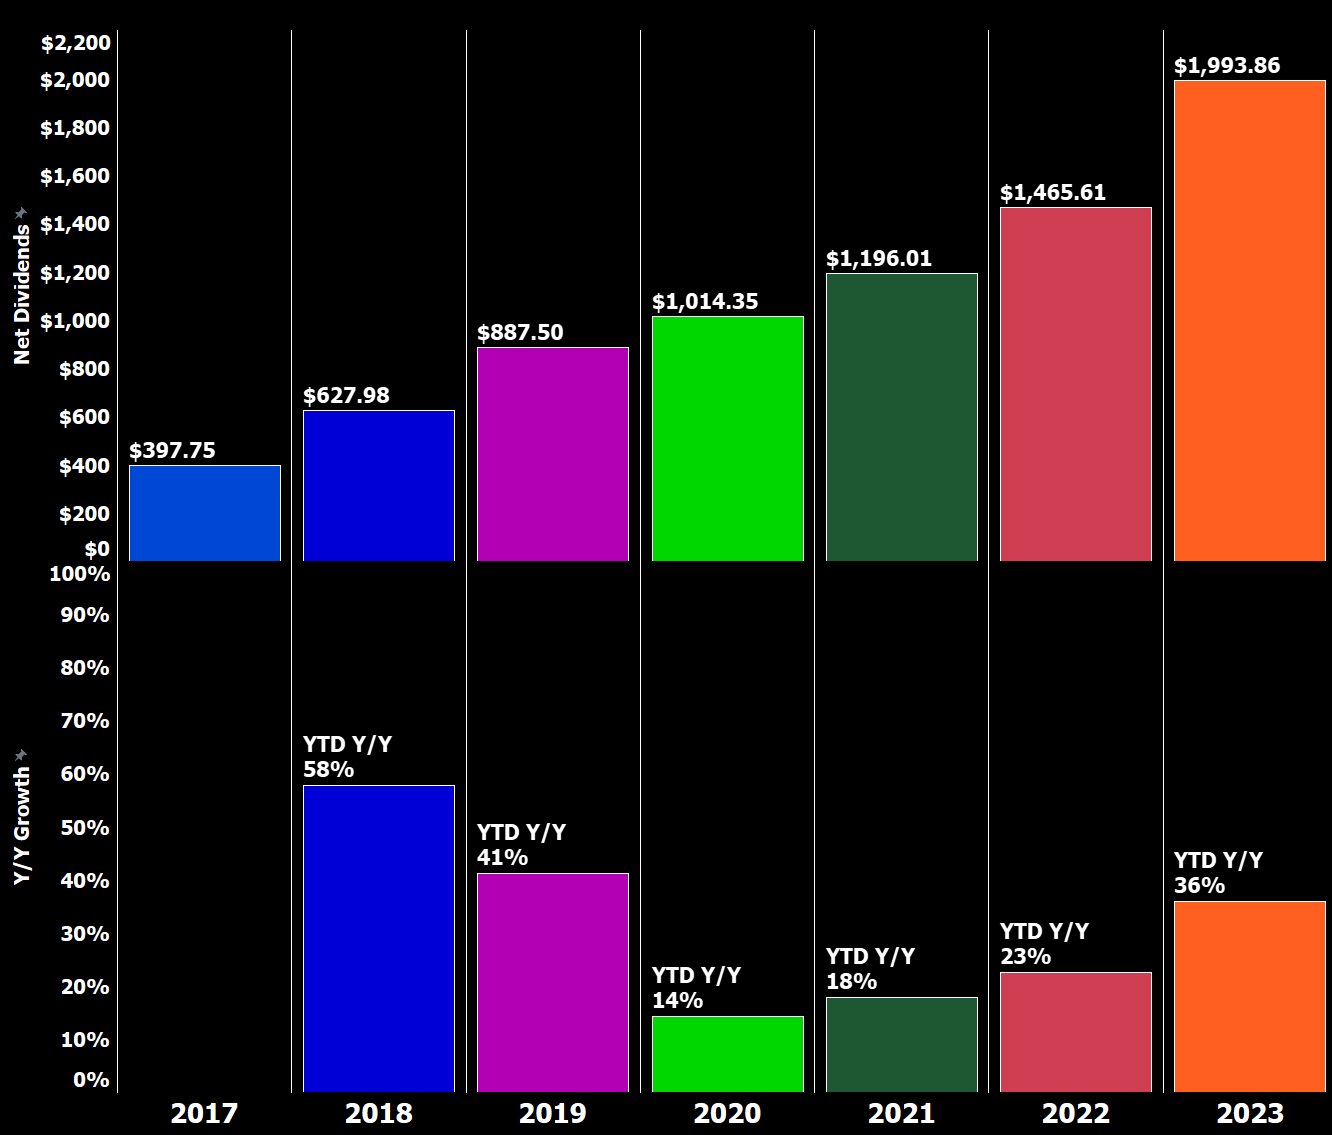
Here is a chart that shows the development of my net dividend income by month over time between 2015 and 2023. You can see the growth of my dividend income and the average annual dividend for each year:
All-time Dividend Development (Designed by author)
This chart is my favorite because it illustrates the progression of my dividend income over time and allows me to easily see the average annual dividend for each year.
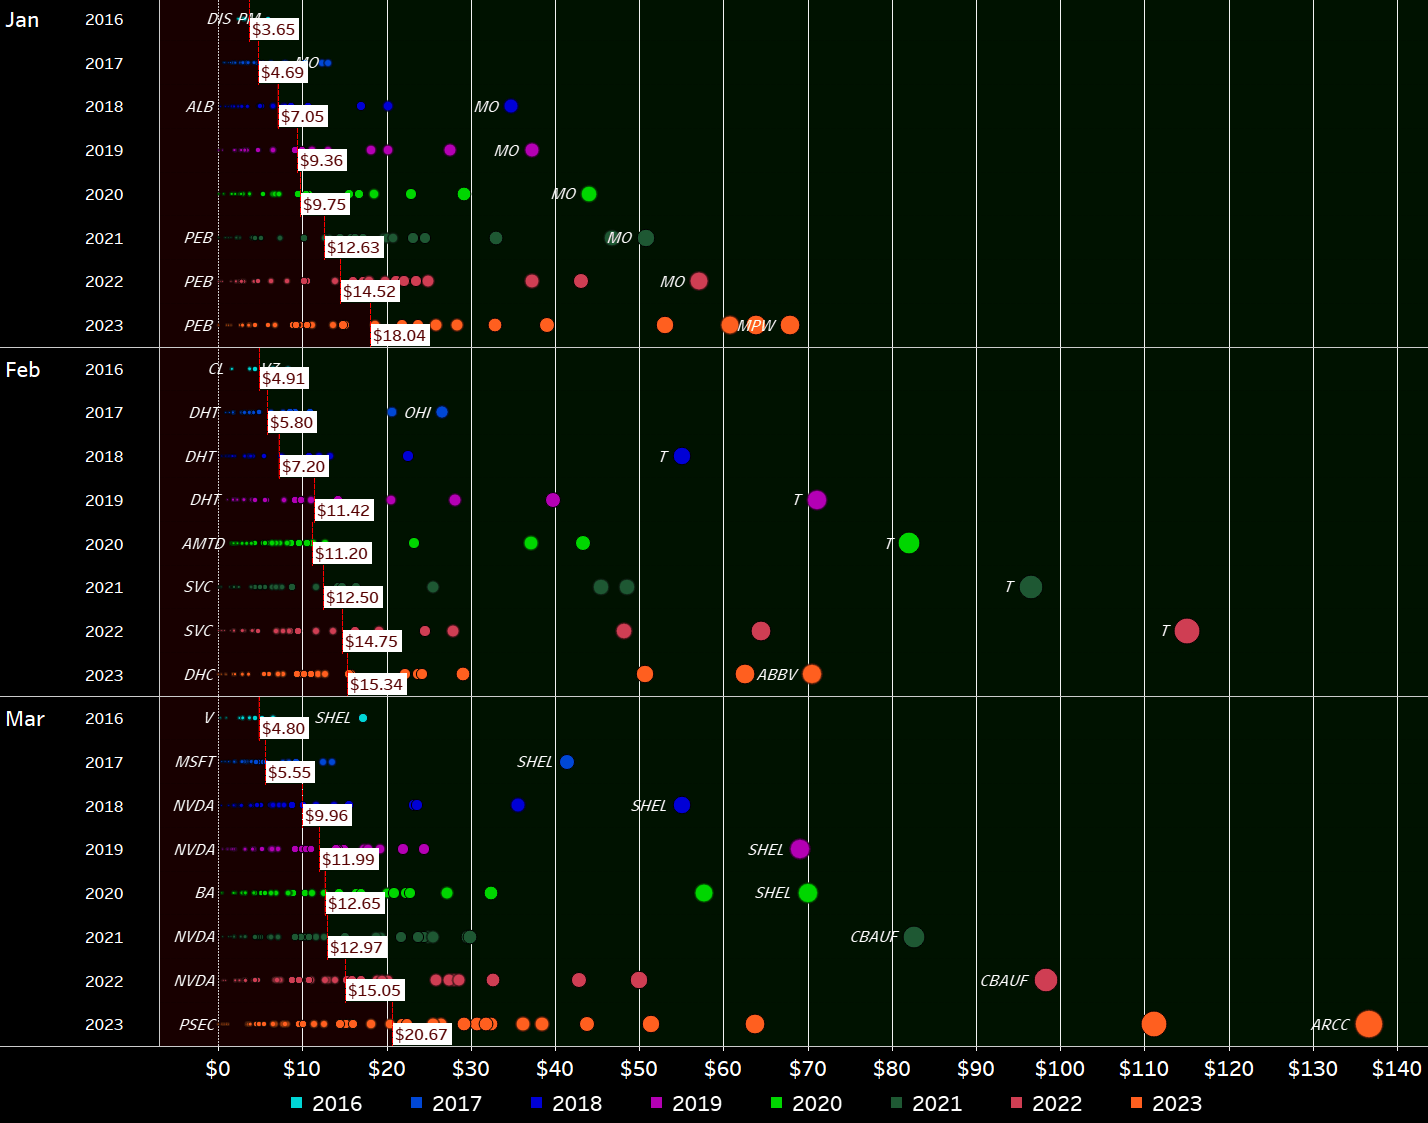
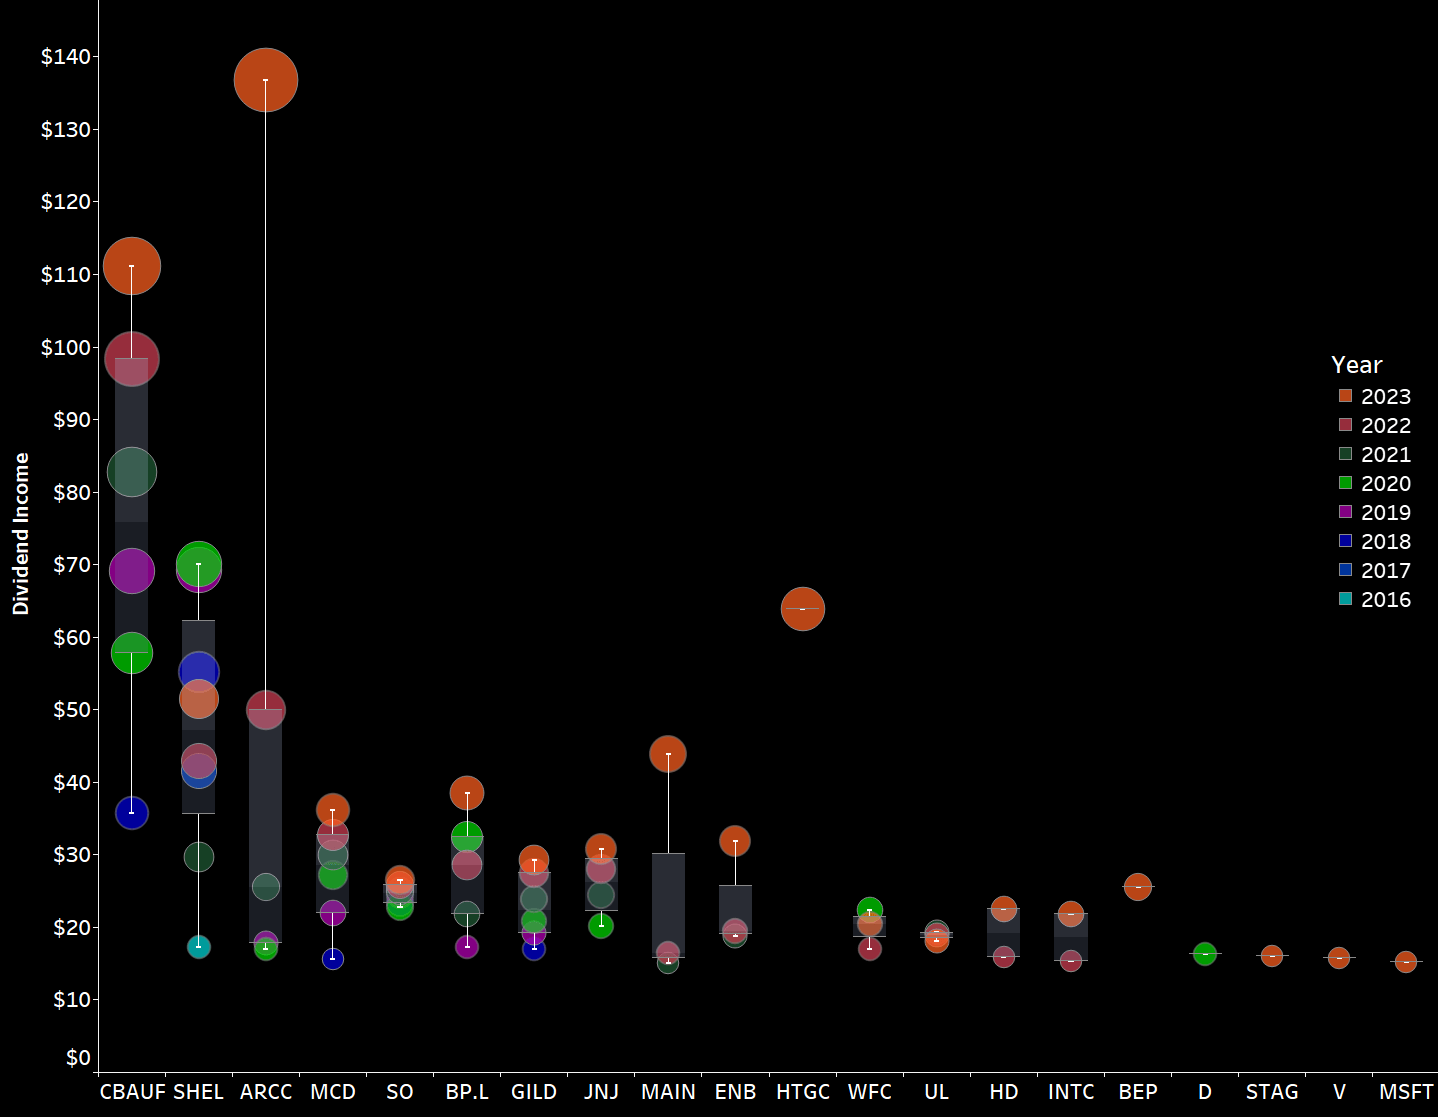
Next, I have plotted all of the individual dividend payments I have received, coloring them by year and arranging the years side by side instead of horizontally as in previous updates. This visualization allows for a more comprehensive analysis of the distribution of my dividend payments over time.
Dividend Payment Bubbles (Designed by author)
By plotting the data in this way, we can easily see the distribution of dividend payments across different years and gain insights into the overall growth of my dividend income over time.
This visualization is initially quite cluttered, but it contains a wealth of information. It shows every individual dividend payment I have received since I began my investment journey in 2015, represented as a circle that is colored and sized according to its contribution. The view is organized by month and year, allowing for a more comprehensive analysis of the development of my dividend income over time. For each year and month, a white rectangle indicates the average monthly dividend. The area where dividends fall below the average is filled in dark red, while the area above the average is colored dark green. I greatly prefer this redesigned version of my old "bubbles chart" because it makes it much easier to identify trends and developments in my dividend income. This type of data visualization allows for a detailed examination of the distribution of my dividend payments over time and enables me to more easily identify trends and patterns in my income growth.
March 2023 Dividends (Designed by author)
Now, zooming in on March , we can immediately see a number of big green circles in a sea of black. The bigger the circle and the bigger the distance to the previous circle for the same stock, the bigger is the change in dividend income compared to the prior years.
The importance of Ares Capital Corporation is clear, with a reddish circle indicating the massive jump in dividend income over the last 12 months due to heavy ongoing monthly investments. Ares Capital recently raised its dividend by double-digits and while I don't expect that to become the norm, I am more than happy with its current yield and have no plans to stop these monthly savings plans. By the end of the year December 2023 dividends should be somewhere between $150 and $200 I assume.
Overall, I aim to see as many big red circles at the top of the scale as possible, as this indicates rising dividend income.
Another way to express the monthly dividend income is in terms of Gifted Working Time (GWT). Assuming an average hourly rate of $32.34 for 2023, my GWT and annual net dividends have been as follows:
- 2018: 121 hours GWT, $3,000 in annual net dividends
- 2019: 142 hours GWT, $3,600 in annual net dividends
- 2020: 152 hours GWT, $3,800 in annual net dividends
- 2021: 180 hours GWT, $5,050 in annual net dividends
- 2022: 229 hours GWT, $6,400 in annual net dividends
- 2023: Targeting at least 216 hours GWT, $7,000 in annual net dividends
I expect overall GWT to decrease in 2023 due to higher calculated hourly rates, as I project a 10% increase in the hourly rate due to inflation.
The overall target for the year with $7,000 in annual net dividends is very conservative but I expect that I will have to take out some risk from my portfolio as mentioned above. Also, the stronger Euro (I am receiving dividends in EUR and then converting those to USD at current exchange rates for these updates) will have adverse impact. Still, as the year unfolds I expect to be able to pass that target and potentially even reach my next milestone of $8,000 as well. By the end of Q1/2023 my realized dividend income has exceeded my expectations by several dimensions with YTD net dividend growth coming in at a red-hot 36% Y/Y. That growth will certainly come down as the year unfolds but given I am only targeting a low single-digit growth rate, it is already clear that barring a major disaster I will easily achieve a double-digit growth rate in dividend income which is fantastic.
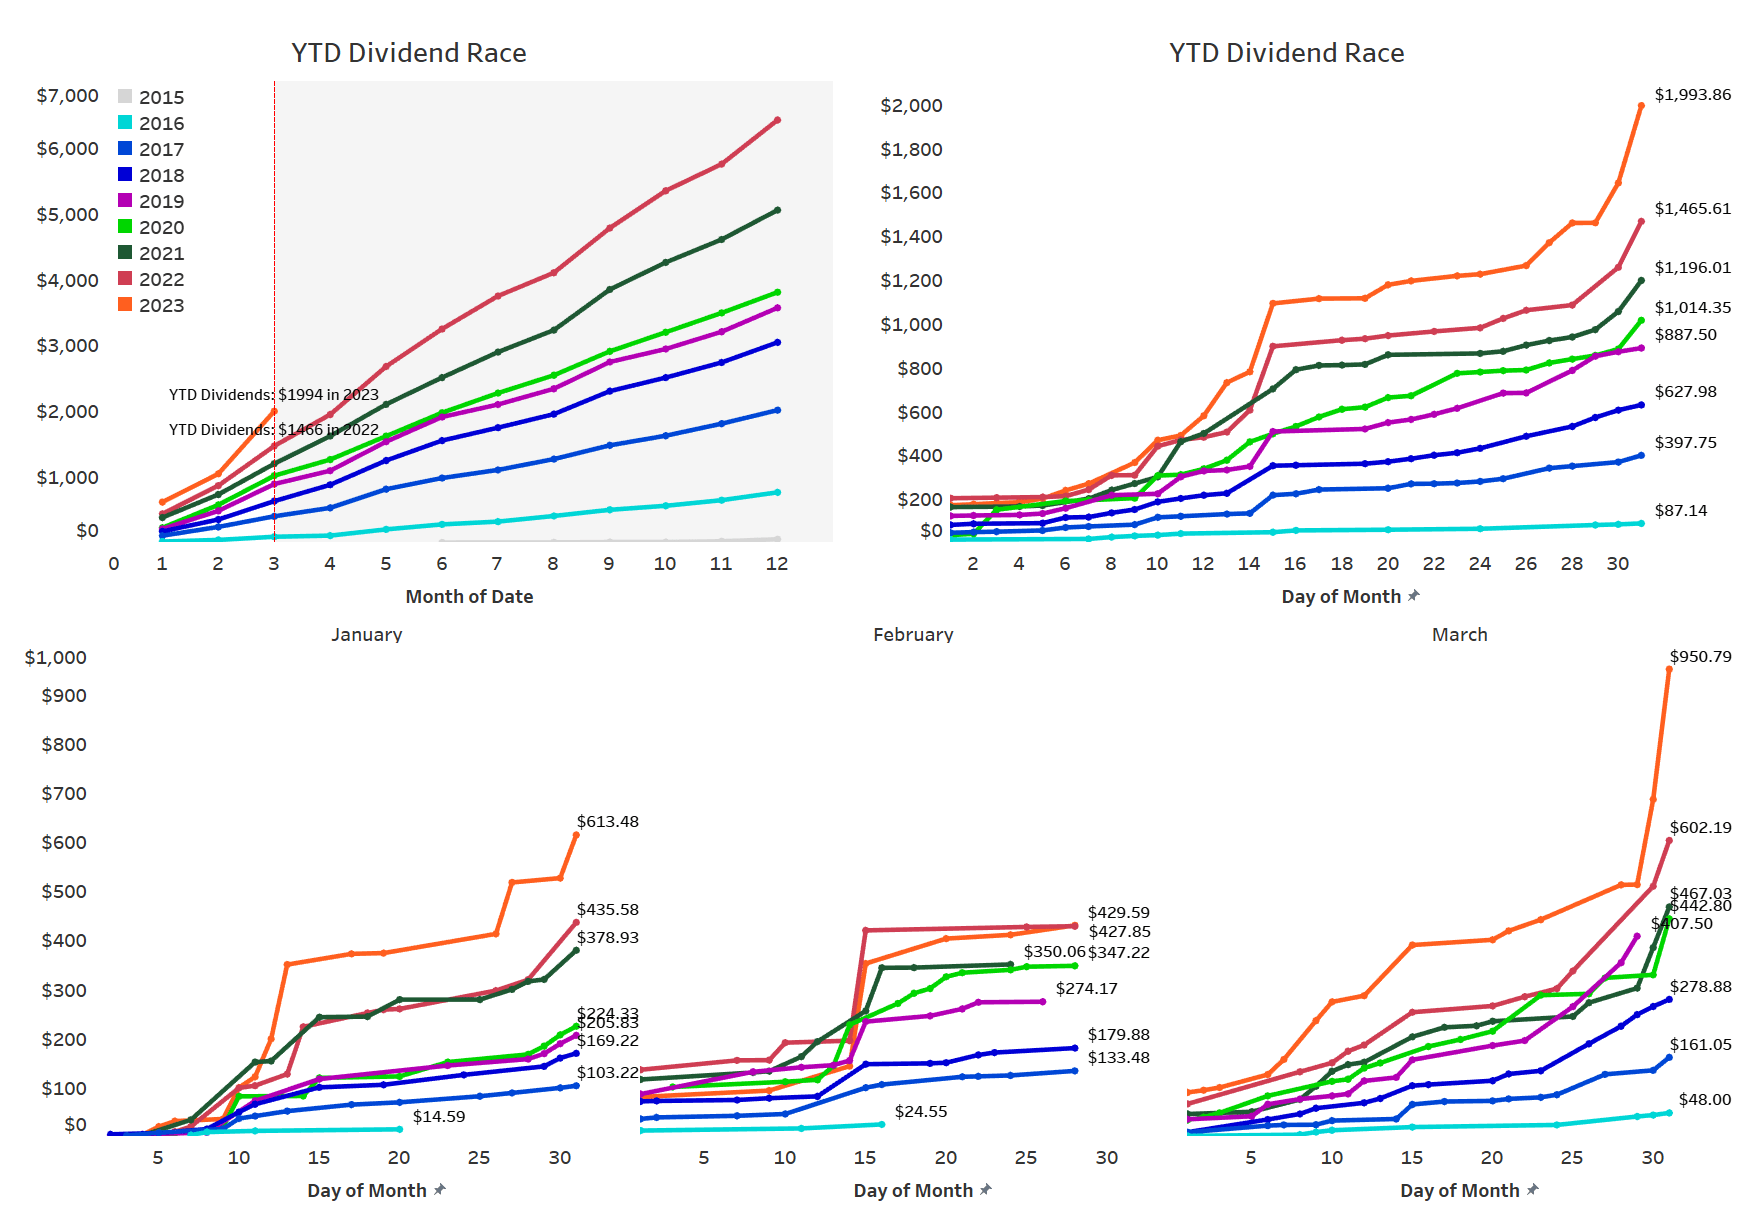
Across the years, my YTD Dividend Race has been as follows:
- 2018: Disappointing
- 2019: Phenomenal, benefiting from a low baseline in the prior year
- 2020: Fairly disappointing
- 2021: Phenomenal
- 2022: Much better than expected fueled by the very weak euro
- 2023: Targeting a conservative low single-digit growth rate
YTD Dividend Growth (Designed by author)
I have updated the YTD Dividend Race chart to show the development of YTD dividend income on a daily basis, allowing us to see that most of my dividend income is generated mid-month and towards the end of the month. The chart also breaks down the development by month for the current year, making it easy to identify significant jumps in income.
YTD Dividend Race (Designed by author)
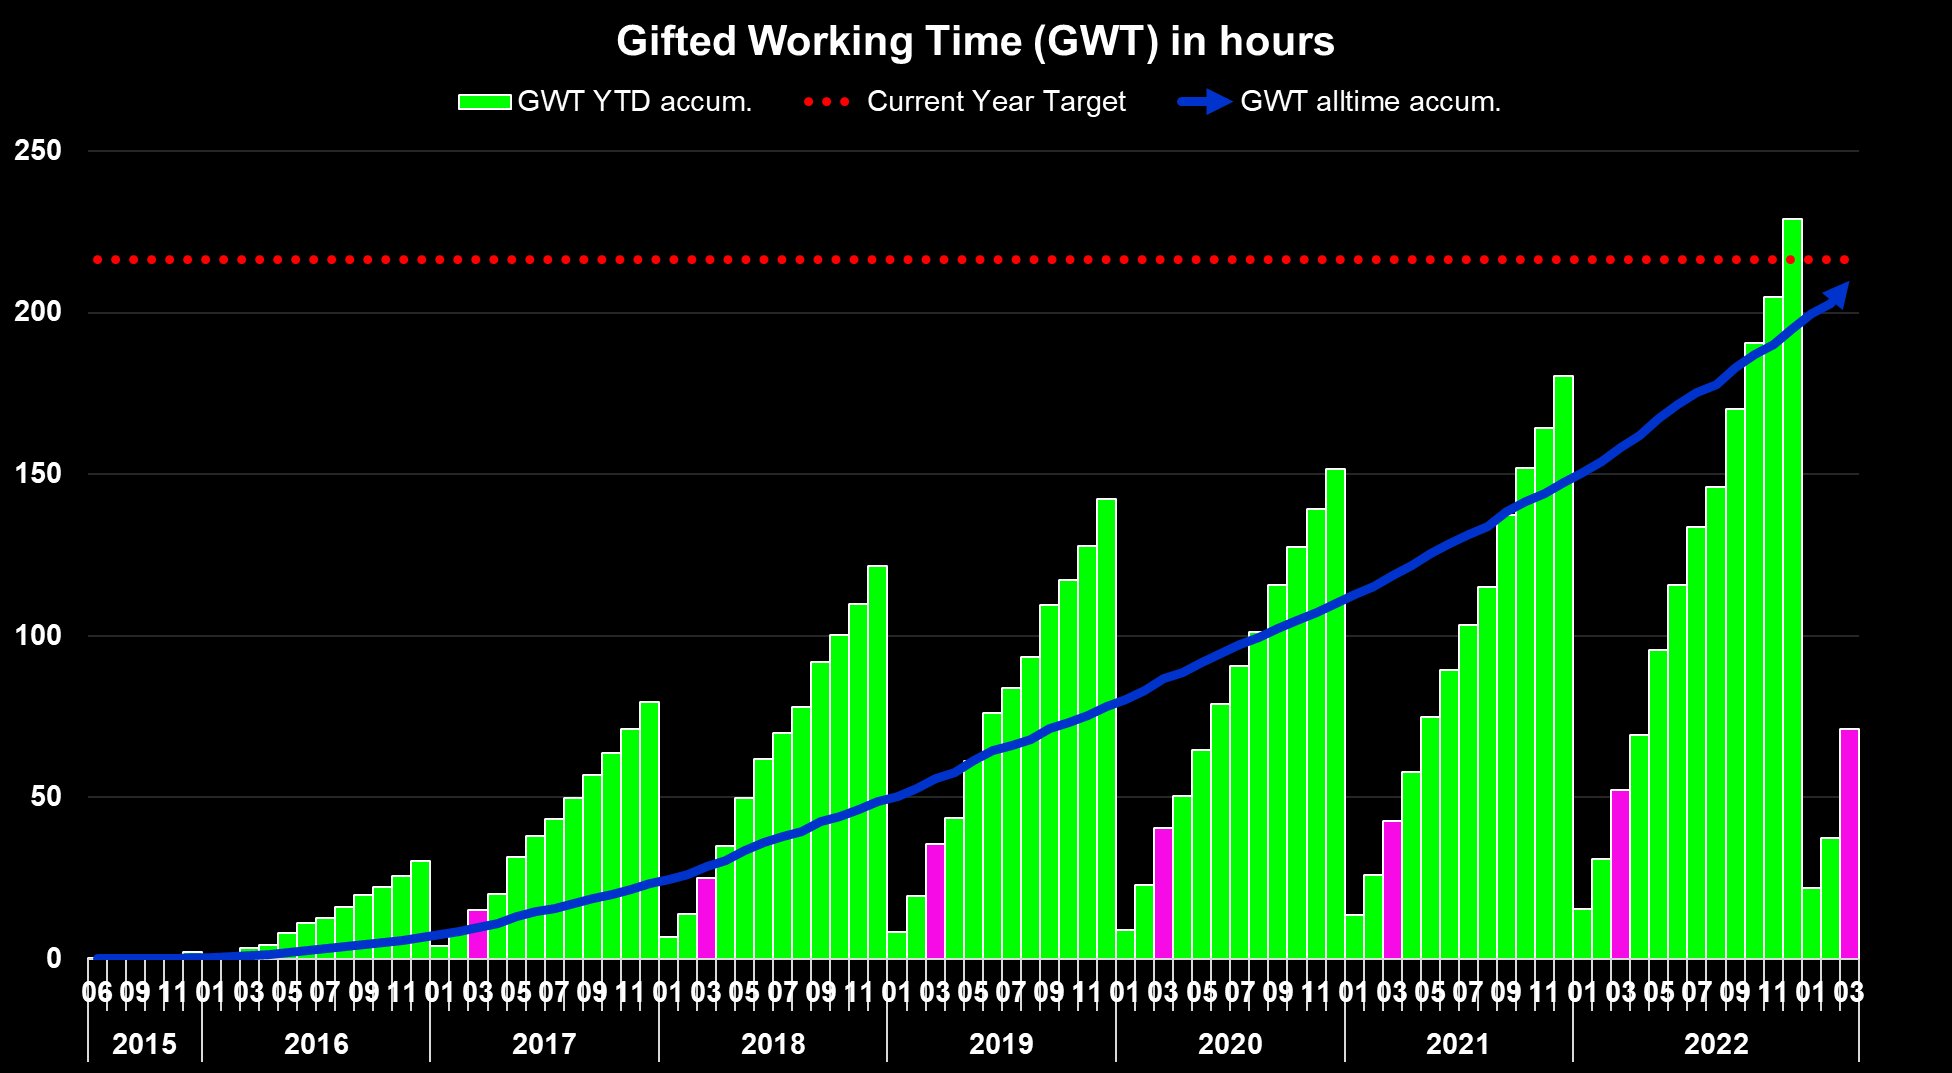
Expressed in GWT, it presents itself as follows:
Gifted Working Time in Hours (Designed by author)
What this shows is as follows:
- All time (blue area) - Around 1,007 hours, or 126 days, of active work have been replaced with passive income since the start of my dividend journey. Assuming a five-day workweek, this translates into 25 weeks of vacation funded via dividends.
- Full-year 2023 (green bars) - Around 71.2 hours, or 8.9 days, of active work have been replaced with passive income in 2023 already, which is almost two full-time work weeks funded with dividends.
- Highlighted in pink is the accumulated YTD total at the end of the current reporting month ( March ).
This visualization allows us to see the overall impact of my dividend income on the amount of active work I am able to replace with passive income. It also enables us to see the progress made year-to-date, as well as the accumulated total at the end of the current reporting month.
Upcoming April Dividends
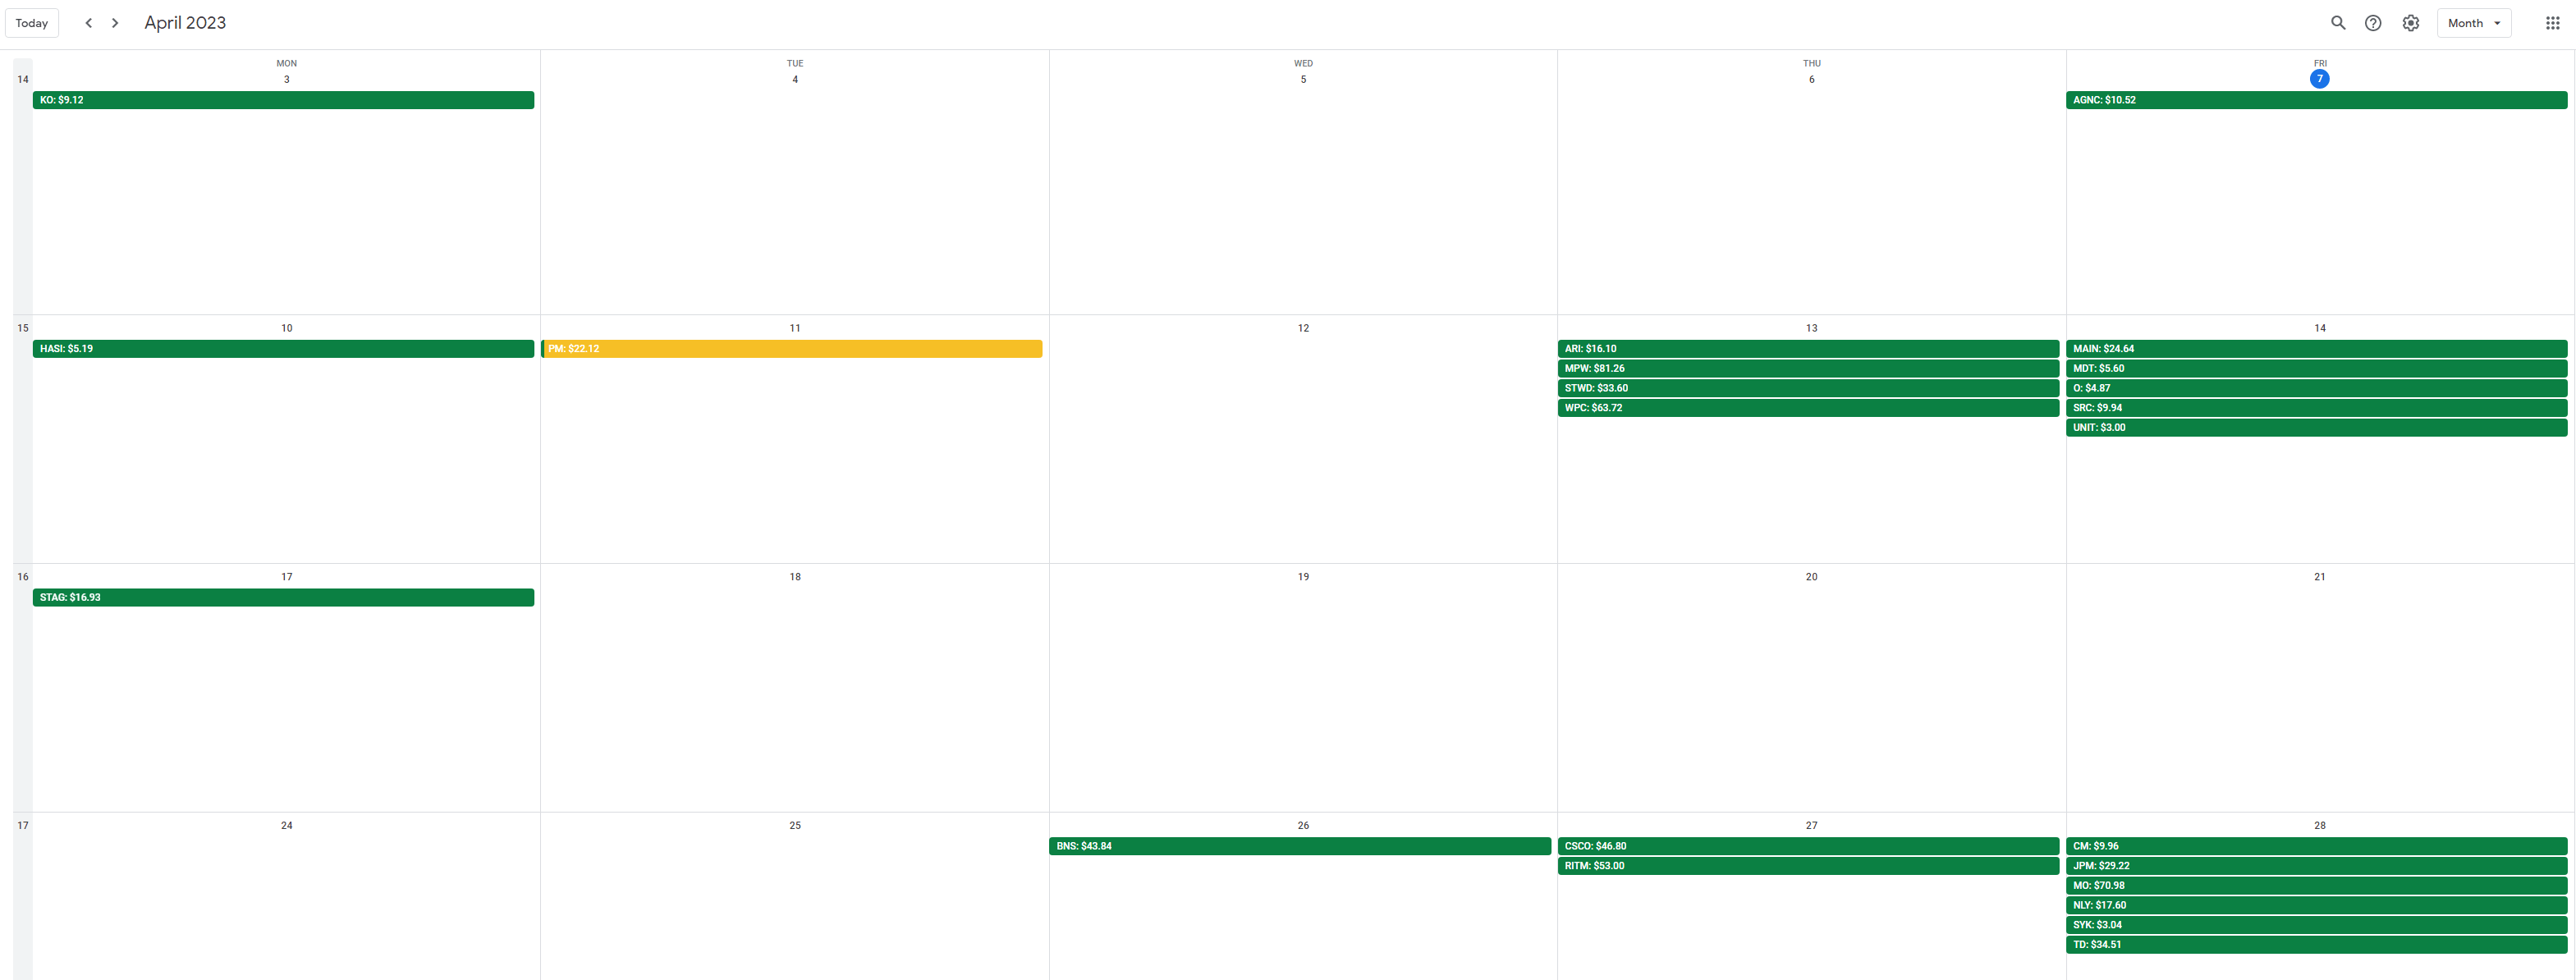
As every month, April is packed with dividend payments heavily concentrated around the 15th and at month-end when the dividend checks from Canada's big banks as well as JPMorgan will be arriving over a period of just 3-4 days.
Given the majority of my savings plans feature companies that pay dividends in January such as W. P. Carey, Altria ( MO ), Cisco Systems ( CSCO ), JPMorgan, Toronto-Dominion Bank, Bank of Nova Scotia, Stryker ( SYK ), Medtronic ( MDT ) as well as ongoing investments into stocks like Rithm Capital ( RITM ) and Annaly Capital ( NLY ), it surely is going to be a big month that should easily set a new all-time dividend record for the month of April.
The snapshot below is taken from my free-for-all released Dividend Calendar (make sure to follow instructions in the video) and shows my expected dividend payments in April.
My Dividend Calendar (Designed by author)
At the end of March, my dividend portfolio is composed as follows:
| Company Name |
| Ticker |
| % Market Value |
| Apple Inc. |
| ( AAPL ) |
| 11.37% |
| Visa Inc |
| ( V ) |
| 4.35% |
| AbbVie Inc |
| (ABBV) |
| 4.17% |
| McDonald's Corp |
| ( MCD ) |
| 3.93% |
| Microsoft Corporation |
| ( MSFT ) |
| 3.57% |
| Cisco Systems, Inc. |
| ( CSCO ) |
| 2.93% |
| Ares Capital |
| ( ARCC ) |
| 2.58% |
| AT&T Inc. |
| ( T ) |
| 2.47% |
| Johnson & Johnson |
| ( JNJ ) |
| 2.43% |
| W.P. Carey |
| ( WPC ) |
| 2.38% |
| Main Street Capital |
| ( MAIN ) |
| 2.21% |
| Shell |
| ( SHEL ) |
| 2.18% |
| NVIDIA Corporation |
| (NVDA) |
| 2.17% |
| Stag Industrial Inc |
| (STAG) |
| 2.17% |
| Texas Instruments Incorporated |
| (TXN) |
| 1.94% |
| JPMorgan Chase & Co. |
| ( JPM ) |
| 1.81% |
| Gilead Sciences, Inc. |
| ( GILD ) |
| 1.75% |
| Southern Co |
| ( SO ) |
| 1.74% |
| Allianz SE |
| ( OTCPK:ALIZF ) |
| 1.69% |
| Home Depot |
| ( HD ) |
| 1.68% |
| Altria Group Inc |
| ( MO ) |
| 1.64% |
| Toronto-Dominion Bank |
| (TD) |
| 1.49% |
| Wells Fargo & Co |
| ( WFC ) |
| 1.41% |
| Siemens Healthineers |
| ( OTCPK:SEMHF ) |
| 1.39% |
| Bank of Nova Scotia |
| ( BNS ) |
| 1.37% |
| Broadcom Inc |
| (AVGO) |
| 1.18% |
| BMW |
| ( OTCPK:BMWYY ) |
| 1.15% |
| Enbridge |
| ( ENB ) |
| 1.14% |
| Blackstone Group LP |
| ( BX ) |
| 1.08% |
| Intel Corporation |
| (INTC) |
| 1.05% |
| Commonwealth Bank of Australia |
| ( OTCPK:CBAUF ) |
| 1.03% |
| PepsiCo, Inc. |
| ( PEP ) |
| 1.01% |
| Hercules Capital |
| (HTGC) |
| 1.01% |
| New Residential Corporation |
| (RITM) |
| 1.01% |
| Procter & Gamble Co |
| ( PG ) |
| 0.92% |
| BP2 |
| ( BP ) |
| 0.92% |
| Morgan Stanley |
| ( MS ) |
| 0.91% |
| BP1 |
| ( BP ) |
| 0.85% |
| Philip Morris International Inc. |
| ( PM ) |
| 0.81% |
| Honeywell International Inc. |
| ( HON ) |
| 0.72% |
| Daimler |
| (DTRUY) |
| 0.70% |
| Realty Income Corp |
| ( O ) |
| 0.69% |
| Brookfield Renewable Partners |
| ( BEP ) |
| 0.64% |
| Target Corporation |
| (TGT) |
| 0.64% |
| Starwood Property Trust, Inc. |
| (STWD) |
| 0.63% |
| Apollo Investment |
| ( MFIC ) |
| 0.62% |
| Bank of America Corp |
| ( BAC ) |
| 0.59% |
| The Coca-Cola Co |
| (KO) |
| 0.59% |
| Stryker |
| ( SYK ) |
| 0.57% |
| Unilever NV ADR |
| ( UL ) |
| 0.56% |
| NextEra Energy Partners LP |
| ( NEP ) |
| 0.56% |
| Gladstone Commercial Corporation |
| (GOOD) |
| 0.52% |
| Medical Properties Trust |
| ( MPW ) |
| 0.52% |
| 3M Co |
| ( MMM ) |
| 0.49% |
| Royal Bank of Canada |
| ( RY ) |
| 0.46% |
| Apple Hospitality REIT |
| ( APLE ) |
| 0.44% |
| Annaly Capital Management |
| ( NLY ) |
| 0.44% |
| CVS Health Corp |
| (CVS) |
| 0.42% |
| Dominion Energy Inc |
| ( D ) |
| 0.41% |
| Verizon Communications Inc. |
| (VZ) |
| 0.40% |
| Sino AG |
| (XTP.F) |
| 0.39% |
| B&G Foods, Inc. |
| ( BGS ) |
| 0.36% |
| BASF |
| ( OTCQX:BASFY ) |
| 0.35% |
| Spirit Realty Corporation |
| ( SRC ) |
| 0.35% |
| Medtronic |
| (MDT) |
| 0.33% |
| Gladstone Investment |
| ( GAIN ) |
| 0.33% |
| Gladstone Capital |
| (GLAD) |
| 0.33% |
| Canadian Imperial Bank of Commerce |
| ( CM ) |
| 0.32% |
| Exxon Mobil Corporation |
| (XOM) |
| 0.32% |
| Walgreens Boots Alliance Inc |
| ( WBA ) |
| 0.32% |
| AGNC Investment Corporation |
| ( AGNC ) |
| 0.32% |
| NextEra Energy |
| ( NEE ) |
| 0.32% |
| General Electric Company |
| ( GE ) |
| 0.31% |
| Pfizer Inc. |
| ( PFE ) |
| 0.28% |
| Antero Midstream Corporation |
| ( AM ) |
| 0.27% |
| Kinder Morgan Inc |
| ( KMI ) |
| 0.25% |
| ZIM Integrated Shipping Services |
| ( ZIM ) |
| 0.24% |
| Alibaba Group Holding Ltd |
| ( BABA ) |
| 0.24% |
| Sixt |
| (SXTSY) |
| 0.23% |
| Apollo Commercial Real Est. Finance Inc |
| ( ARI ) |
| 0.19% |
| Bayer AG |
| ( OTCPK:BAYZF ) |
| 0.19% |
| Mastercard |
| ( MA ) |
| 0.18% |
| Colgate-Palmolive Company |
| ( CL ) |
| 0.18% |
| Omega Healthcare Investors Inc |
| (OHI) |
| 0.16% |
| BRT Realty Trust |
| (BRT) |
| 0.15% |
| Vonovia |
| (VONOY) |
| 0.10% |
| Blue Owl Capital |
| (OWL) |
| 0.08% |
| Fresenius SE |
| ( OTCPK:FSNUF ) |
| 0.08% |
| Boeing |
| ( BA ) |
| 0.07% |
| Walt Disney Co |
| (DIS) |
| 0.05% |
| Bank of Montreal |
| (BMO) |
| 0.04% |
| Fresenius Medical Care |
| (FMS) |
| 0.04% |
| Equitrans Midstream Corporation |
| (ETRN) |
| 0.03% |
| Newtek Business Services |
| (NEWT) |
| 0.03% |
| Uniti Group Inc |
| (UNIT) |
| 0.03% |
| The GEO Group Inc |
| (GEO) |
| 0.03% |
| Owl Rock Capital Corporation |
| (ORCC) |
| 0.03% |
| Diversified Healthcare Trust |
| (DHC) |
| 0.03% |
| Service Properties Trust |
| (SVC) |
| 0.02% |
For further details see:
My Dividend Stock Portfolio: New All-Time Dividend Record - 99 Holdings With 25 Buys