UNIT - My Dividend Stock Portfolio: New December Dividend Record - 98 Holdings With 18 Buys
2024-01-10 08:20:00 ET
Summary
- The S&P500 delivered a strong year-end rally, gaining 4.5% in December and 26.3% for the year.
- Interest rates were kept steady in a range of 5.25% to 5.5% with the market expecting up to 6 decreases in 2024.
- Net investments of around $1,500 in December, primarily targeting the financial sector and high-yielding BDCs.
- Dividend income hit a December record of $935, up 35% annually and flat sequentially, with the goal of adding at least $100 in forward dividend income every month hit again.
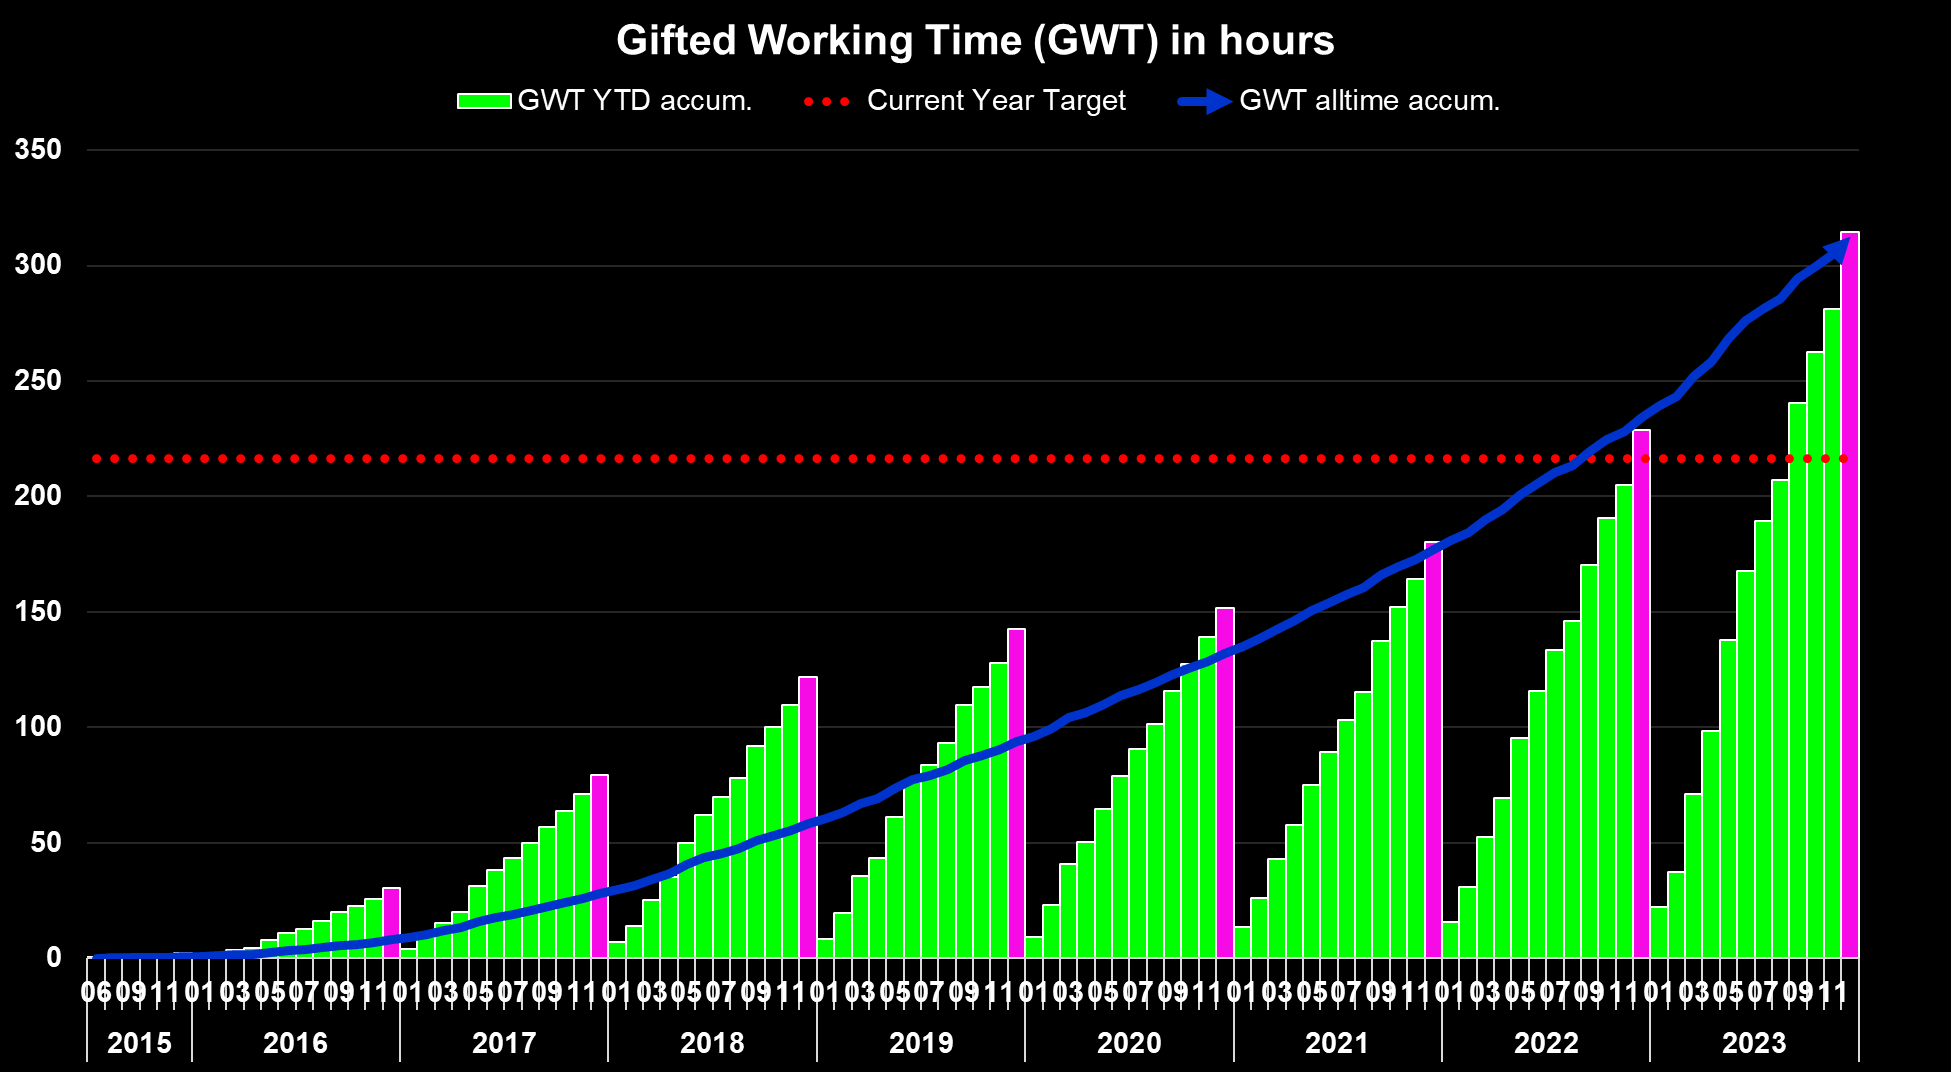
- Gifted Working Time 2023: Around 315 hours, or 39.3 days, of active work have been replaced with passive income in 2023 already, which is basically equivalent to eight full-time working weeks funded with dividends or more than 2 extra monthly salaries.
The Year-end Rally was in full swing in December with the broad S&P500 ( SPY ) climbing a whopping 4.5% and closing out this terrific year with a gain of 26.3% marking one of the best years in the past decade. This strong performance was mostly driven by the Magnificent 7 and the underlying AI rally as well as expectations about the Fed pivoting towards a series of rate cuts in 2024. Interest rates have remained unchanged over the last quarter as the Fed left its target rate range at 5.25% to 5.50%. All eyes will again be on the Fed in 2024.
There is still some doubt regarding a soft landing, but, in my opinion, there won't be any type of recession (at most a technical one) and if it will be as short-lived as the brief 2022 bear market in stocks, which, in my opinion, was also a non-noteworthy event.
Personally, December was a very enriching and memorable month for me as I finally managed to visit South East Asia for the very first time and was able to spend almost 4 wonderful weeks in the beautiful country of Vietnam. Such experiences are priceless and the best reward I can imagine to spend dividends on. Naturally, I am trying to invest as much as I can in the markets in order to fuel my journey towards financial independence but none of that should stop you from creating memories and experiences and sacrifice these treasures of life for cold cash. As a result, I was not able to publish a designated November portfolio update and thus will focus this update on December and some full-year 2023 observations.
Portfolio Changes in December
Due to my vacation which covered most of December and timezone differences between Vietnam and the USA investment activity was notably lower even though I did manage to put in a couple of purchases nevertheless. Overall, I invested around $1,500.
My favorite asset class, BDCs, has performed extremely well in 2023 and at these prices ongoing buying becomes more and more difficult. Still, in December most of my investments were targeted towards BDCs like Hercules Capital ( HTGC ), MidCap Financial Investment Corporation ( MFIC ) and bellwether stock Ares Capital Corporation ( ARCC ). Buying opportunities continue to fade, but even with lower yields, I still very much favor BDCs and won't stop buying.
My biggest purchase in December 2023 were several small transactions to acquire more shares of Ares Capita, which remains my #1 dividend payer in the entire portfolio and that has now led to record dividend income in December. Similarly, I made several investments into Hercules Capital, MidCap Financial Investment Corporation and Main Street Capital Corporation ( MAIN ).
Overall, I did manage to add $116 in forward annual dividend income this month, which brings total 2023 added annual dividend income to a record $1,640 which was surprisingly in-line with the 2022 figure of $1,680. Honestly, I never checked these total figures before and thus it came as a big surprise to me and I can't wait to harvest all that forward dividend income this year. My goal is to be able to add at least $100 in forward dividend income every month and as things are developing right now, this remains a very reasonable and realistic target to achieve in 2024 as well and probably overachieve again as long as BDCs remain part of my asset allocation.
All these purchases break down as follows:
Added Dividend Income (Designed by author)
All net purchases in December can be found below:
Net Purchases in December (Designed by author)
Dividend Income December 2023
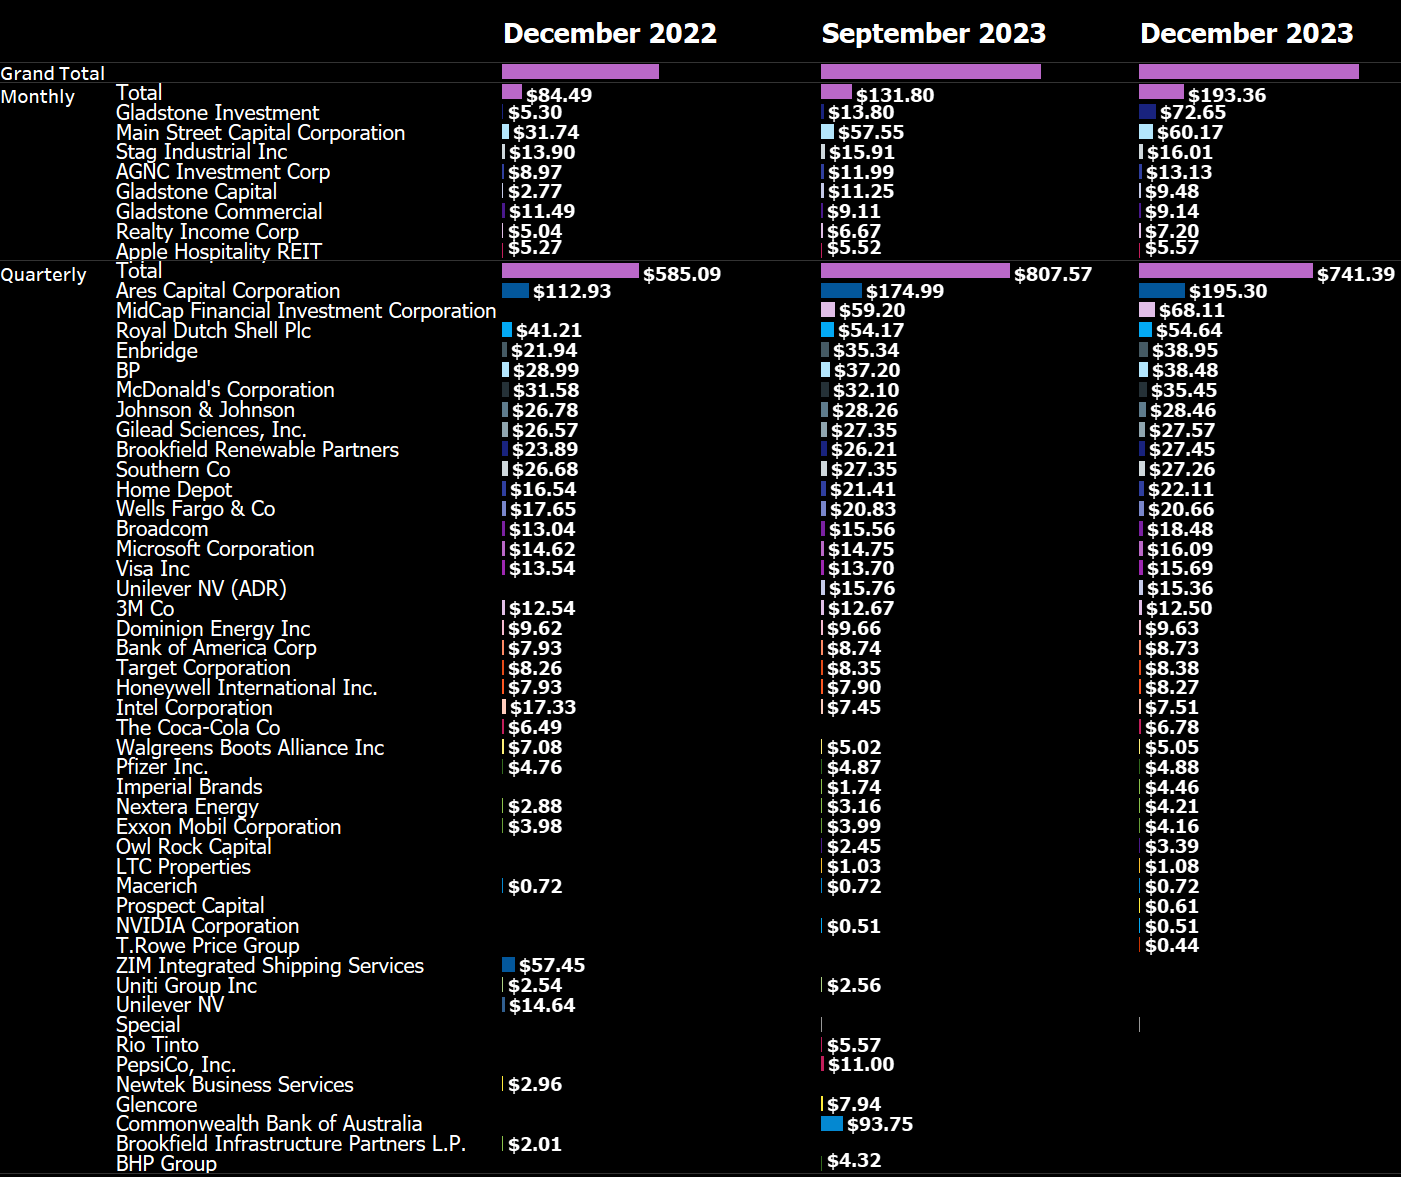
Dividend income hit a new blistering December record of $935. This represents growth of 35% Y/Y and is flat sequentially. These figures are more than impressive to me, especially as the September 2023 dividend income benefited from the sizable semi-annual dividend payment of the Commonwealth Bank of Australia ( OTCPK:CBAUF ). Excluding that effect, sequential growth comes in at 7% and thus overall quarterly dividend income is inching closer to that illustrious $1,000 barrier. Admittedly, the December figures also included a special effect as Gladstone Investment Corporation ( GAIN ) paid out a huge special dividend of $0.88 per share which boosted overall income by around $50.
Disregarding special dividends, on an annual basis, the biggest income driver is by far Ares Capital, a stock I am running at minimum on a bi-weekly savings plan (but most of the time I am buying stock at least once per week and sometimes daily) and where my contributions quickly translated into meaningful dividend income. Dividends from Ares are now quickly approaching the next big psychologically milestone of $200 as this quarter's dividend income already amounts to $195. Dividend income from MFIC is also rising quickly - although not on the same level as that from ARCC - and has now almost reached $70.
Similarly striking is that net dividends from monthly dividend payers have now comfortably cleared the $100 level thanks to the big supplemental dividends from Main Street Capital and Gladstone Investment. Contrary to previous quarters, this time with the help of GAIN's special dividend, this group of dividend payers has contributed almost $200 to the December tally. I am buying more shares of MAIN, GAIN, GLAD and O every month and thus that monthly dividend income level will continue to rise month after month although the months where the big supplemental dividends hit are truly something special.
December 2023 Dividend Income (Designed by author)
The dividend income from my top-3 regular dividend payers in December continues to grow and has pushed the 2023 average to a staggering $270 which literally exploded compared to the year-ago 2022 value of just around $118. In Q4 alone they have generated dividends of $318 which implies growth in 2024 of at least 18% vs the 2023 average but as I am continually buying more shares that growth rate may end up closer to 25% to 30%.
All this is depicted below:
Top 3 Dividend Payers (Designed by author)
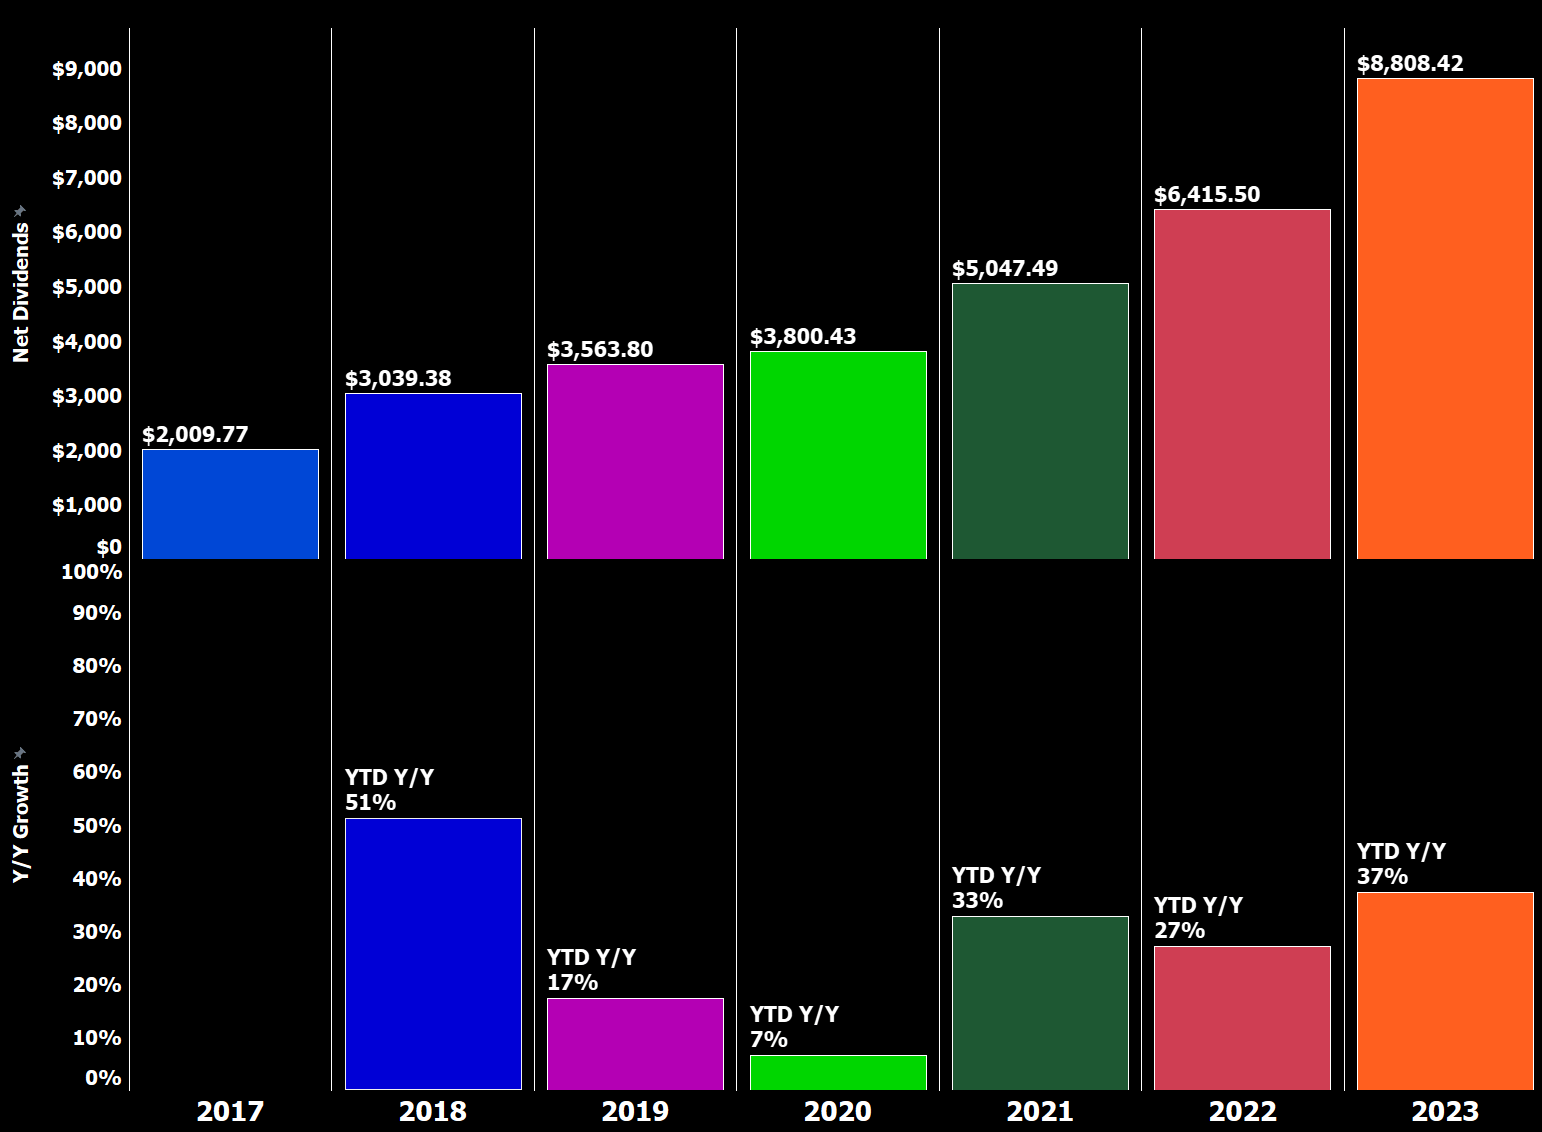
Here is a chart that shows the development of my net dividend income by month over time between 2015 and 2023. You can see the growth of my dividend income and the average annual dividend for each year:
All-time Dividend Development (Designed by author)
This chart is my favorite because it illustrates the progression of my dividend income over time and allows me to easily see the average annual dividend for each year.
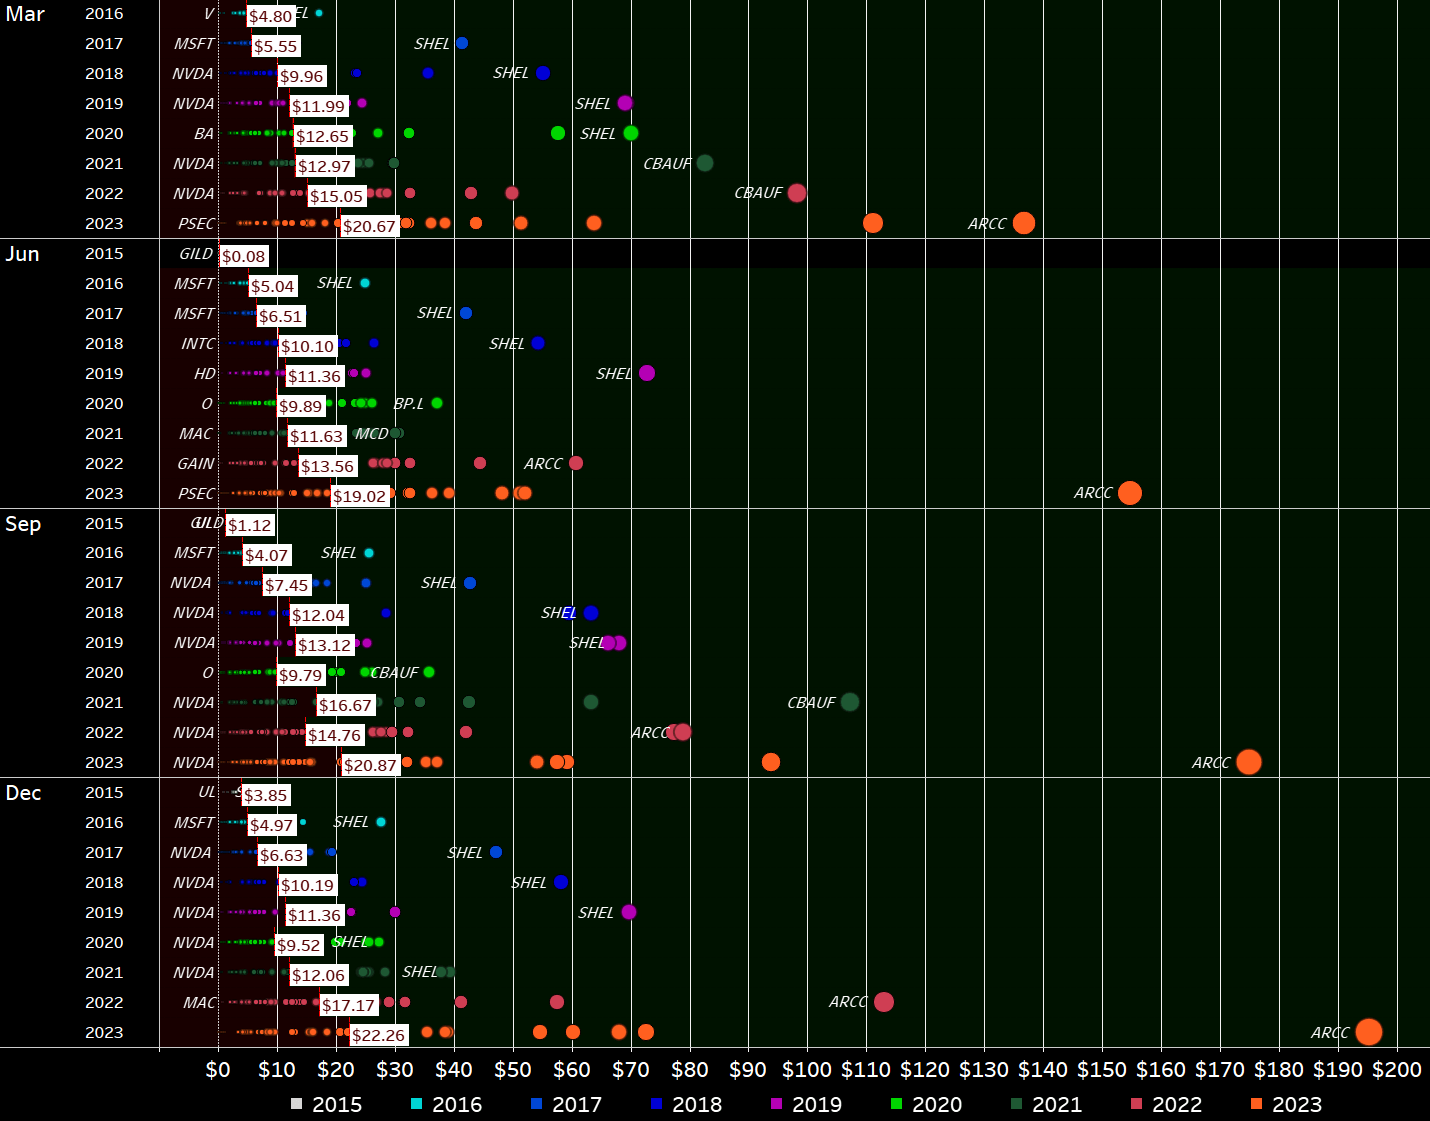
Next, I have plotted all of the individual dividend payments I have received, coloring them by year and arranging the years side by side instead of horizontally as in previous updates. This visualization allows for a more comprehensive analysis of the distribution of my dividend payments over time.
Dividend Payment Bubbles (Designed by author)
By plotting the data in this way, we can easily see the distribution of dividend payments across different years and gain insights into the overall growth of my dividend income over time.
This visualization is initially quite cluttered, but it contains a wealth of information. It shows every individual dividend payment I have received since I began my investment journey in 2015, represented as a circle that is colored and sized according to its contribution. The view is organized by month and year, allowing for a more comprehensive analysis of the development of my dividend income over time. For each year and month, a white rectangle indicates the average monthly dividend. The area where dividends fall below the average is filled in dark red, while the area above the average is colored dark green. I greatly prefer this redesigned version of my old "bubbles chart" because it makes it much easier to identify trends and developments in my dividend income. This type of data visualization allows for a detailed examination of the distribution of my dividend payments over time and enables me to more easily identify trends and patterns in my income growth.
December 2023 Dividends (Designed by author)
Now zooming in on December , we can immediately see a number of big green circles in a sea of black. The bigger the circle and the bigger the distance to the previous circle for the same stock, the bigger is the change in dividend income compared to the prior years.
The importance of Ares Capital Corporation is clear, with a reddish circle indicating the massive jump in dividend income over the last 12 months due to heavy ongoing monthly investments and I have no plans to stop these monthly savings plans. Similarly, the big year-over-year increases in dividend income from MAIN, MFIC and GAIN also clearly stand out visually in that chart.
Apart from that when it comes to the dividends for 2023, I notice mostly orange circles at the top of the scale, which is exactly what I want to see. These big orange circles represent a rising dividend income, and my goal is to have as many of them as possible at the top of the chart.
Overall, my aim is to observe numerous large orange circles positioned at the highest point on the scale. This signifies a positive trend of increasing dividend income, which is precisely what I'm striving for.
Another way to express the monthly dividend income is in terms of Gifted Working Time (GWT). Assuming an average hourly rate of $32.34 for 2023, my GWT and annual net dividends have been as follows:
- 2018: 121 hours GWT, $3,000 in annual net dividends
- 2019: 142 hours GWT, $3,600 in annual net dividends
- 2020: 152 hours GWT, $3,800 in annual net dividends
- 2021: 180 hours GWT, $5,050 in annual net dividends
- 2022: 229 hours GWT, $6,400 in annual net dividends
- 2023: Targeting at least 216 hours GWT, $7,000 in annual net dividends
At the beginning of 2023 I expected overall GWT to decrease in 2023 due to higher calculated hourly rates, as I projected a 10% increase in the hourly rate due to inflation. I targeted $7,000 in annual net dividends with that conservative assumption.
Throughout the year, it quickly emerged that this initial target was way too conservative and I become more and more confident that I will pass $8,000. Towards the end of the year, there was even a slim chance to pass the next milestone of $9,000. Eventually, it turned out that 2023 dividend income reached a staggering $8,808 and thus came very close to that next milestone.
As a result, 2023 dividend income grew by a whopping 37% and I am very grateful for that.
Across the years, that Dividend Race has been as follows:
- 2018: Disappointing
- 2019: Phenomenal, benefiting from a low baseline in the prior year
- 2020: Fairly disappointing
- 2021: Phenomenal
- 2022: Much better than expected fueled by the very weak euro
- 2023: Targeted a very conservative low single-digit growth rate which was significantly outperformed with dividend growth reaching 37%
- 2024: For 2024 I haven't finalized my projections yet but the most likely outcome is a low double-digit growth rate. The growth rates from 2023 are clearly unsustainable unless I either see a big rise in my disposable income, yields go up significantly or I overweight BDCs even more in my portfolio. As it stands today, none of that is likely to occur in my view. In absolute terms I want to finally cross that $10,000 dividend income milestone in 2024.
YTD Dividend Growth (Designed by author)
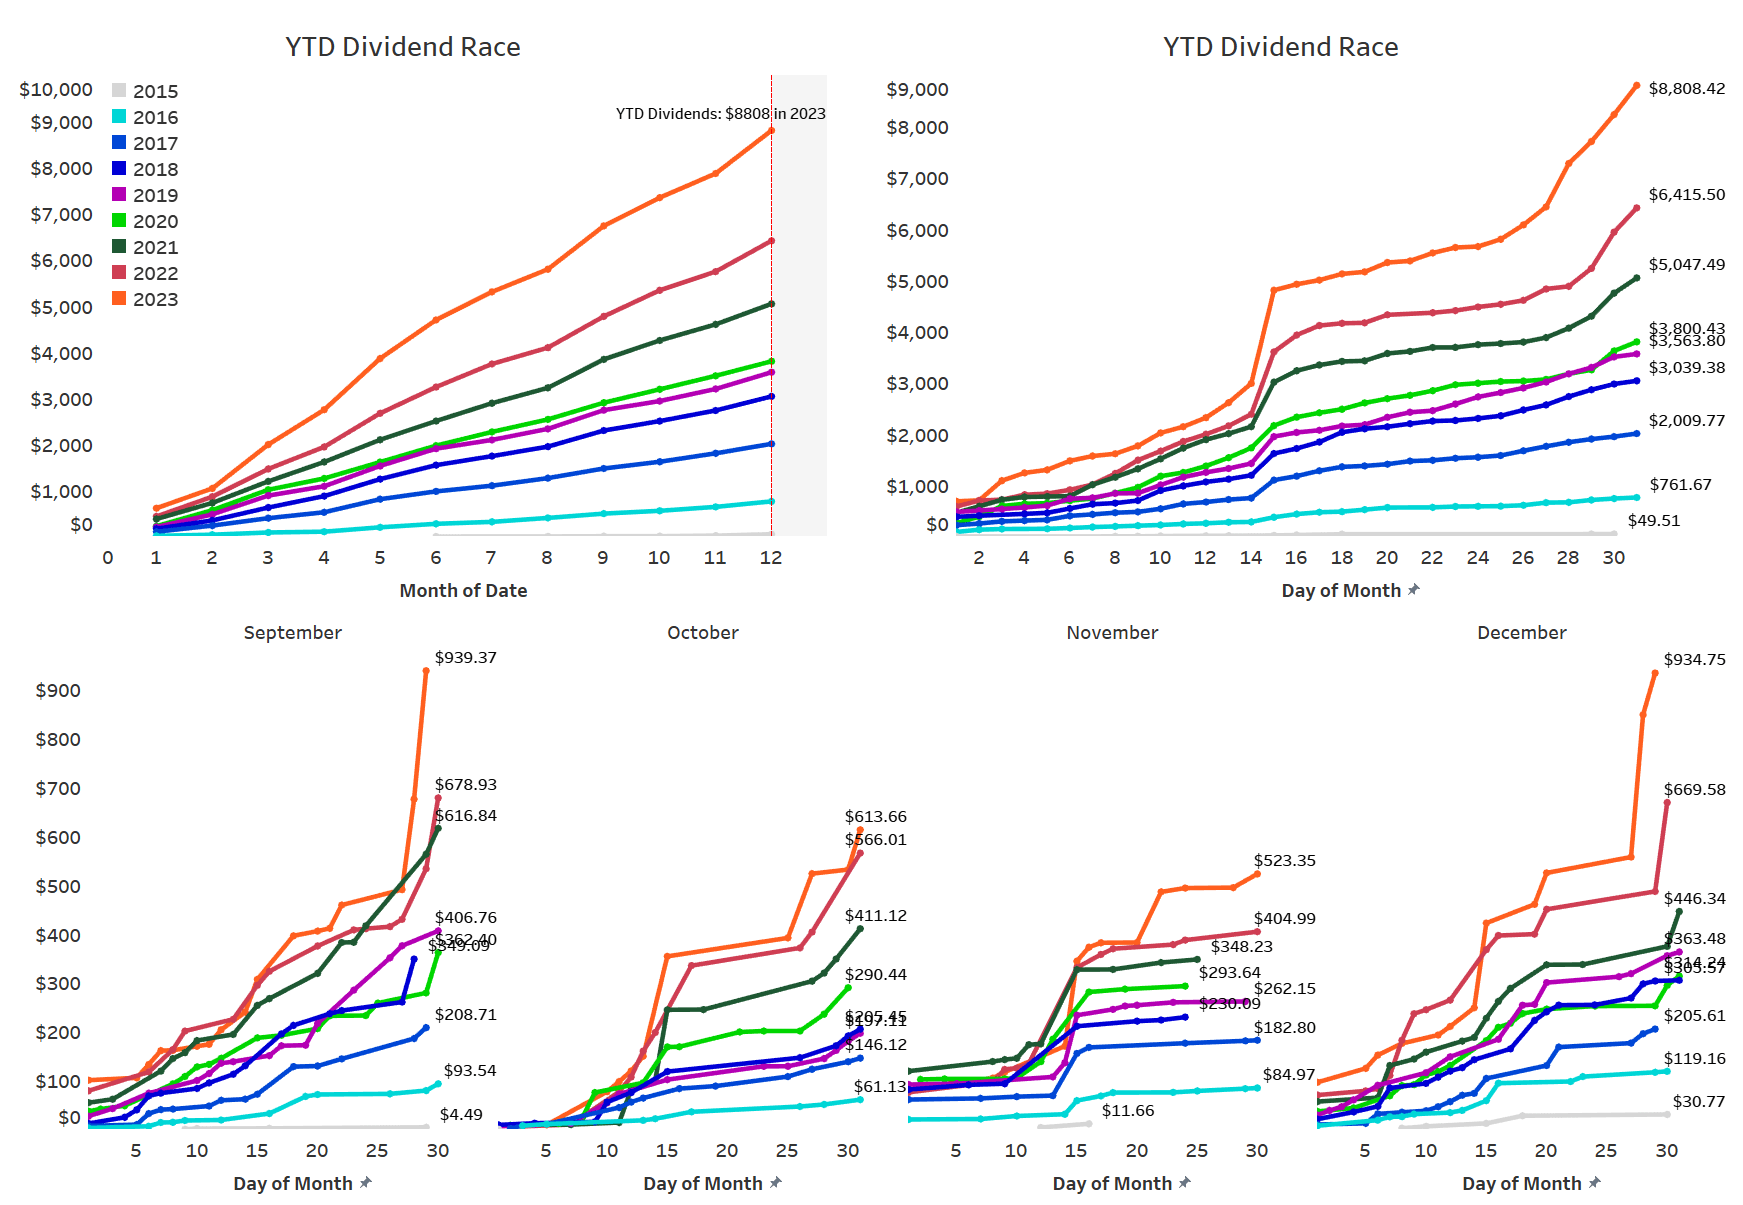
I have updated the YTD Dividend Race chart to show the development of YTD dividend income on a daily basis, allowing us to see that most of my dividend income is generated mid-month and towards the end of the month. The chart also breaks down the development by month for the current year, making it easy to identify significant jumps in income.
YTD Dividend Race (Designed by author)
Expressed in GWT, it presents itself as follows:
Gifted Working Time (Designed by author)
What this shows is as follows:
- All time (blue area) - Around 1,251 hours, or 156 days, of active work have been replaced with passive income since the start of my dividend journey. Assuming a five-day workweek, this translates into more than 31 weeks of vacation funded via dividends, which itself is equal to more than half a year in total.
- Full-year 2023 (green bars) - Around 315 hours, or 39.3 days, of active work have been replaced with passive income in 2023, which is basically equivalent to eight full-time working weeks funded with dividends, or to put differently, 2023 net dividends have provided me with around 2 extra monthly salaries in total. That is great progress and I can't wait to add another month to that statistic.
- Highlighted in pink is the accumulated total at the end of the current reporting month ( December ).
This visualization allows us to see the overall impact of my dividend income on the amount of active work I am able to replace with passive income. It also enables us to see the progress made year-to-date, as well as the accumulated total at the end of the current reporting month.
Upcoming January Dividends
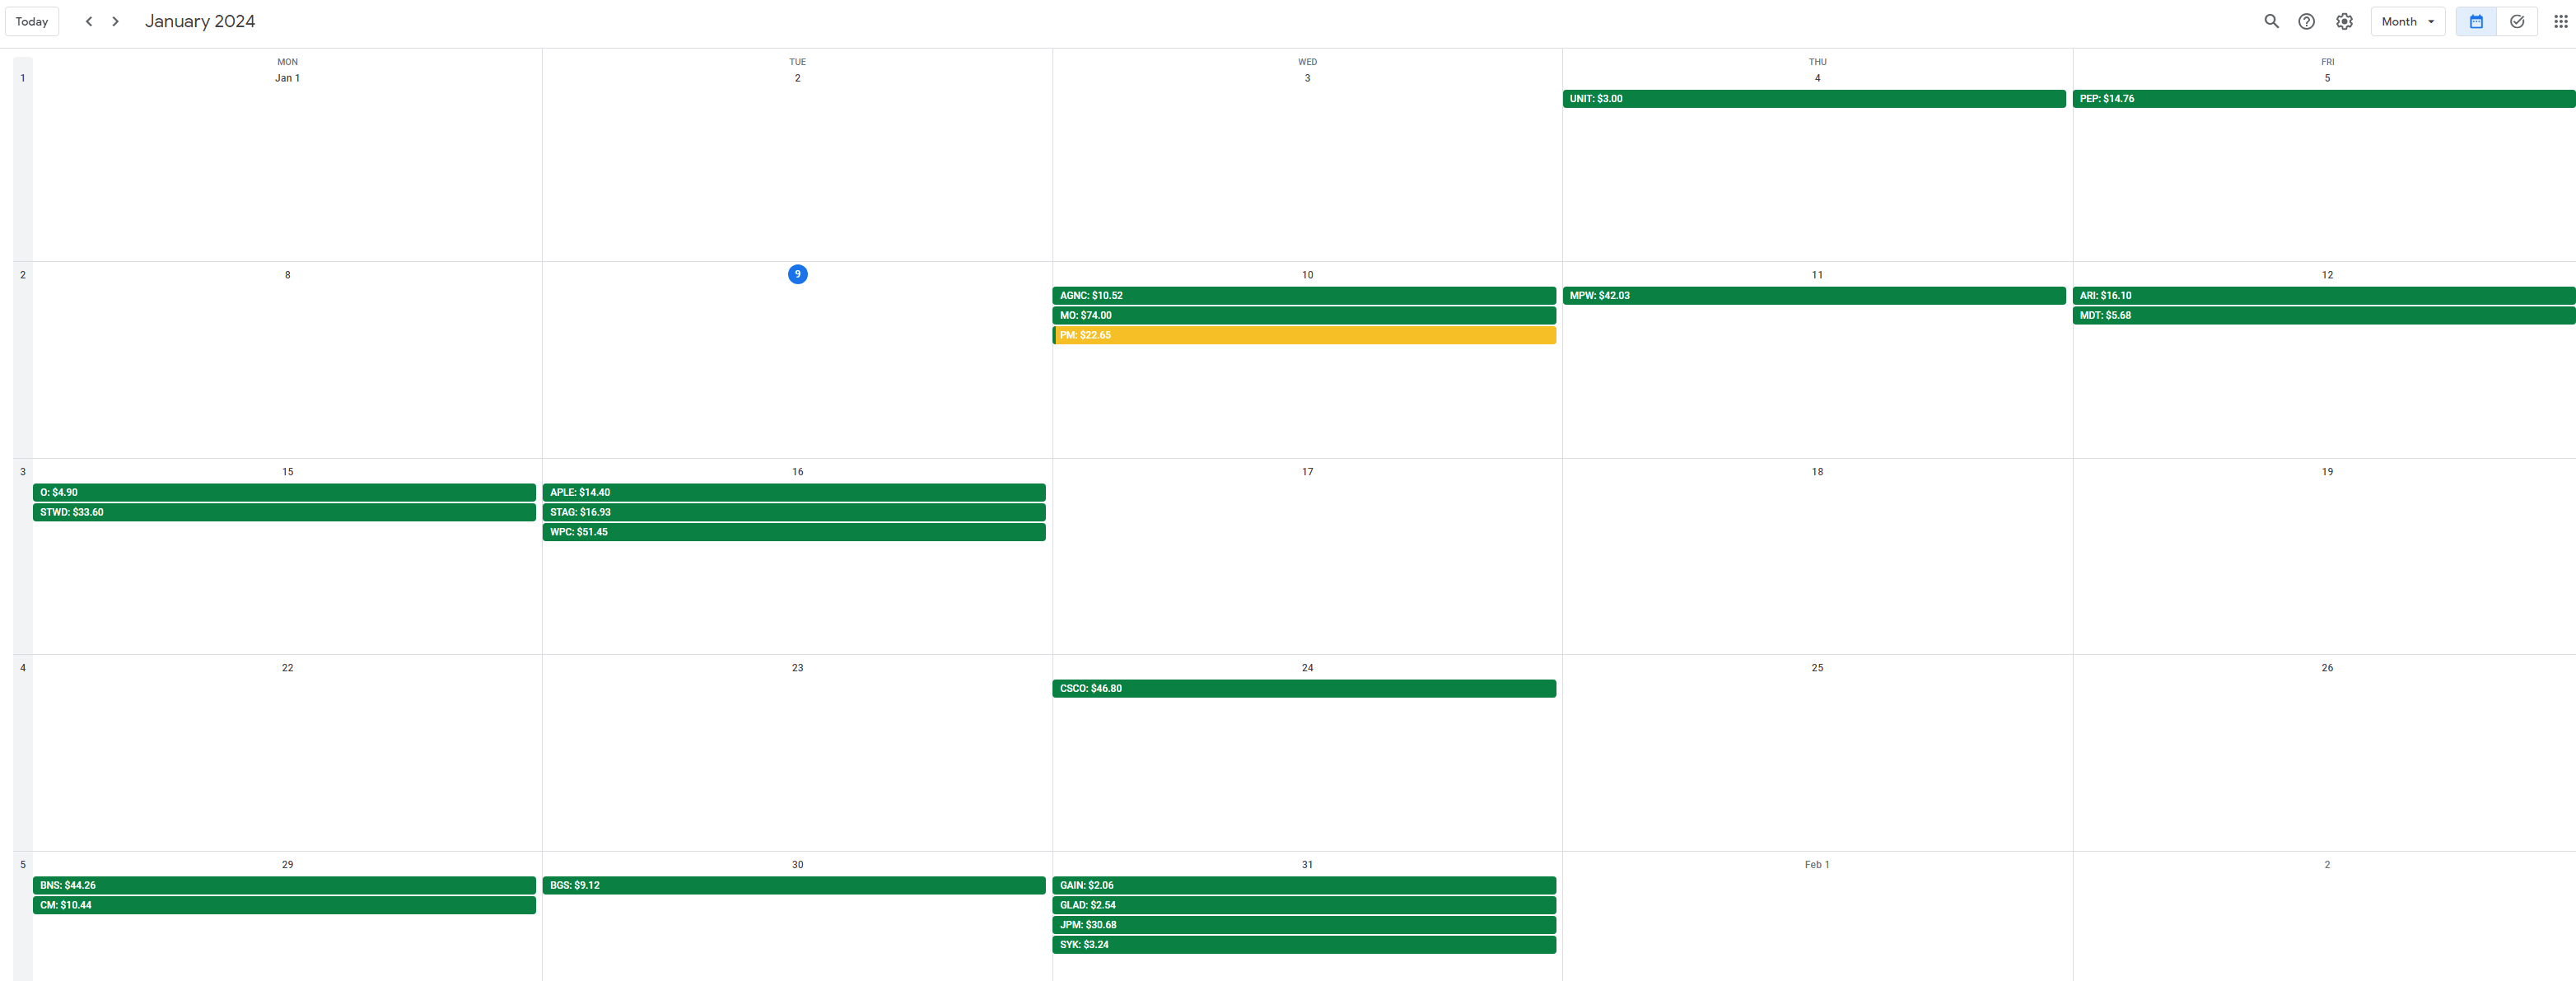
As every month, January is packed with dividend payments heavily concentrated around the 15th and at month-end when the dividend checks from Canada's big banks as well as JPMorgan will be arriving over a period of just 3-4 days.
Given the majority of my savings plans feature companies that pay dividends in January such as W. P. Carey (WPC), Altria ( MO ), Cisco Systems ( CSCO ), JPMorgan, Toronto-Dominion Bank, Bank of Nova Scotia, Stryker ( SYK ), Medtronic ( MDT ) as well as ongoing investments into stocks like Rithm Capital ( RITM ) and Annaly Capital ( NLY ), it surely is going to be a big month that should easily set a new all-time dividend record for the month of January.
The snapshot below is taken from my free-for-all released Dividend Calendar (make sure to follow instructions in the video) and shows my expected dividend payments in January.
My Dividend Calendar (Designed by author)
At the end of December, my dividend portfolio is composed as follows:
| Company Name |
| Ticker |
| % Market Value |
| Market Value (€) |
| Apple Inc. |
| ( AAPL ) |
| 11.18% |
| 25,098 |
| Visa Inc |
| ( V ) |
| 4.27% |
| 9,592 |
| Microsoft Corporation |
| ( MSFT ) |
| 3.96% |
| 8,893 |
| AbbVie Inc |
| ( ABBV ) |
| 3.68% |
| 8,264 |
| McDonald's Corp |
| ( MCD ) |
| 3.57% |
| 8,018 |
| Ares Capital Corporation |
| ( ARCC ) |
| 3.43% |
| 7,692 |
| NVIDIA Corporation |
| ( NVDA ) |
| 3.04% |
| 6,834 |
| Cisco Systems, Inc. |
| ( CSCO ) |
| 2.49% |
| 5,587 |
| Main Street Capital Corporation |
| ( MAIN ) |
| 2.35% |
| 5,277 |
| STAG Industrial Inc |
| ( STAG ) |
| 2.28% |
| 5,124 |
| W.P. Carey |
| ( WPC ) |
| 2.18% |
| 4,900 |
| Commonwealth Bank of Australia |
| ( CBAUF ) |
| 2.18% |
| 4,890 |
| JPMorgan Chase & Co. |
| ( JPM ) |
| 2.10% |
| 4,719 |
| Johnson & Johnson |
| ( JNJ ) |
| 2.08% |
| 4,671 |
| Shell |
| ( SHEL ) |
| 2.08% |
| 4,661 |
| AT&T Inc. |
| ( T ) |
| 1.98% |
| 4,447 |
| Home Depot |
| ( HD ) |
| 1.89% |
| 4,252 |
| Broadcom Inc |
| ( AVGO ) |
| 1.86% |
| 4,168 |
| Allianz SE |
| ( ALIZF ) |
| 1.75% |
| 3,932 |
| Texas Instruments Incorporated |
| ( TXN ) |
| 1.70% |
| 3,828 |
| Hercules Capital |
| ( HTGC ) |
| 1.65% |
| 3,698 |
| Gilead Sciences, Inc. |
| ( GILD ) |
| 1.54% |
| 3,455 |
| Wells Fargo & Co |
| ( WFC ) |
| 1.54% |
| 3,454 |
| Southern Co |
| ( SO ) |
| 1.49% |
| 3,348 |
| Toronto-Dominion Bank |
| ( TD ) |
| 1.45% |
| 3,257 |
| Intel Corporation |
| ( INTC ) |
| 1.43% |
| 3,221 |
| Blackstone Group LP |
| ( BX ) |
| 1.42% |
| 3,182 |
| New Residential Corporation |
| ( RITM ) |
| 1.40% |
| 3,152 |
| Altria Group Inc |
| ( MO ) |
| 1.37% |
| 3,076 |
| Bank of Nova Scotia |
| ( BNS ) |
| 1.24% |
| 2,784 |
| Enbridge |
| ( ENB ) |
| 1.13% |
| 2,545 |
| Apollo Investment |
| ( MFIC ) |
| 1.12% |
| 2,504 |
| Siemens Healthineers |
| ( SEMHF ) |
| 1.07% |
| 2,400 |
| BMW |
| ( BMWYY ) |
| 0.91% |
| 2,040 |
| Morgan Stanley |
| ( MS ) |
| 0.87% |
| 1,949 |
| PepsiCo, Inc. |
| ( PEP ) |
| 0.82% |
| 1,849 |
| BP2 |
| ( BP ) |
| 0.82% |
| 1,836 |
| Procter & Gamble Co |
| ( PG ) |
| 0.78% |
| 1,757 |
| BP1 |
| ( BP ) |
| 0.69% |
| 1,555 |
| Philip Morris International Inc. |
| ( PM ) |
| 0.68% |
| 1,523 |
| Honeywell International Inc. |
| ( HON ) |
| 0.67% |
| 1,511 |
| Realty Income Corp |
| ( O ) |
| 0.67% |
| 1,511 |
| Starwood Property Trust, Inc. |
| ( STWD ) |
| 0.67% |
| 1,494 |
| Daimler |
| ( MBGAF ) |
| 0.65% |
| 1,450 |
| Bank of America Corp |
| ( BAC ) |
| 0.62% |
| 1,384 |
| Brookfield Renewable Partners |
| ( BEP ) |
| 0.52% |
| 1,174 |
| Stryker |
| ( SYK ) |
| 0.50% |
| 1,128 |
| Gladstone Investment |
| ( GAIN ) |
| 0.50% |
| 1,125 |
| The Coca-Cola Co |
| ( KO ) |
| 0.48% |
| 1,088 |
| Gladstone Commercial Corporation |
| ( GOOD ) |
| 0.48% |
| 1,073 |
| Gladstone Capital |
| ( GLAD ) |
| 0.47% |
| 1,046 |
| Target Corporation |
| ( TGT ) |
| 0.46% |
| 1,030 |
| CVS Health Corp |
| ( CVS ) |
| 0.45% |
| 1,014 |
| 3M Co |
| ( MMM ) |
| 0.44% |
| 994 |
| Unilever NV ADR |
| ( UL ) |
| 0.44% |
| 984 |
| Apple Hospitality REIT |
| ( APLE ) |
| 0.42% |
| 932 |
| Royal Bank of Canada |
| ( RY ) |
| 0.41% |
| 916 |
| Annaly Capital Management |
| ( NLY ) |
| 0.38% |
| 851 |
| NextEra Energy Partners LP |
| ( NEP ) |
| 0.38% |
| 846 |
| Medical Properties Trust |
| ( MPW ) |
| 0.37% |
| 830 |
| AGNC Investment Corporation |
| ( AGNC ) |
| 0.37% |
| 825 |
| Verizon Communications Inc. |
| ( VZ ) |
| 0.35% |
| 780 |
| Spirit Realty Corporation |
| ( SRC ) |
| 0.34% |
| 763 |
| Medtronic |
| ( MDT ) |
| 0.33% |
| 735 |
| Canadian Imperial Bank of Commerce |
| ( CM ) |
| 0.31% |
| 696 |
| Dominion Energy Inc |
| ( D ) |
| 0.30% |
| 664 |
| Sino AG |
| 0.29% |
| 641 |
| Antero Midstream Corporation |
| ( AM ) |
| 0.28% |
| 636 |
| BASF |
| ( BASFY ) |
| 0.27% |
| 616 |
| Apollo Commercial Real Est. Finance Inc |
| ( ARI ) |
| 0.27% |
| 601 |
| NextEra Energy |
| ( NEE ) |
| 0.26% |
| 586 |
| Exxon Mobil Corporation |
| ( XOM ) |
| 0.25% |
| 557 |
| Vonovia |
| ( VONOY ) |
| 0.25% |
| 552 |
| Kinder Morgan Inc |
| ( KMI ) |
| 0.22% |
| 496 |
| B&G Foods, Inc. |
| ( BGS ) |
| 0.22% |
| 483 |
| Walgreens Boots Alliance Inc |
| ( WBA ) |
| 0.20% |
| 446 |
| Mastercard |
| ( MA ) |
| 0.18% |
| 406 |
| Pfizer Inc. |
| ( PFE ) |
| 0.17% |
| 383 |
| Colgate-Palmolive Company |
| ( CL ) |
| 0.16% |
| 368 |
| Sixt |
| ( SXTSY ) |
| 0.16% |
| 354 |
| Alibaba Group Holding Ltd |
| ( BABA ) |
| 0.16% |
| 349 |
| Omega Healthcare Investors Inc |
| ( OHI ) |
| 0.15% |
| 337 |
| ZIM Integrated Shipping Services |
| ( ZIM ) |
| 0.15% |
| 331 |
| BRT Apartments Corp. |
| ( BRT ) |
| 0.13% |
| 294 |
| Blue Owl Capital Corporation |
| ( OBDC ) |
| 0.13% |
| 286 |
| Bayer AG |
| ( BAYZF ) |
| 0.11% |
| 252 |
| Blue Owl Capital |
| ( OWL ) |
| 0.09% |
| 201 |
| Boeing |
| ( BA ) |
| 0.07% |
| 166 |
| Fresenius SE |
| ( FSNUF ) |
| 0.06% |
| 145 |
| Diversified Healthcare Trust |
| ( DHC ) |
| 0.06% |
| 140 |
| Equitrans Midstream Coporation |
| ( ETRN ) |
| 0.06% |
| 131 |
| Uniti Group Inc |
| ( UNIT ) |
| 0.05% |
| 107 |
| Bank of Montreal |
| ( BMO ) |
| 0.04% |
| 89 |
| Walt Disney Co |
| ( DIS ) |
| 0.04% |
| 84 |
| The GEO Group Inc |
| (GEO) |
| 0.03% |
| 70 |
| Fresenius Medical Care |
| (FMS) |
| 0.03% |
| 64 |
| Newtek Business Services |
| (NEWT) |
| 0.03% |
| 62 |
| Service Properties Trust |
| (SVC) |
| 0.02% |
| 39 |
For further details see:
My Dividend Stock Portfolio: New December Dividend Record - 98 Holdings With 18 Buys