SYK - My Dividend Stock Portfolio: New January Record - 100 Holdings With 26 Buys
Summary
- Inflation and (expected) actions by the Federal Reserve continue to dominate market movements.
- Markets have started the new year with very solid gains following expectations about a more dovish Federal Reserve and a solid earnings season.
- My dividend income amounted to a new January record of $613, which is up 41% Y/Y and up 8% sequentially.
- Gifted Working Time in 2023: Around 22 hours or 2.7 days of active work have been replaced with passive income in 2023 already.
Portfolio Changes in January
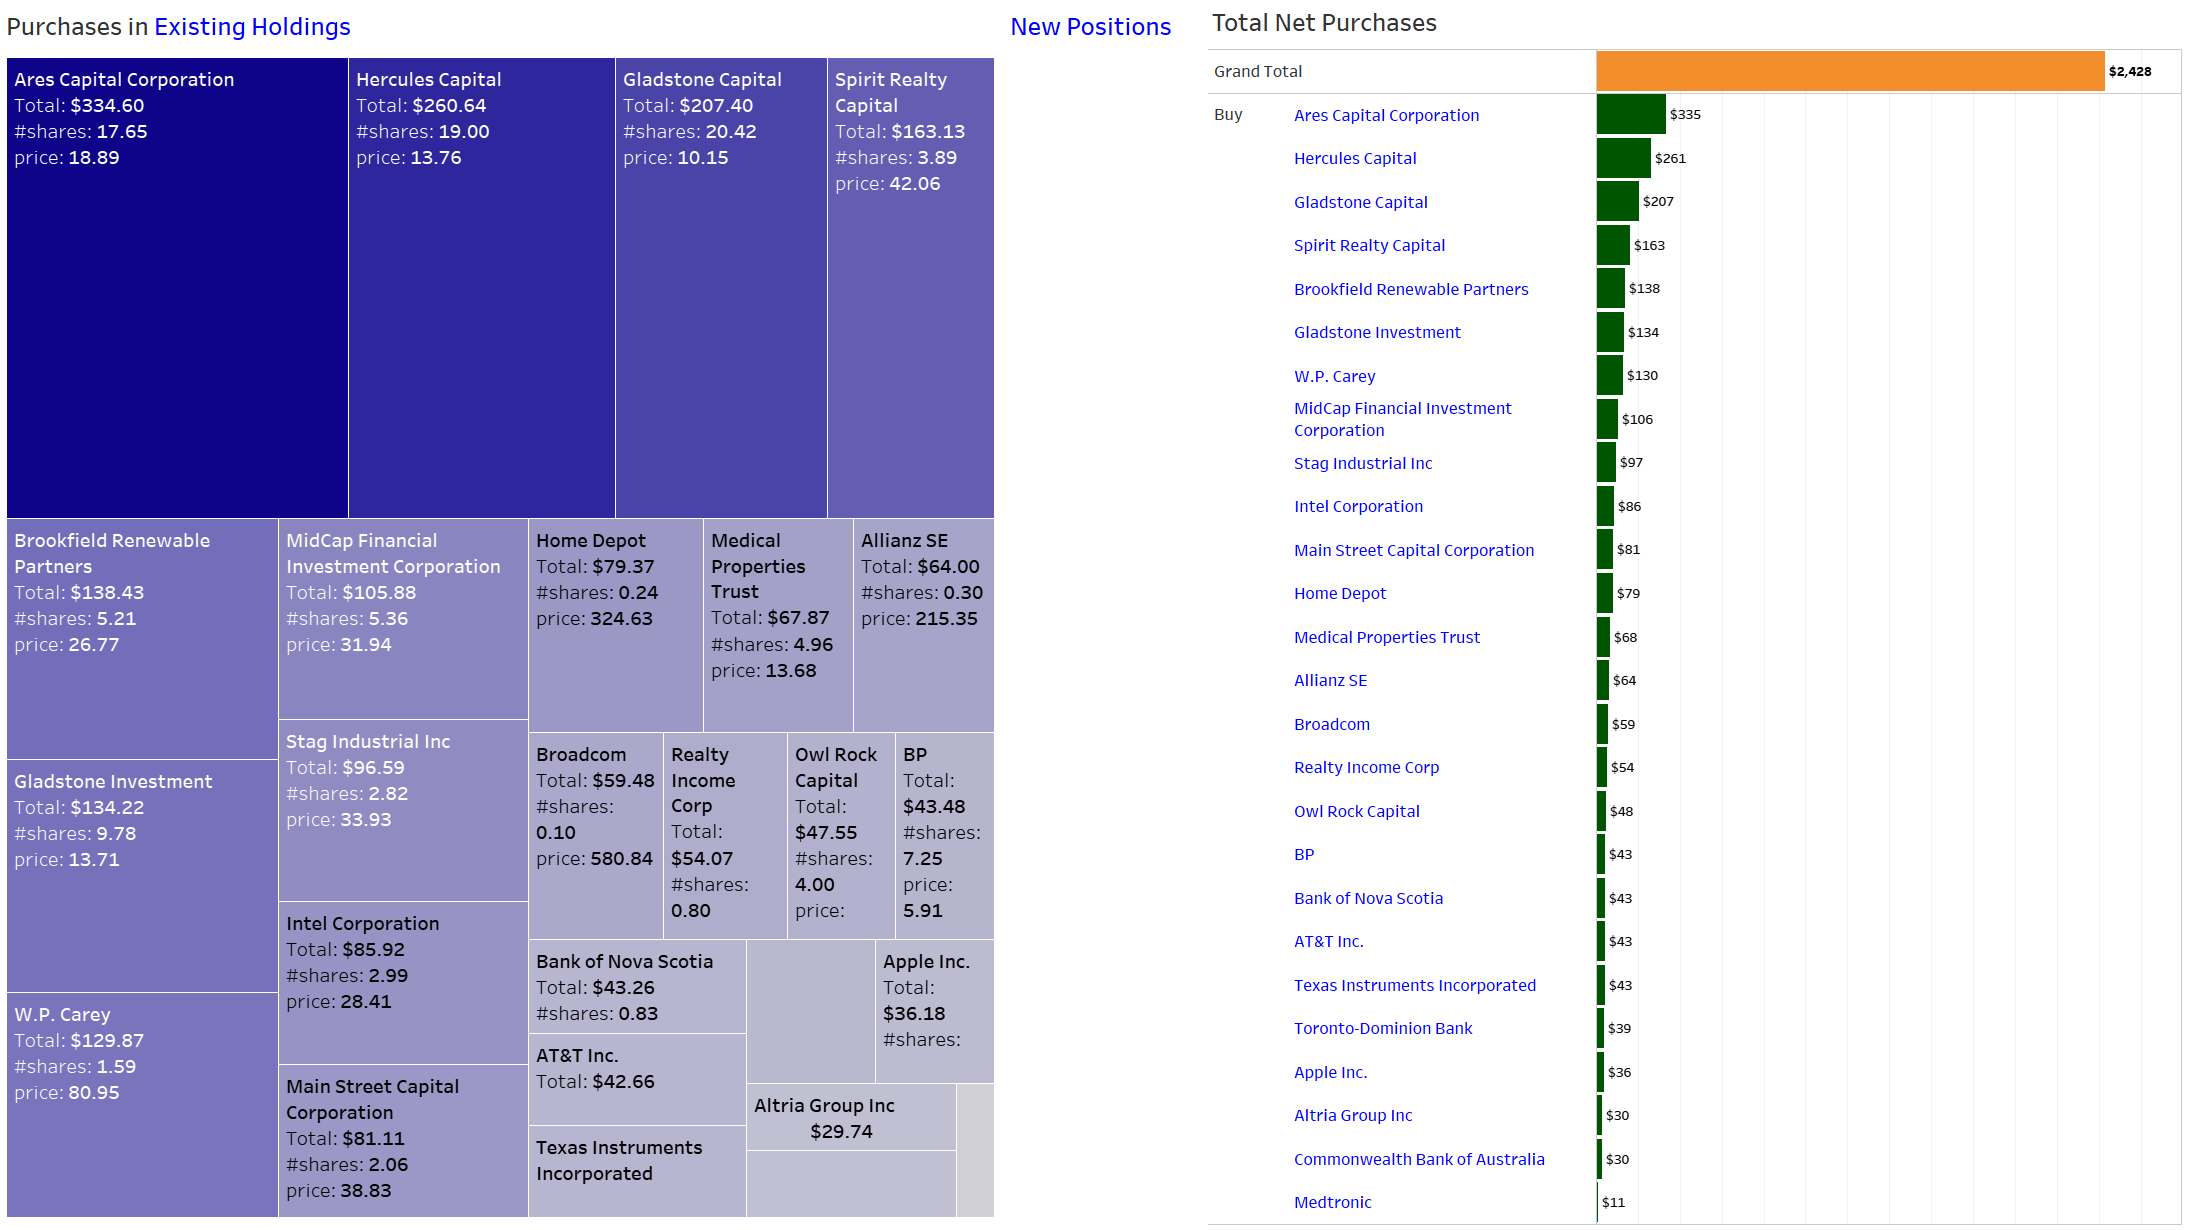
Investment activity in 2023 started very strongly with net investments coming in at $2,400 as I redeployed remaining proceeds from my sales in December 2022 when I was forced to close positions in Energy Transfer ( ET ), Enterprise Product Partners ( EPD ) and MPLX ( MPLX ). That's a real shame as I would love to own all these positions but regulation is something I cannot influence at all.
I have deployed the remaining proceeds and put them in BDCs and REITs such as Hercules Capital ( HTGC ), Ares Capital Corporation ( ARCC ), Gladstone Capital ( GLAD ), Gladstone Investment ( GAIN ) and Spirit Realty Capital ( SRC ).
I have been accumulating my stake in Brookfield Renewable Partners ( BEP ) as the stock reached an attractive price ahead of earnings. The earnings results were positive and the expected dividend hike was confirmed, however the stock declined slightly after earnings. I plan to further increase my position in February.
I am also contemplating if I should significantly reduce my position in Medical Properties Trust ( MPW ) amid recently raised allegations and an even less conducive interest rate environment for a REIT with a somewhat concerning level of debt and other challenges such as distressed tenants. On top of that, contrary to prior years, MPW is only scheduled to release earnings in the 4th week of February as opposed to the 1st week of February. There can be many reasons for that but based on my own personal risk assessment I cannot really imagine better than expected news to be released. The reason is that I would have anticipated an accompanying commentary in the press release announcing the earnings date as to why it occurs in the last week of February. Admittedly, it also could mean nothing and I am trying to read too much between the lines.
Apart from that all other purchases were triggered by the almost weekly savings plans.
Due to the nature of how the monthly investment plan process works, I am investing relatively equally into these stocks at two points of time during the month - at the beginning of the month and mid-month - which breaks down as shown below. Figures are in Euro and show that, for instance, at the beginning of the month, I am investing between 50 and 75 EUR each into Microsoft ( MSFT ), The Home Depot (NYSE: HD ), Visa (NYSE: V ), W. P. Carey ( WPC ), and BP (NYSE: BP ). Mid-month, I am adding between 33 and 40 EUR each into STAG Industrial (NYSE: STAG ), AT&T ( T ), NextEra Energy (NYSE: NEE ), Toronto-Dominion Bank (NYSE: TD ), Main Street Capital (NYSE: MAIN ) and JPMorgan (NYSE: JPM ).
I have added several investment plans starting mid-September 2020 which include AGNC Investment Corp. (NASDAQ: AGNC ), Ares Capital (NASDAQ: ARCC ), Medical Properties Trust (NYSE: MPW ), The Bank of Nova Scotia (NYSE: BNS ) and The Trade Desk (NASDAQ: TTD ). Investments here will be focused on high-yield as well as high-growth stocks in the technology, therapeutic and renewables sectors.
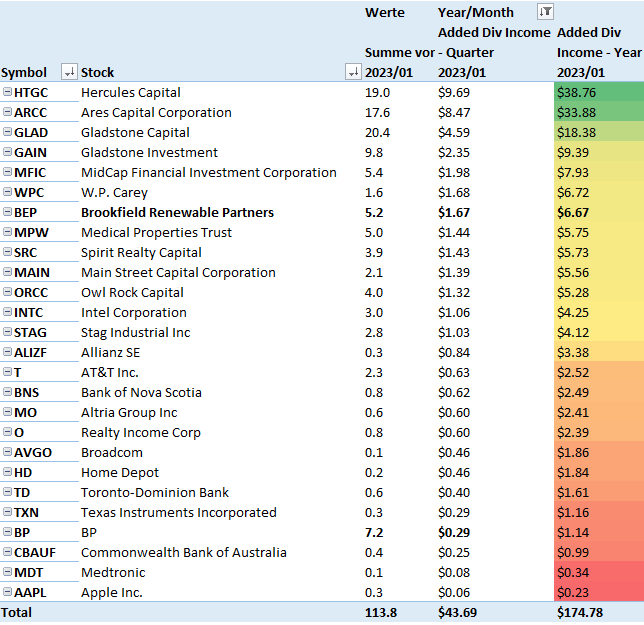
All those purchases substantially raised my forward annual dividend income, breaking down as follows:
Added Dividend Income (Designed by author)
All net purchases in January can be found below:
Net Purchases (Designed by author)
Dividend Income: What Happened on the Dividend Side?
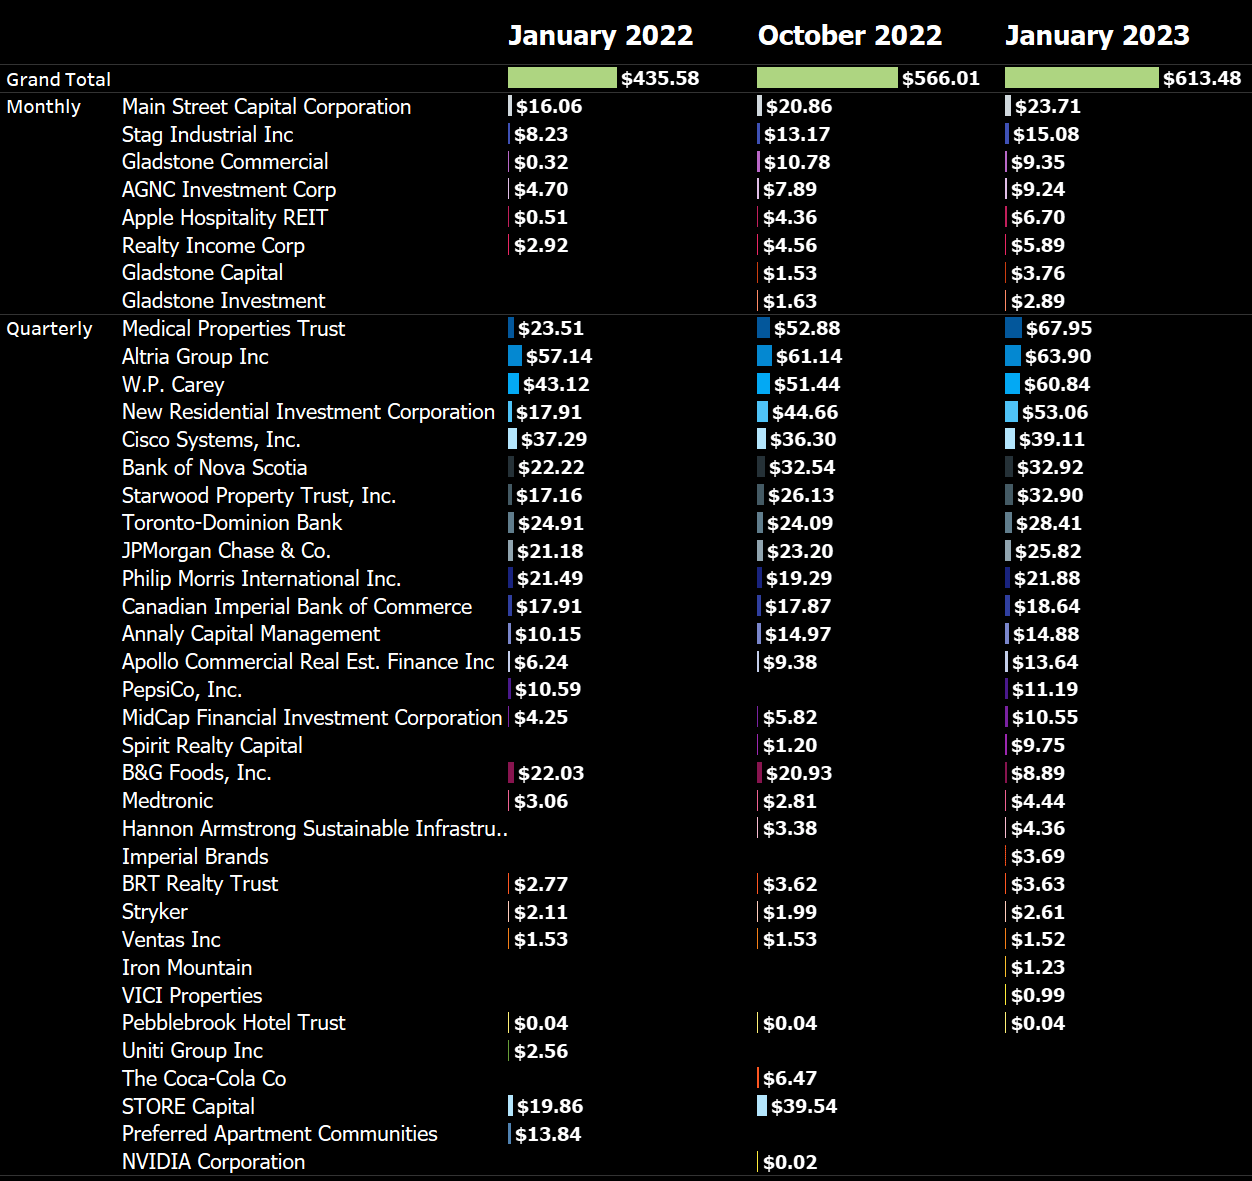
Dividend income hit a new January record of $613 and is up an explosive 41% annually and up 8% sequentially. I have added a breakdown into monthly and quarterly dividend payers as my near-term goal is to bring the monthly dividend payers to a baseline of at least $100 as quickly as I reasonably can do that.
The main income drivers are 4 of the 5 dividend stocks (Ares Capital Corporation is the 5th one) that I am buying at least once every month: STAG Industrial ( STAG ), Medical Properties Trust, Rithm ( RITM ) and W. P. Carey ( WPC) .
The near-term goal for each of these positions is to reach at least $100 in quarterly dividend income with further big increases expected thereafter. I have no hesitation in buying them for the long-term even though I understand that rising rates and relatively high leverage for MPW and RITM and not everyone's taste. That said in the case of MPW I will have to reevaluate that assessment thoroughly following the upcoming earnings call. I am hoping for an understandable dividend cut which would likely allow me to buy back into the stock at better prices and at the same time put the REIT in a financially healthier situation.
January 2023 Dividend Income (Designed by author)
That said I already have four dividend payers with at least $50 in net dividends in January which I am really excited about.
The focus on these stocks also shows when looking at the Top 4 Dividend Payers in January featuring MPW, WPC and RITM and one of them will soon take Altria's top spot.
Top 4 Dividend Payers (Designed by author)
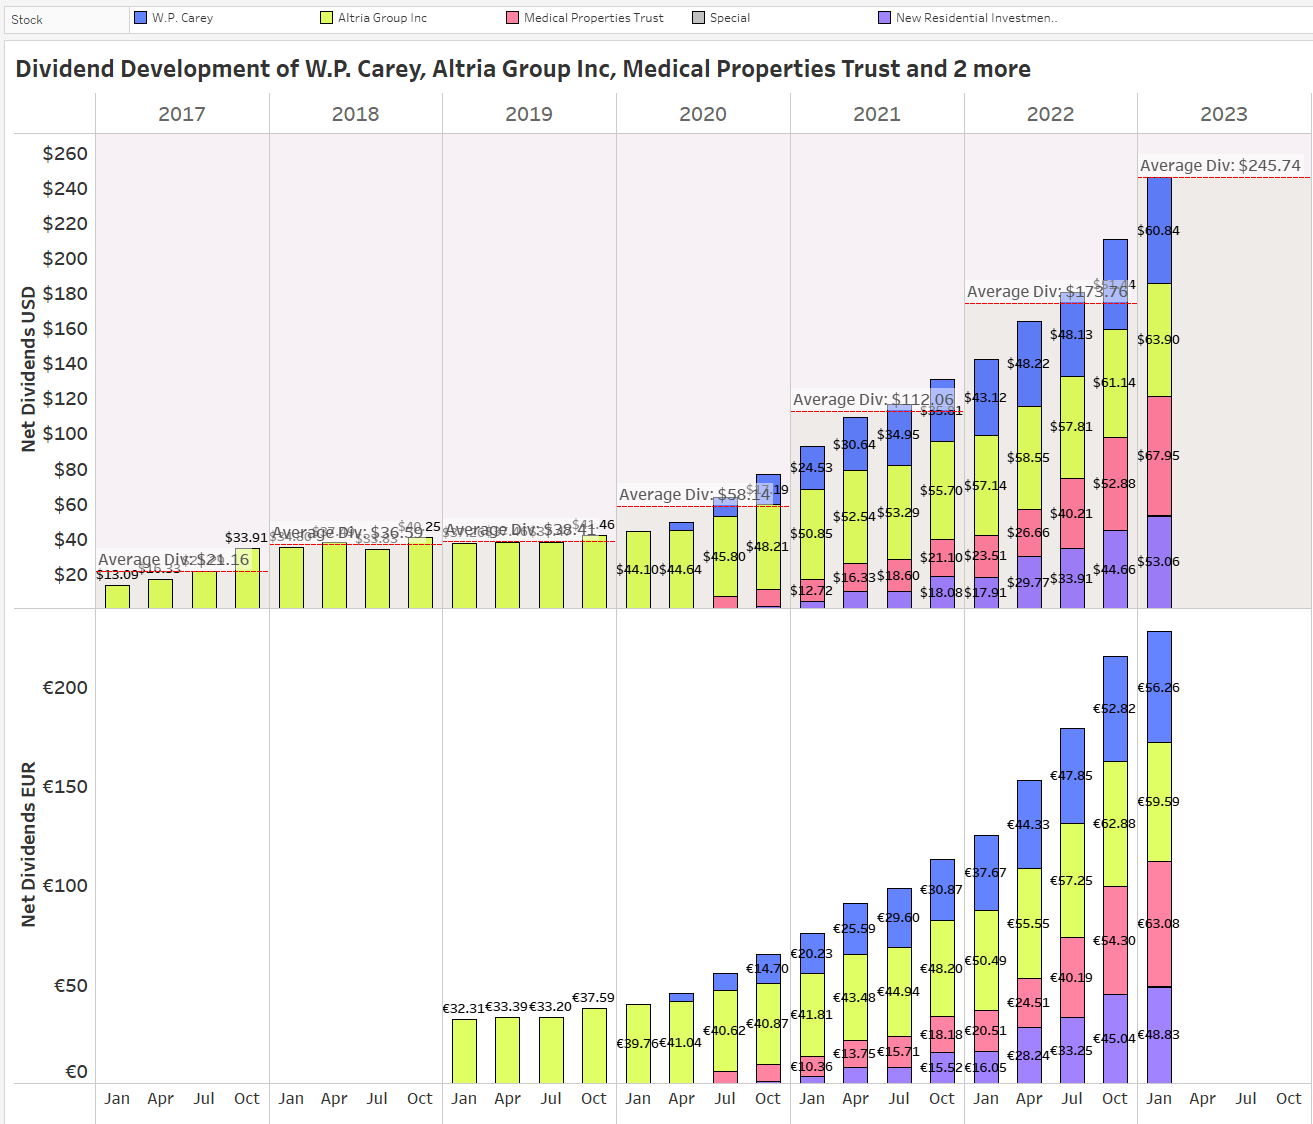
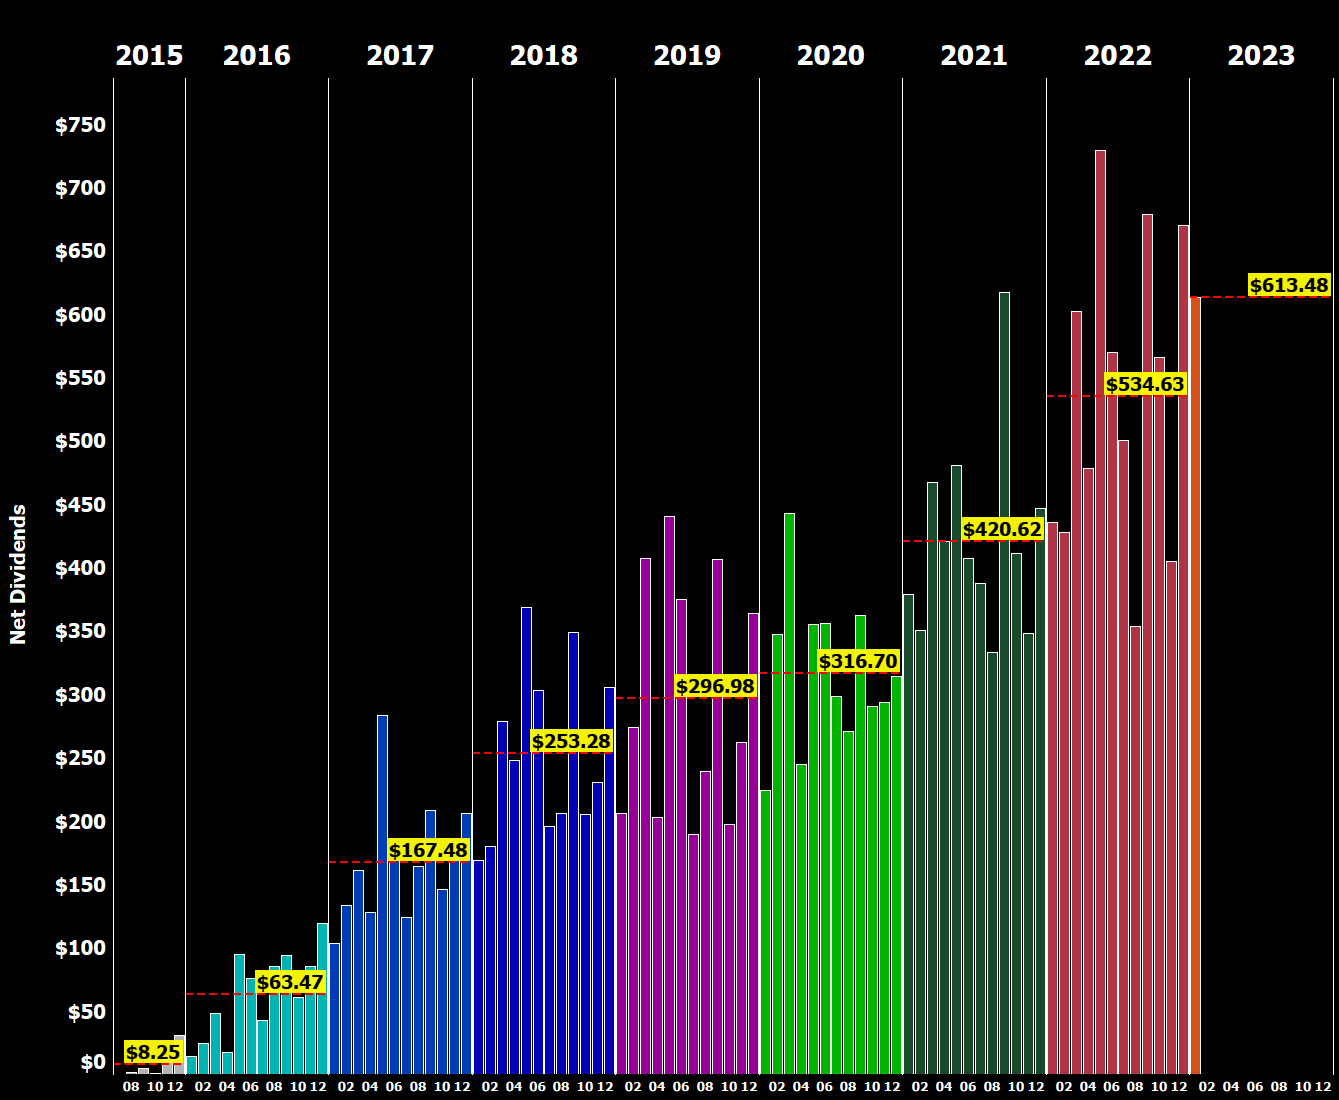
Here is a chart that shows the development of my net dividend income by month over time between 2015 and 2023. You can see the growth of my dividend income and the average annual dividend for each year:
All-time Dividend Development (Designed by author)
This chart is my favorite because it illustrates the progression of my dividend income over time and allows me to easily see the average annual dividend for each year.
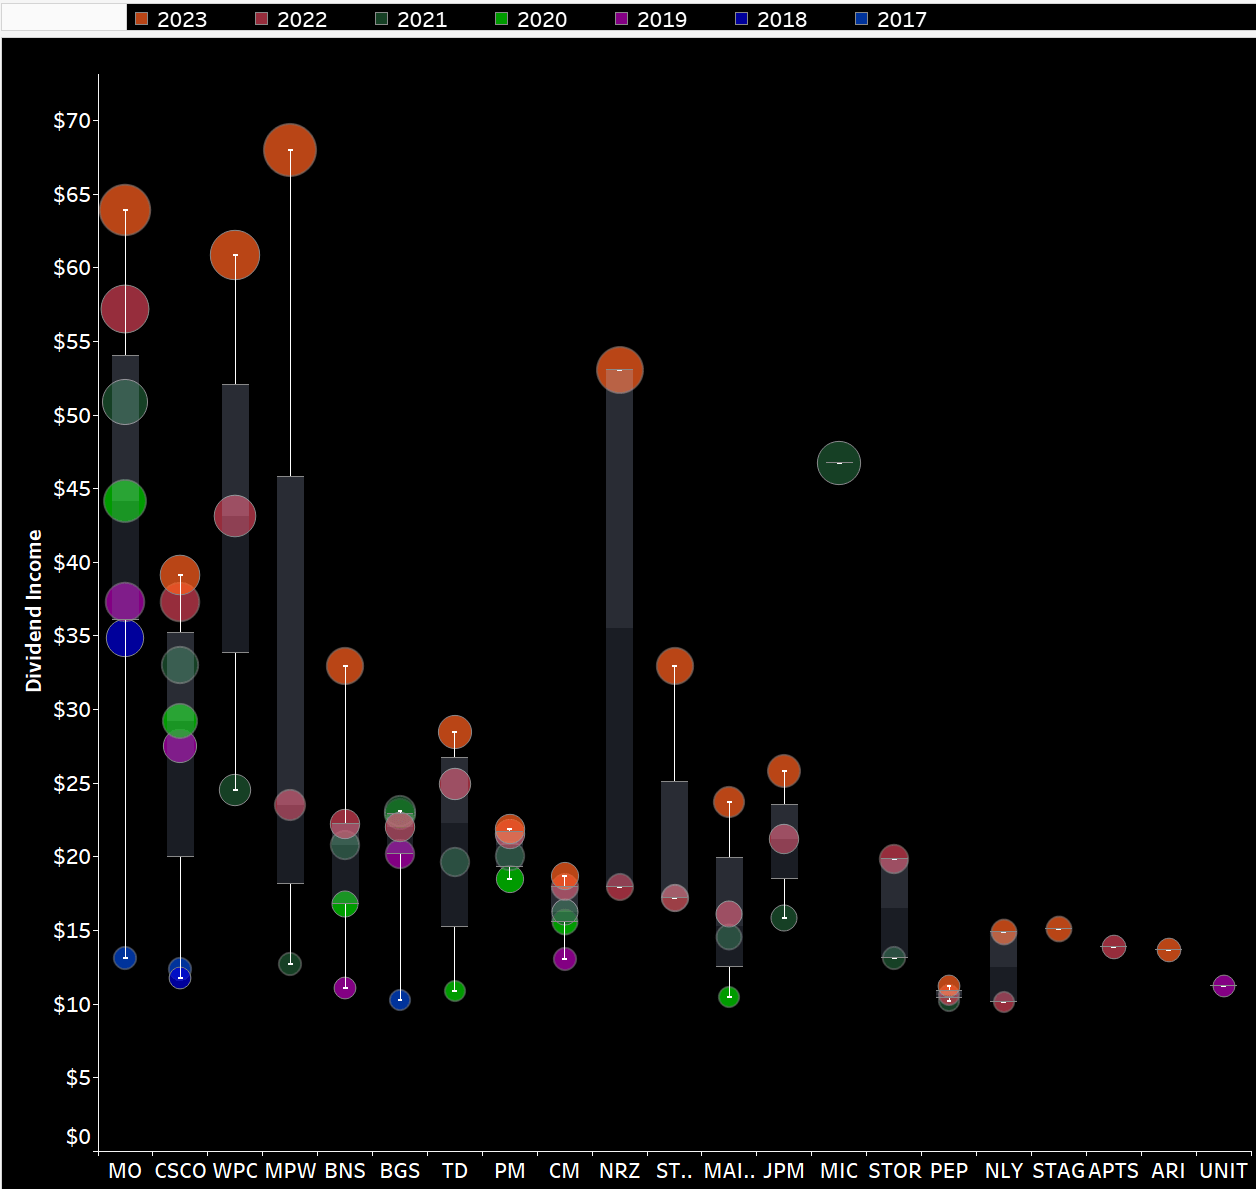
Next, I have plotted all of the individual dividend payments I have received, coloring them by year and arranging the years side by side instead of horizontally as in previous updates. This visualization allows for a more comprehensive analysis of the distribution of my dividend payments over time.
Dividend Payment Bubbles (Designed by author)
By plotting the data in this way, we can easily see the distribution of dividend payments across different years and gain insights into the overall growth of my dividend income over time.
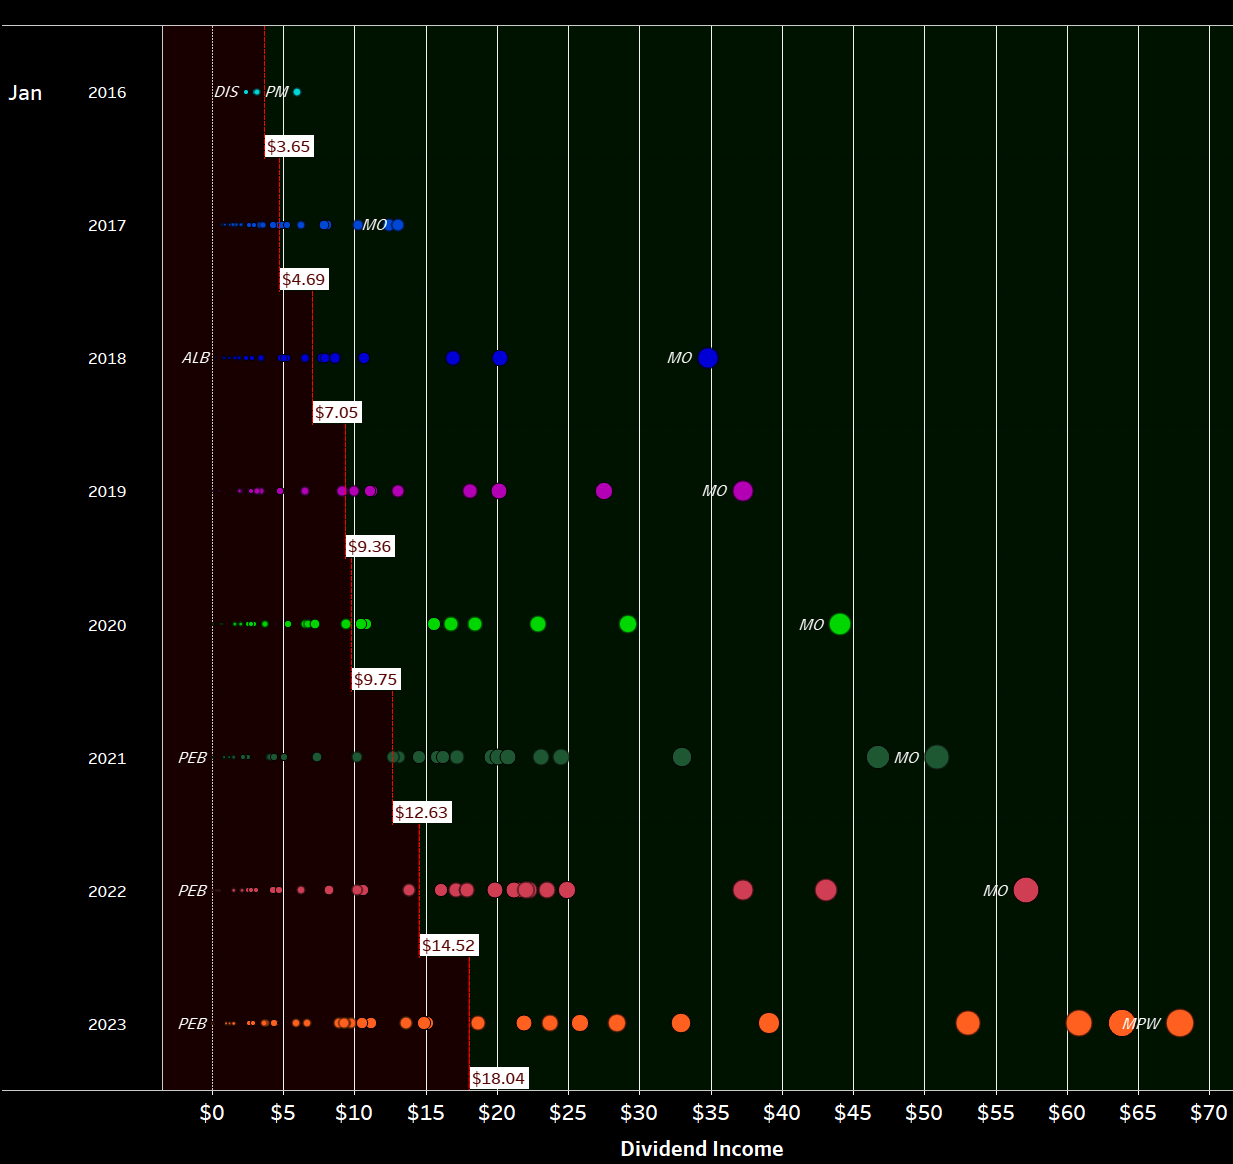
This visualization is initially quite cluttered, but it contains a wealth of information. It shows every individual dividend payment I have received since I began my investment journey in 2015, represented as a circle that is colored and sized according to its contribution. The view is organized by month and year, allowing for a more comprehensive analysis of the development of my dividend income over time. For each year and month, a white rectangle indicates the average monthly dividend. The area where dividends fall below the average is filled in dark red, while the area above the average is colored dark green. I greatly prefer this redesigned version of my old "bubbles chart" because it makes it much easier to identify trends and developments in my dividend income. This type of data visualization allows for a detailed examination of the distribution of my dividend payments over time and enables me to more easily identify trends and patterns in my income growth.
January 2023 Dividends (Designed by author)
Now, zooming in on January , we can immediately see a number of big green circles in a sea of black. The bigger the circle and the bigger the distance to the previous circle for the same stock, the bigger is the change in dividend income compared to the prior years.
The biggest observations are the huge distances between the respective data points for 2023, 2022, 2021 and 2020 for WPC, RITM, MPW and STOR which is a testament to the very aggressive and consistent monthly purchasing of these stocks ever since the outbreak of the pandemic. All four of them are slowly getting towards (with the exception that STOR will be discontinued soon) that illustrious $100 net dividend milestone. Overall, what I like to see in that chart is obviously big red circles at the top of the scale for as many stocks as possible as that means rising dividend income
Overall, I aim to see as many big neon orange circles at the top of the scale as possible, as this indicates rising dividend income. .
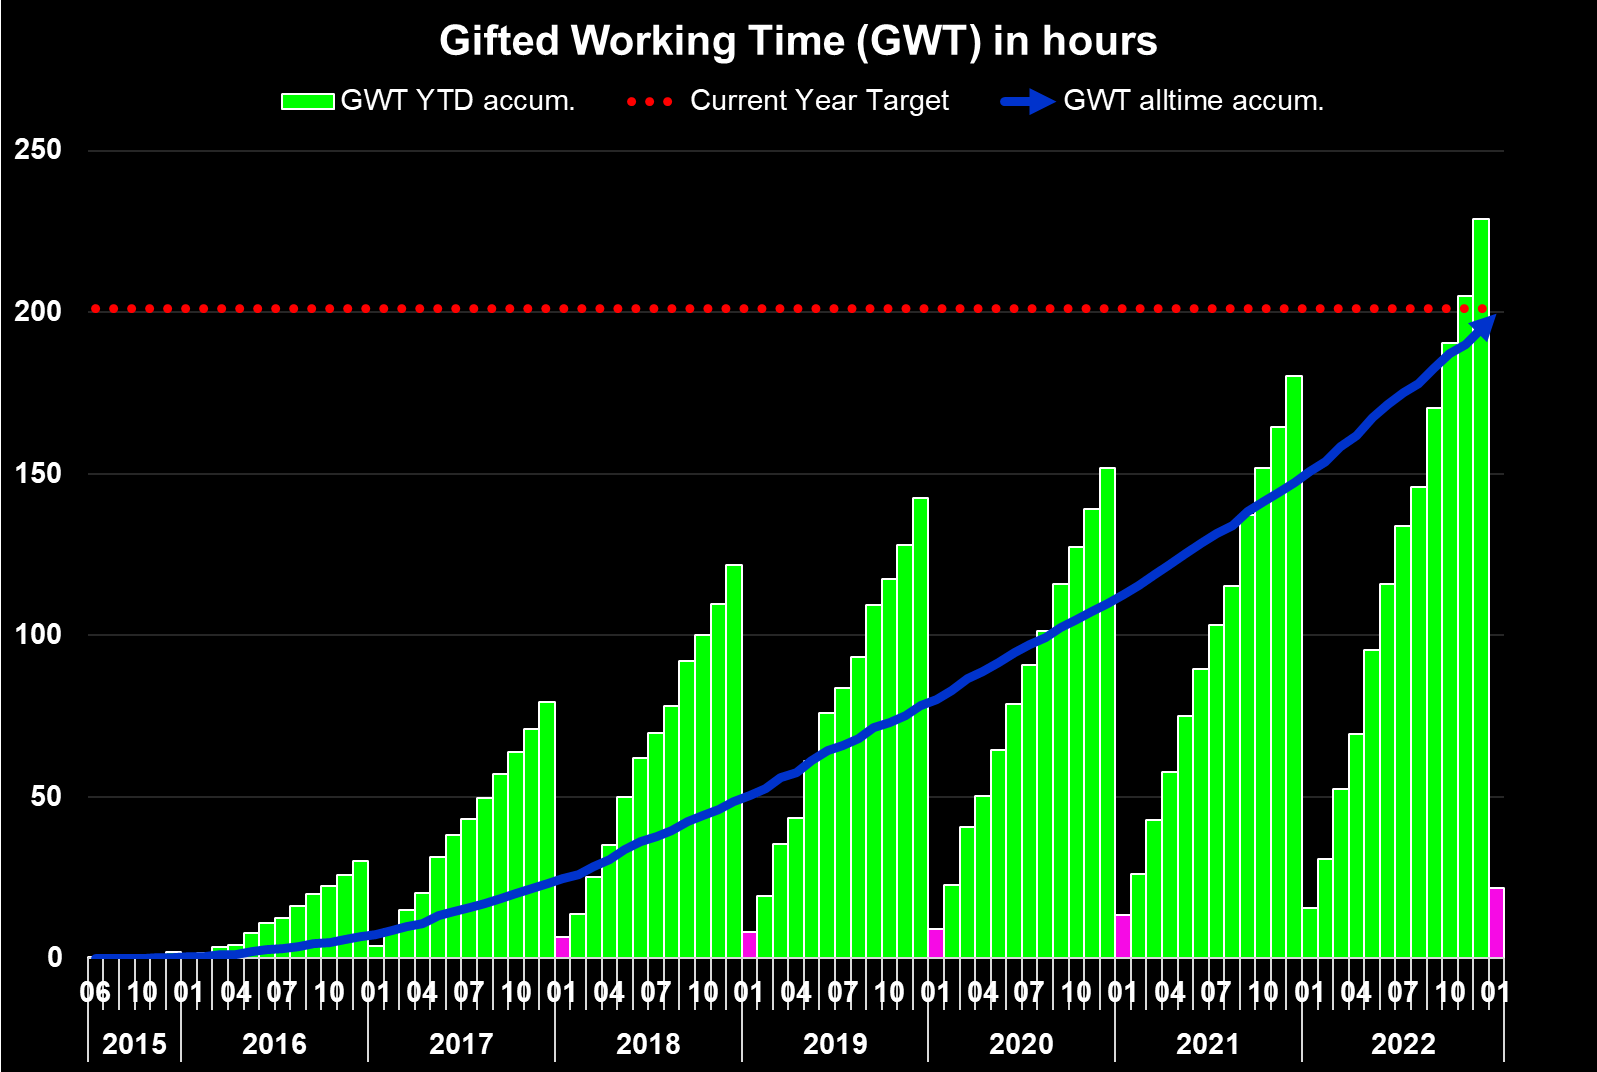
Another way to express the monthly dividend income is in terms of Gifted Working Time (GWT). Assuming an average hourly rate of $32.34 for 2022, my GWT and annual net dividends have been as follows:
- 2018: 121 hours GWT, $3,000 in annual net dividends
- 2019: 142 hours GWT, $3,600 in annual net dividends
- 2020: 152 hours GWT, $3,800 in annual net dividends
- 2021: 180 hours GWT, $5,050 in annual net dividends
- 2022: 229 hours GWT, $6,400 in annual net dividends
- 2023: Targeting at least 216 hours GWT, $7,000 in annual net dividends
I expect overall GWT to decrease in 2023 due to higher calculated hourly rates, as I project a 10% increase in the hourly rate due to inflation.
The overall target for the year with $7,000 in annual net dividends is very conservative but I expect that I will have to take out some risk from my portfolio as mentioned above. Also, the stronger Euro (I am receiving dividends in EUR and then converting those to USD at current exchange rates for these updates) will have adverse impact. Still, as the year unfolds I expect to be able to pass that target and potentially even reach my next milestone of $8,000 as well.
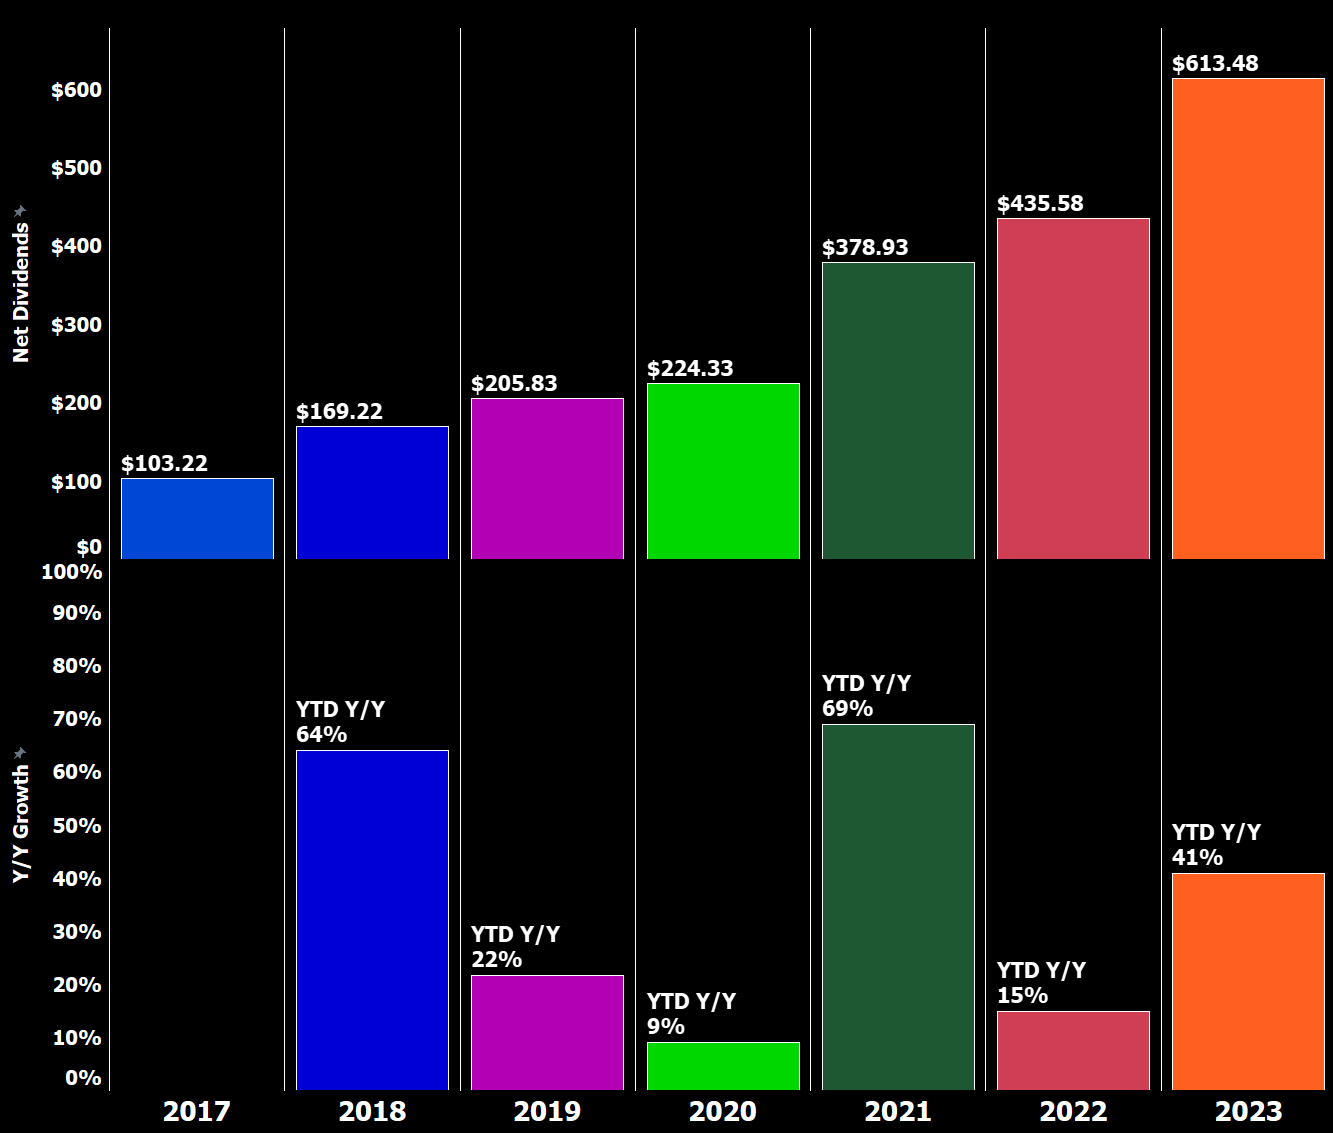
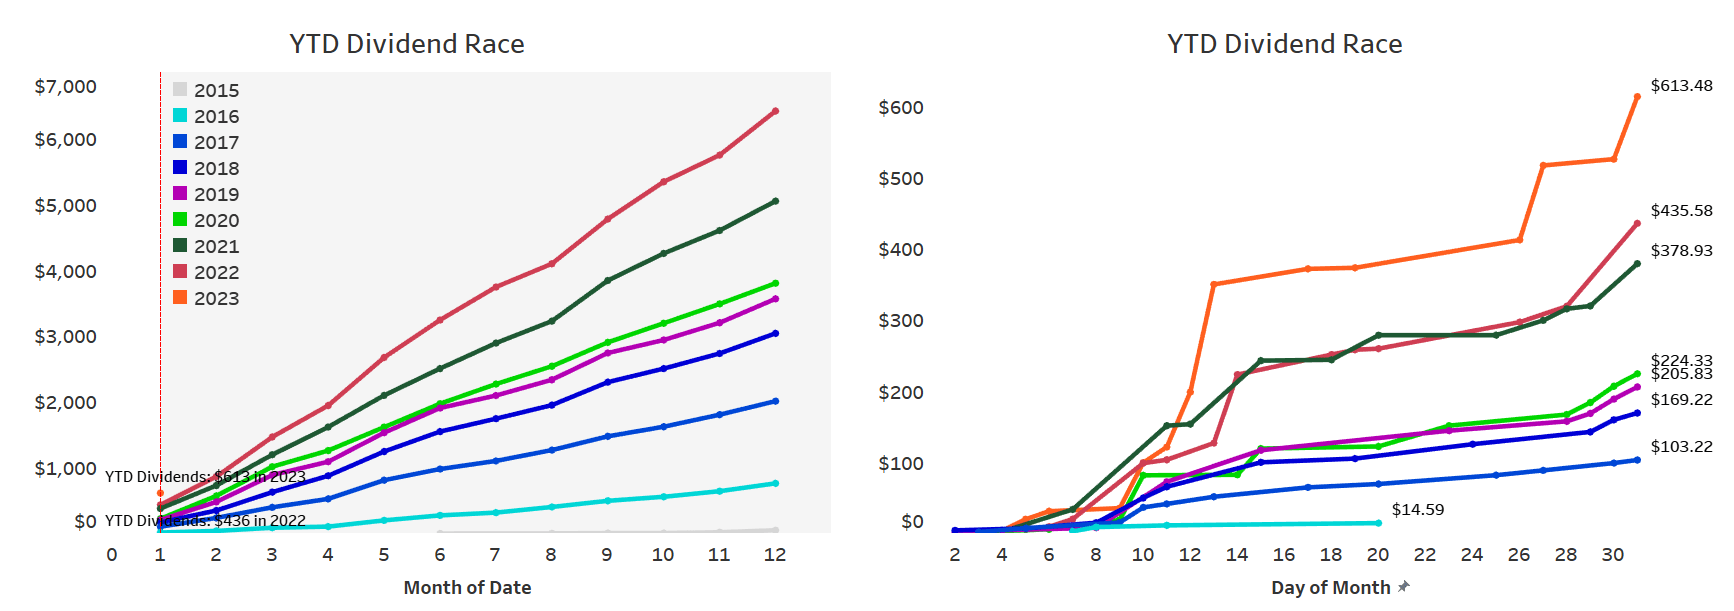
Across the years, my YTD Dividend Race has been as follows:
- 2018: Disappointing
- 2019: Phenomenal, benefiting from a low baseline in the prior year
- 2020: Fairly disappointing
- 2021: Phenomenal
- 2022: Much better than expected fueled by the very weak euro
- 2023: Targeting a conservative low single-digit growth rate
YTD Dividend Growth (Designed by author)
I have updated the YTD Dividend Race chart to show the development of YTD dividend income on a daily basis, allowing us to see that most of my dividend income is generated mid-month and towards the end of the month. The chart also breaks down the development by month for the current year, making it easy to identify significant jumps in income.
YTD Dividend Race (Designed by author)
Expressed in GWT, it presents itself as follows:
Gifted Working Time in Hours (Designed by author)
What this shows is as follows:
- All time (blue area) - Around 958 hours, or 120 days, of active work have been replaced with passive income since the start of my dividend journey. Assuming a five-day workweek, this translates into 24 weeks of vacation funded via dividends.
- Full-year 2023 (green bars) - Around 22 hours, or 2.7 days, of active work have been replaced with passive income in 2022 already, which is basically 50% of a full-time work week funded with dividends.
- Highlighted in pink is the accumulated YTD total at the end of the current reporting month ( January ).
This visualization allows us to see the overall impact of my dividend income on the amount of active work I am able to replace with passive income. It also enables us to see the progress made year-to-date, as well as the accumulated total at the end of the current reporting month.
At the end of January, my dividend portfolio is composed as follows:
| Company Name |
| Ticker |
| % Market Value |
| Apple Inc. |
| ( AAPL ) |
| 10.69% |
| Visa Inc |
| ( V ) |
| 4.36% |
| AbbVie Inc |
| ( ABBV ) |
| 3.61% |
| McDonald's Corp |
| ( MCD ) |
| 3.41% |
| Microsoft Corporation |
| ( MSFT ) |
| 3.15% |
| Cisco Systems, Inc. |
| ( CSCO ) |
| 2.73% |
| W.P. Carey |
| ( WPC ) |
| 2.52% |
| AT&T Inc. |
| ( T ) |
| 2.43% |
| Johnson & Johnson |
| ( JNJ ) |
| 2.39% |
| Ares Capital Corporation |
| ( ARCC ) |
| 2.34% |
| Stag Industrial Inc |
| ( STAG ) |
| 2.26% |
| Main Street Capital Corporation |
| ( MAIN ) |
| 2.15% |
| Shell |
| ( SHEL ) |
| 2.07% |
| JPMorgan Chase & Co. |
| ( JPM ) |
| 1.97% |
| Texas Instruments Incorporated |
| ( TXN ) |
| 1.90% |
| Home Depot |
| ( HD ) |
| 1.79% |
| Gilead Sciences, Inc. |
| ( GILD ) |
| 1.77% |
| Wells Fargo & Co |
| ( WFC ) |
| 1.72% |
| Altria Group Inc |
| ( MO ) |
| 1.69% |
| Toronto-Dominion Bank |
| ( TD ) |
| 1.67% |
| NVIDIA Corporation |
| ( NVDA ) |
| 1.64% |
| Medical Properties Trust |
| ( MPW ) |
| 1.63% |
| Allianz SE |
| ( OTCPK:ALIZF ) |
| 1.61% |
| Southern Co |
| ( SO ) |
| 1.60% |
| Bank of Nova Scotia |
| ( BNS ) |
| 1.46% |
| Siemens Healthineers |
| ( OTCPK:SEMHF ) |
| 1.34% |
| Blackstone Group LP |
| ( BX ) |
| 1.28% |
| Commonwealth Bank of Australia |
| ( OTCPK:CBAUF ) |
| 1.27% |
| Enbridge |
| ( ENB ) |
| 1.11% |
| BMW |
| ( OTCPK:BMWYY ) |
| 1.09% |
| Morgan Stanley |
| ( MS ) |
| 1.07% |
| Broadcom Inc |
| ( AVGO ) |
| 1.05% |
| Hercules Capital |
| ( HTGC ) |
| 1.05% |
| New Residential Corporation |
| ( RITM ) |
| 1.02% |
| Intel Corporation |
| ( INTC ) |
| 0.94% |
| PepsiCo, Inc. |
| ( PEP ) |
| 0.92% |
| Procter & Gamble Co |
| ( PG ) |
| 0.86% |
| Philip Morris International Inc. |
| ( PM ) |
| 0.83% |
| BP2 |
| ( BP ) |
| 0.78% |
| Bank of America Corp |
| ( BAC ) |
| 0.76% |
| Annaly Capital Management |
| ( NLY ) |
| 0.76% |
| Honeywell International Inc. |
| ( HON ) |
| 0.76% |
| BP1 |
| ( BP ) |
| 0.75% |
| Starwood Property Trust, Inc. |
| ( STWD ) |
| 0.75% |
| Gladstone Commercial Corporation |
| ( GOOD ) |
| 0.75% |
| Daimler |
| (DDAIF) |
| 0.72% |
| Realty Income Corp |
| ( O ) |
| 0.68% |
| Store Capital |
| ( STOR ) |
| 0.67% |
| Target Corporation |
| ( TGT ) |
| 0.66% |
| The Coca-Cola Co |
| ( KO ) |
| 0.55% |
| Stryker |
| ( SYK ) |
| 0.55% |
| 3M Co |
| ( MMM ) |
| 0.55% |
| NextEra Energy Partners LP |
| ( NEP ) |
| 0.54% |
| Unilever NV ADR |
| ( UL ) |
| 0.52% |
| Brookfield Renewable Partners |
| ( BEP ) |
| 0.50% |
| Apple Hospitality REIT |
| ( APLE ) |
| 0.50% |
| Royal Bank of Canada |
| ( RY ) |
| 0.48% |
| CVS Health Corp |
| ( CVS ) |
| 0.43% |
| Dominion Energy Inc |
| ( D ) |
| 0.42% |
| Verizon Communications Inc. |
| ( VZ ) |
| 0.42% |
| Spirit Realty Corporation |
| ( SRC ) |
| 0.38% |
| BASF |
| ( OTCQX:BASFY ) |
| 0.38% |
| AGNC Investment Corporation |
| ( AGNC ) |
| 0.38% |
| Gladstone Capital |
| ( GLAD ) |
| 0.37% |
| Sino AG |
| (XTP.F) |
| 0.36% |
| Gladstone Investment |
| ( GAIN ) |
| 0.35% |
| Medtronic |
| ( MDT ) |
| 0.35% |
| Canadian Imperial Bank of Commerce |
| ( CM ) |
| 0.34% |
| Walgreens Boots Alliance Inc |
| ( WBA ) |
| 0.32% |
| B&G Foods, Inc. |
| ( BGS ) |
| 0.32% |
| Exxon Mobil Corporation |
| ( XOM ) |
| 0.31% |
| NextEra Energy |
| ( NEE ) |
| 0.30% |
| Pfizer Inc. |
| ( PFE ) |
| 0.29% |
| Antero Midstream Corporation |
| ( AM ) |
| 0.27% |
| Apollo Commercial Real Est. Finance Inc |
| ( ARI ) |
| 0.27% |
| General Electric Company |
| ( GE ) |
| 0.27% |
| Kinder Morgan Inc |
| ( KMI ) |
| 0.26% |
| Alibaba Group Holding Ltd |
| ( BABA ) |
| 0.25% |
| ZIM Integrated Shipping Services |
| ( ZIM ) |
| 0.25% |
| Apollo Investment |
| ( MFIC ) |
| 0.23% |
| SIXT |
| ( OTC:SXTSY ) |
| 0.22% |
| Mastercard |
| ( MA ) |
| 0.18% |
| Colgate-Palmolive Company |
| ( CL ) |
| 0.17% |
| Bayer AG |
| ( OTCPK:BAYZF ) |
| 0.17% |
| BRT Realty Trust |
| ( BRT ) |
| 0.17% |
| Omega Healthcare Investors Inc |
| ( OHI ) |
| 0.16% |
| Vonovia |
| ( OTCPK:VONOY ) |
| 0.16% |
| Blue Owl Capital |
| ( OWL ) |
| 0.09% |
| Fresenius SE |
| ( OTCPK:FSNUF ) |
| 0.08% |
| Boeing |
| ( BA ) |
| 0.07% |
| Uniti Group Inc |
| ( UNIT ) |
| 0.06% |
| Walt Disney Co |
| ( DIS ) |
| 0.05% |
| Bank of Montreal |
| ( BMO ) |
| 0.05% |
| Equitrans Midstream Corporation |
| ( ETRN ) |
| 0.05% |
| Newtek Business Services |
| ( NEWT ) |
| 0.05% |
| The GEO Group Inc |
| ( GEO ) |
| 0.04% |
| Fresenius Medical Care |
| ( FMS ) |
| 0.04% |
| Owl Rock Capital Corporation |
| ( ORCC ) |
| 0.03% |
| Service Properties Trust |
| ( SVC ) |
| 0.02% |
| Diversified Healthcare Trust |
| ( DHC ) |
| 0.02% |
For further details see:
My Dividend Stock Portfolio: New January Record - 100 Holdings With 26 Buys