INTC - My Dividend Stock Portfolio: New October Dividend Record - 98 Holdings With 23 Buys
2023-11-15 08:10:00 ET
Summary
- S&P 500 and Dow Jones dropped for the third straight month in October, just before staging a remarkable reversal in November.
- Interest rates were kept steady again in a range of 5.25% to 5.5%, and it is uncertain if 2023 will see yet another hike.
- Net investments of around $1,800 in October, primarily targeting the financial sector and high-yielding BDCs.
- Dividend income hit an October record of $614, up 8% annually and flat sequentially, with the goal of adding at least $100 in forward dividend income every month hit again.
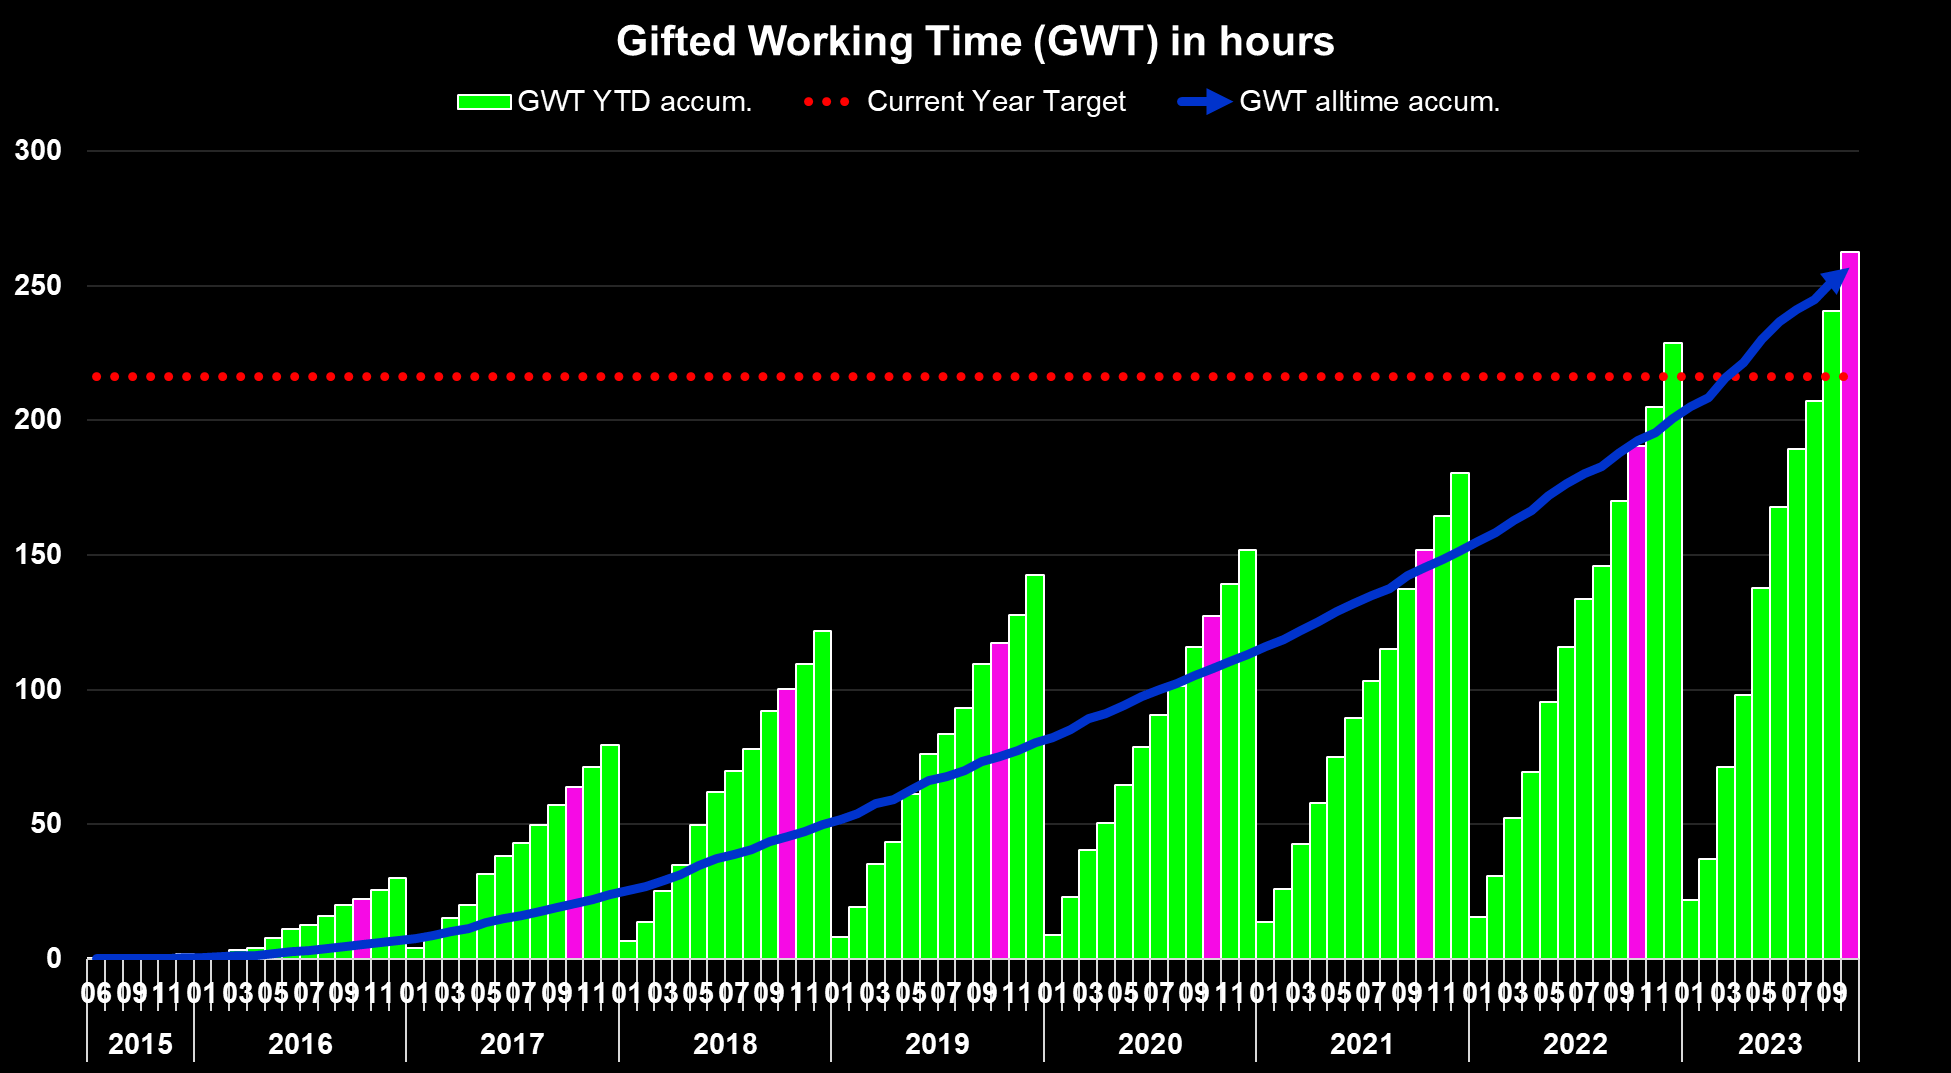
- Gifted Working Time 2023: Around 262 hours, or 33 days, of active work have been replaced with passive income in 2023 already, which is basically equivalent to six full-time working weeks funded with dividends or to my entire annual vacation.
Stocks dropped for the third straight month in October as the Dow shed 1.3%, the S&P500 fell 2.1% and the tech-heavy NASDAQ slipped 2.8%. Small and mid-cap stocks performed particularly bad with the Russell 2000 collapsing 6.8%.
The earnings season is in full swing and so far, based on my observations, earnings have been really positive and the fear that higher interest rates will lead to many companies struggling has not materialized. I loved every day this month as lower stock prices are always appreciated especially knowing that sentiment can turn incredibly quickly and the bargains of today can quickly diminish.
In fact, this is exactly what happened following the latest Fed meeting in early November with stocks erasing one full month of losses and more within just a few days. As a result many stocks, with eye-popping yields the week(s) before that basically were too good to be true like Hercules Capital dropping below $15 for no good reason, have rallied substantially. I will keep on buying BDCs nevertheless as they will continue to be the winners in this interest rate environment.
Portfolio Changes in October
Investment activity in October picked up from September as I was able to invest around $1,800. I remained busy deploying dividends, income and capital earned in September as well as additional income from other sources. Unfortunately, the markets are pushing my favorite BDCs higher almost every single day, but there are still some 10%+ dividend yields available and ready to be taken. As a result, buying opportunities continue to fade, but even with lower yields, I still very much favor BDCs and won't stop buying.
I continued to add to W.P. Carey ( WPC ) as all the negative sentiment and the heavy stock price collapse following the announced spinoff of its office portfolio is in my mind completely overrated. I am also not disappointed about WPC's guidance for next year and instead look forward to its potential over at least the next five years while carefully monitoring how it manages its looming debt towers.
Negative sentiment hit a peak with Medical Properties Trust ( MPW ) as the market punished the stock into an area of around $4.50 which is almost criminal. Earnings have showed that MPT is doing fine and while there won't be much growth in the near future, the company can also handle its debt and does not face bankruptcy like what the markets' pricing would have implied. Instead I believe the market, or the algos, basically have no real idea how to value such stocks in this interest rate environment and instead of asking useful questions they just sell the stock. For me this creates interesting buying opportunities and I am taking them.
My biggest purchases in October 2023 were again several small transactions to acquire more shares of Ares Capital ( ARCC ) which remains my #1 dividend payer in the entire portfolio and is on track to deliver $200 in net dividends in December. Similarly, I made several investments into Hercules Capital ( HTGC ), W.P. Carey, MidCap Financial Investment Corporation ( MFIC ) and Main Street Capital Corporation ( MAIN ).
I also continue to like Rithm Capital Corp. ( RITM ) and Gladstone Investment ( GAIN ). Most of the BDCs I am invested in are on fire this year easily outperforming the S&P 500 while at the same time providing double-digit or close to double-digit yields.
Overall, I did manage to add $137 in forward annual dividend income this month, which brings YTD added annual dividend income to more than $1,350 already. My goal is to be able to add at least $100 in forward dividend income every month and as things are developing right now, this is a very reasonable and realistic target to achieve and overachieve as long as BDCs remain a dominant part of my asset allocation and continue to boast these very attractive yet safe 7%+ yields.
All these purchases break down as follows:
Added Dividend Income (Designed by author)
All net purchases in October can be found below:
Net Purchases in October (Designed by author)
Dividend Income October 2023
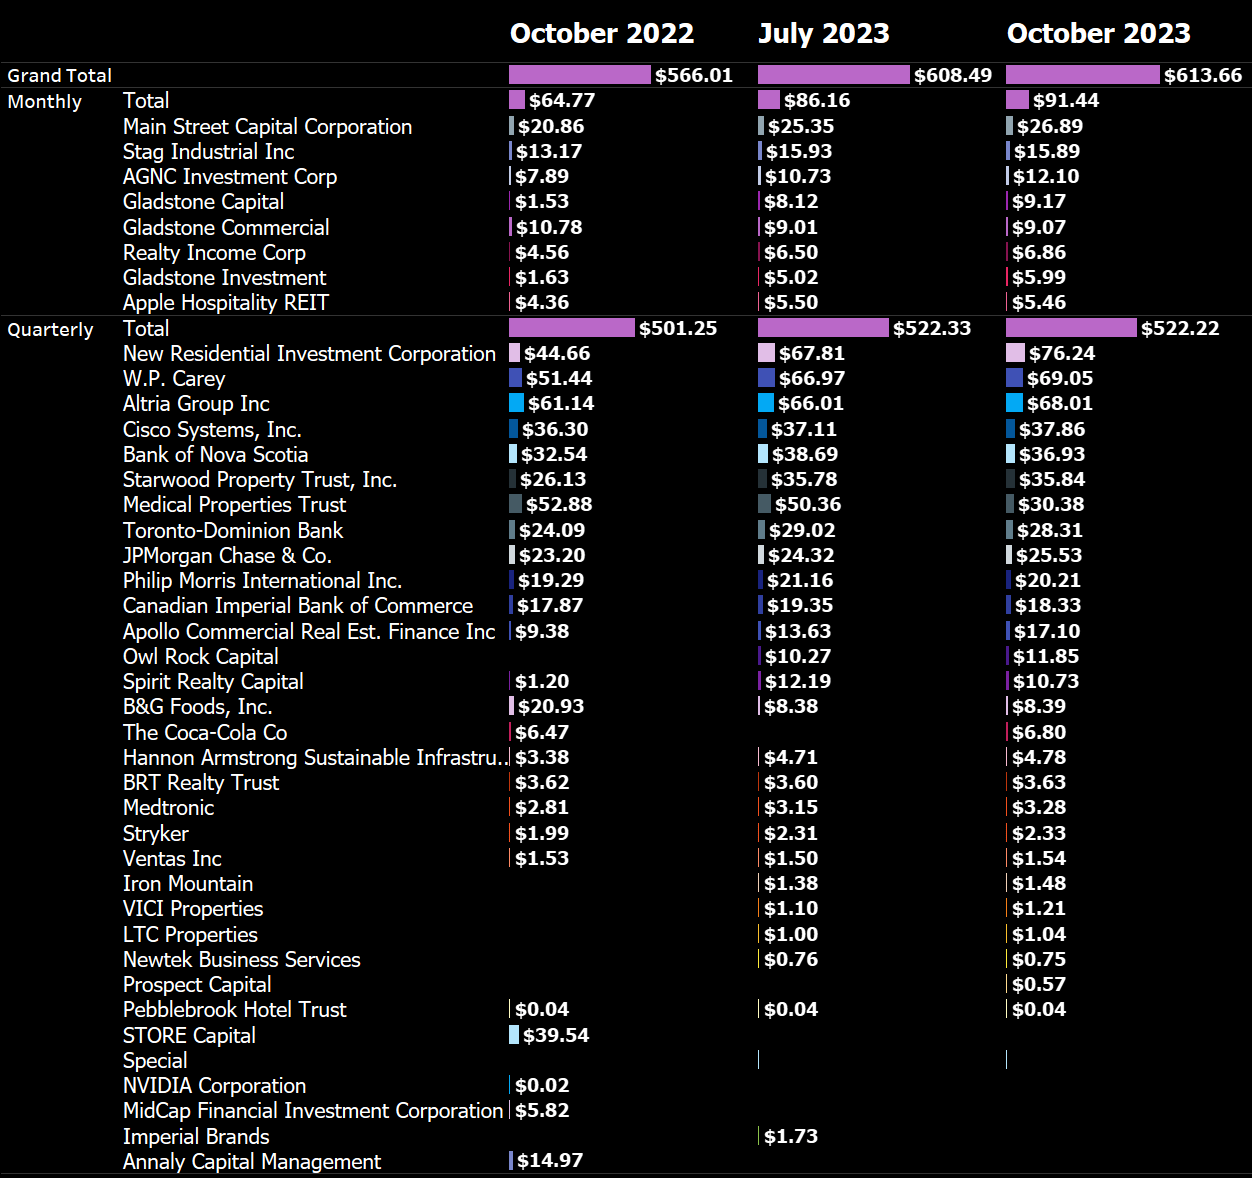
Dividend income hit a new all-time record for October of $614, up 8% annually and basically flat sequentially. Year-over-year performance is particularly promising given that in October 2022 STORE Capital was still a big dividend payer and companies like Medical Properties Trust and B&G Foods ( BGS ) hadn't cut their dividends yet. Adjusting for those effects would have resulted in very strong 25% Y/Y growth but of course this is not how it works. Dividend cuts are painful and ideally should never happen to any of the positions I am invested in. For these two particular stocks I am actually glad they did cut their dividend finally in order to have more and hopefully enough money to manage debt in the short- to medium-term.
Sequential performance is flat as the dividend cut from Medical Properties Trust became effective. I am particularly thrilled about the $91 from my monthly dividend payers, a figure which is inching closer and closer to $100 in a non-special dividend month and could even hit $200 in December when factoring in the special dividends from Main Street Capital Corporation and especially the mega one-off dividend from Gladstone Investment.
Following ongoing investments into high-yielding RITM helped dividend income from RITM to push even higher and leave W.P. Carey a distant second. This gap, unfortunately, will massively widen in January 2024 due to the looming 20% dividend cut from W.P. Carey. It will be interesting to see if ongoing investments and any organic dividend growth will be enough to offset that impact already in January or if it will take a few more quarters.
October 2023 Net Dividends (Designed by author)
The dividend income from my top 3 regular dividend payers in October has now reached $213 mark (up from $190 in April) and the YTD average of $195 is up substantially from the $138 in 2022 which is mainly driven by regular investments in both W. P. Carey and Rithm Capital.
All this is depicted below:
Top 3 Dividend Payers (Designed by author)
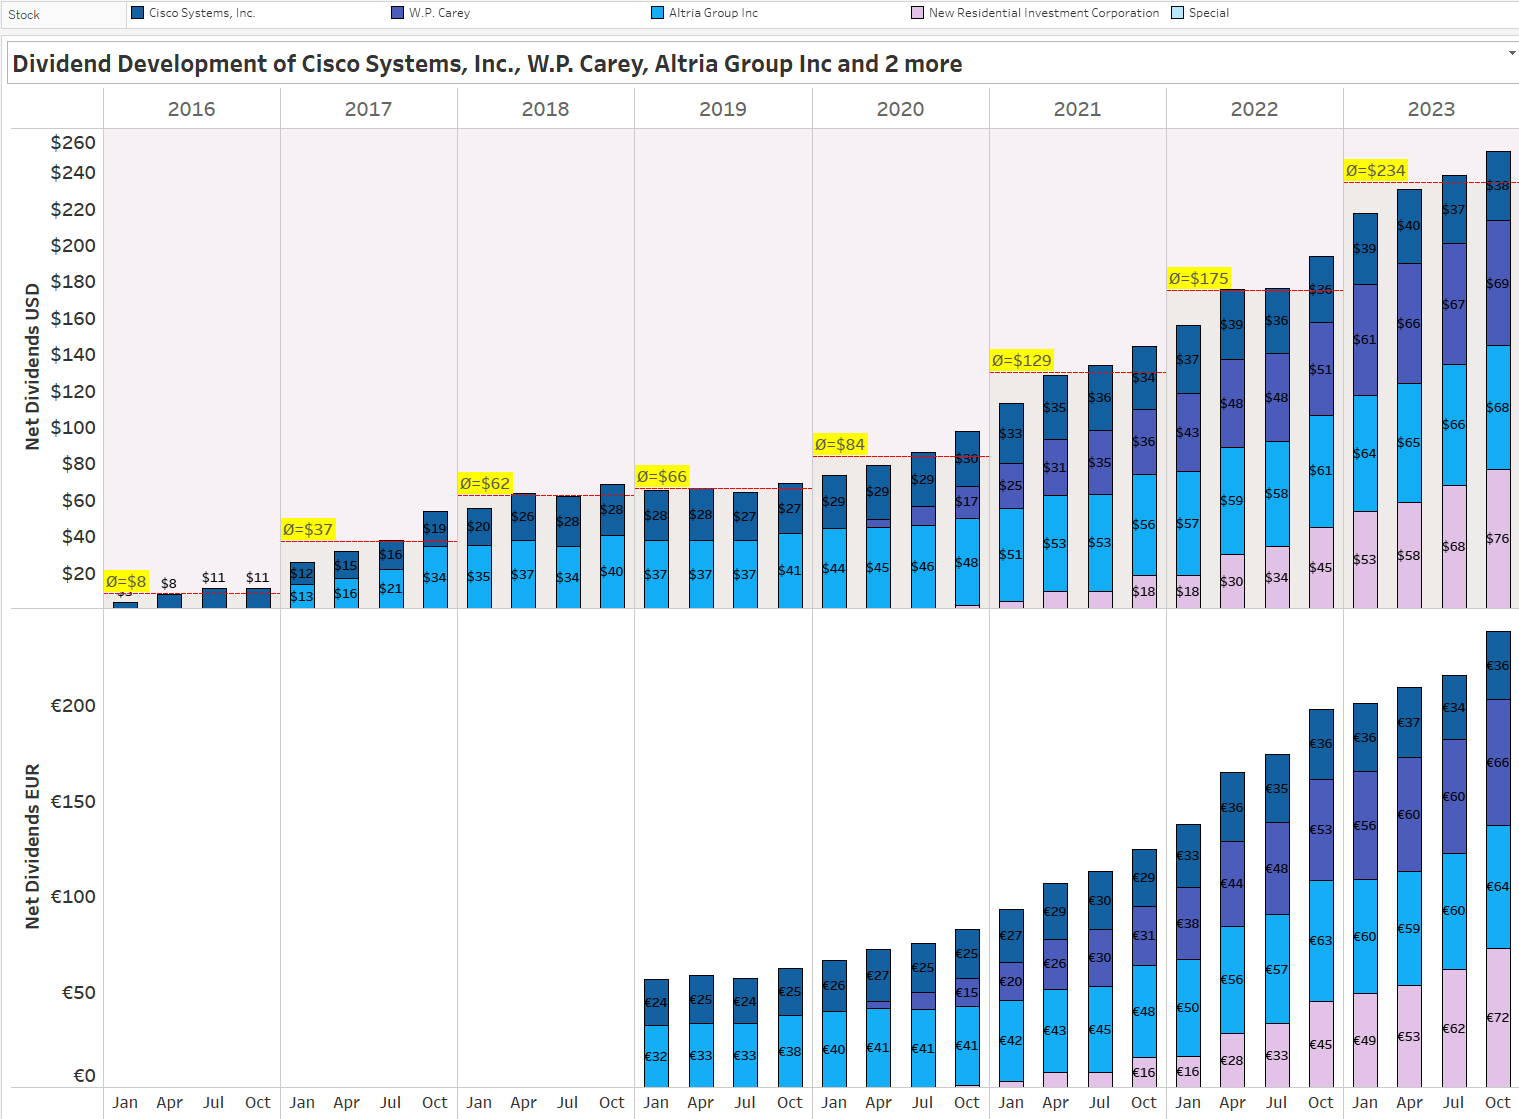
Here is a chart that shows the development of my net dividend income by month over time between 2015 and 2023. You can see the growth of my dividend income and the average annual dividend for each year:
All-time Dividend Development (Designed by author)
This chart is my favorite because it illustrates the progression of my dividend income over time and allows me to easily see the average annual dividend for each year.
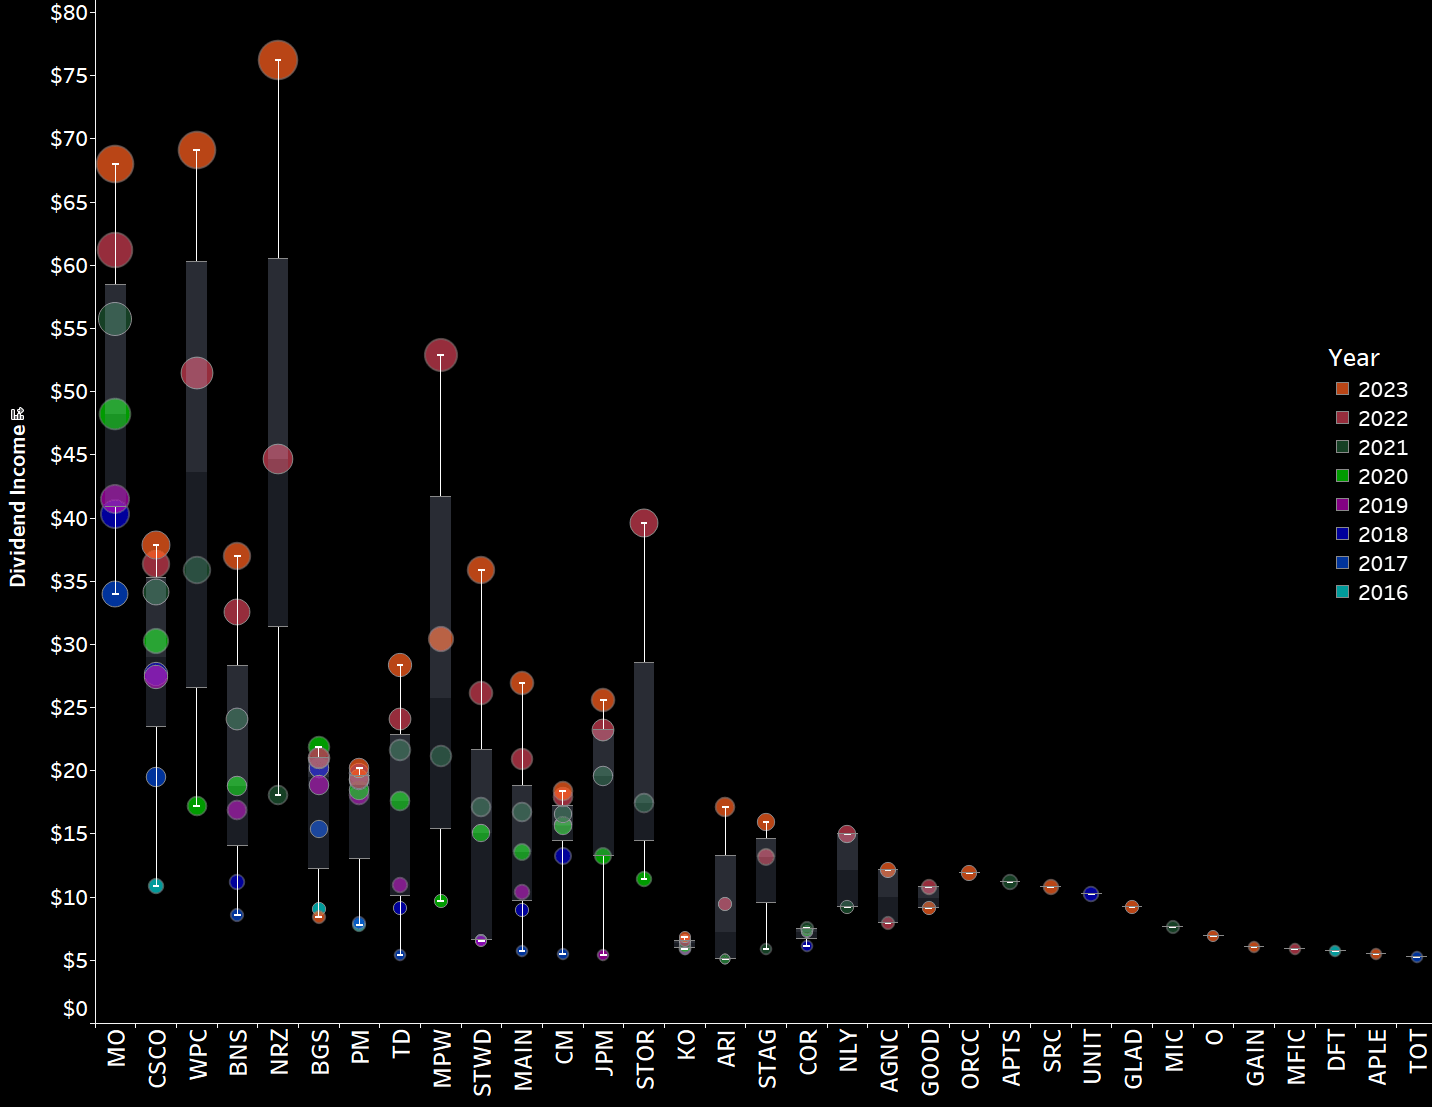
Next, I have plotted all of the individual dividend payments I have received, coloring them by year and arranging the years side by side instead of horizontally as in previous updates. This visualization allows for a more comprehensive analysis of the distribution of my dividend payments over time.
Dividend Payment Bubbles (Designed by author)
By plotting the data in this way, we can easily see the distribution of dividend payments across different years and gain insights into the overall growth of my dividend income over time.
This visualization is initially quite cluttered, but it contains a wealth of information. It shows every individual dividend payment I have received since I began my investment journey in 2015, represented as a circle that is colored and sized according to its contribution. The view is organized by month and year, allowing for a more comprehensive analysis of the development of my dividend income over time. For each year and month, a white rectangle indicates the average monthly dividend. The area where dividends fall below the average is filled in dark red, while the area above the average is colored dark green. I greatly prefer this redesigned version of my old "bubbles chart" because it makes it much easier to identify trends and developments in my dividend income. This type of data visualization allows for a detailed examination of the distribution of my dividend payments over time and enables me to more easily identify trends and patterns in my income growth.
October 2023 Dividends (Designed by author)
Now zooming in on October , we can immediately see a number of big green circles in a sea of black. The bigger the circle and the bigger the distance to the previous circle for the same stock, the bigger is the change in dividend income compared to the prior years.
We can clearly see the dominance and significance of Altria ( MO ), W. P. Carey, and Rithm Capital. They have a strong presence in the visual representation.
When it comes to the dividends for 2023, I notice mostly orange circles at the top of the scale, which is exactly what I want to see. These big orange circles represent a rising dividend income, and my goal is to have as many of them as possible at the top of the chart.
Overall, my aim is to observe numerous large orange circles positioned at the highest point on the scale. This signifies a positive trend of increasing dividend income, which is precisely what I'm striving for.
Another way to express the monthly dividend income is in terms of Gifted Working Time (GWT). Assuming an average hourly rate of $32.34 for 2023, my GWT and annual net dividends have been as follows:
- 2018: 121 hours GWT, $3,000 in annual net dividends
- 2019: 142 hours GWT, $3,600 in annual net dividends
- 2020: 152 hours GWT, $3,800 in annual net dividends
- 2021: 180 hours GWT, $5,050 in annual net dividends
- 2022: 229 hours GWT, $6,400 in annual net dividends
- 2023: Targeting at least 216 hours GWT, $7,000 in annual net dividends
I expect overall GWT to decrease in 2023 due to higher calculated hourly rates, as I project a 10% increase in the hourly rate due to inflation.
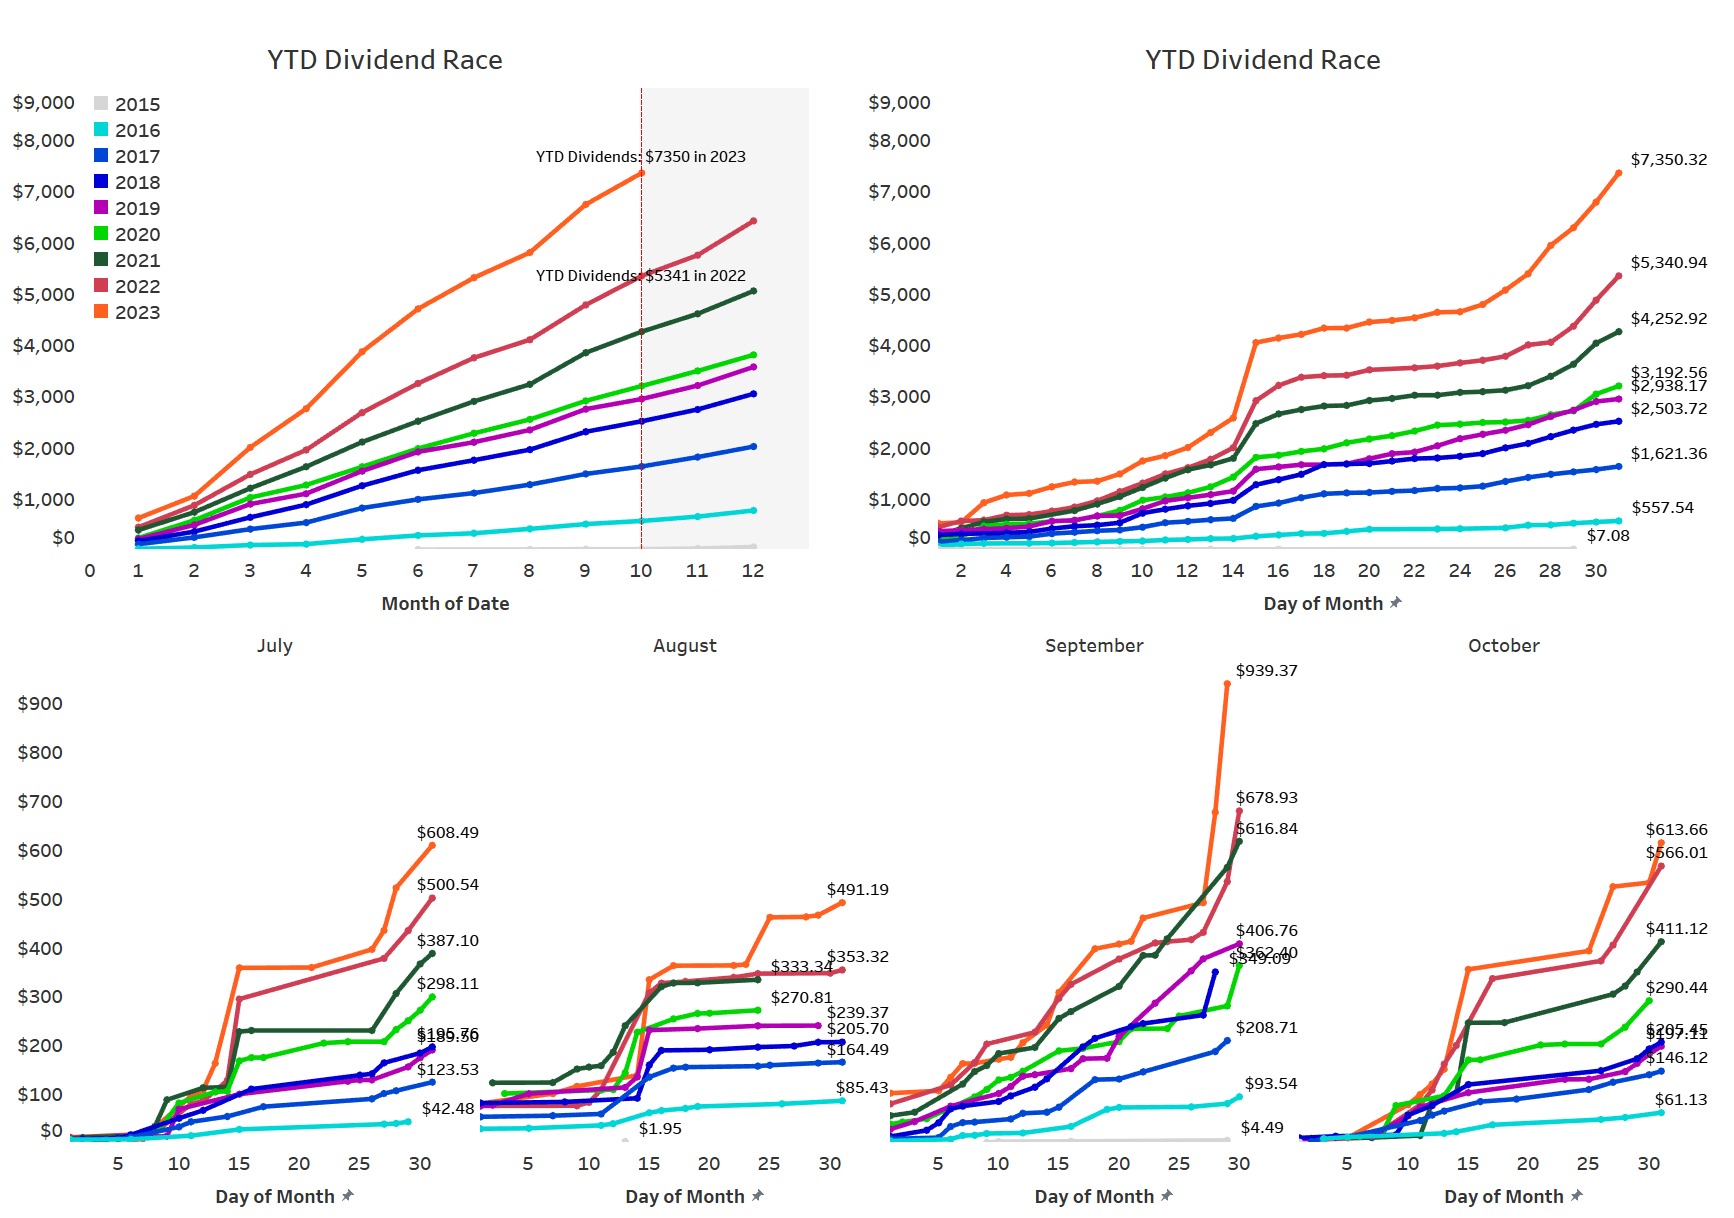
The overall target for the year with $7,000 in annual net dividends is very conservative, but I expect that I will have to take out some risk from my portfolio as mentioned above. Also, the stronger euro (I am receiving dividends in EUR and then converting those to USD at current exchange rates for these updates) will have adverse impact. Still, as the year unfolds, I expect to be able to pass that target and potentially even reach my next milestone of $8,000 as well. By the end of October 2023, my realized dividend income has been blowing away my expectations by several dimensions with YTD net dividend growth still coming in at a sizzling and unsustainable 38% Y/Y (down only marginally from the 42% growth rate at the end of the previous quarter in July). That growth will certainly come down a bit more over the next two months as the year comes to an end, but given I had only been targeting a low single-digit growth rate, it is already clear that I will easily achieve a double-digit growth rate in dividend income, which is fantastic. In fact, my original target of $7,000 in annual net dividends has already been eclipsed in October with YTD dividends of $7,350 collected.
As a result I am now projecting that I will hit $8,500 in net dividends by the end of the year and thus can target the $10,000 milestone already for next year. Obviously, there is still a very long way to go before reaching financial independence but as the journey continues the dividend snowball will keep on gaining momentum and sooner rather than later I will have a four digit figure in monthly net dividends which I will then reinvest. To put that into perspective this figure would roughly equate what I was able to invest in total per month at the beginning of my journey in 2015.
Across the years, my YTD Dividend Race has been as follows:
- 2018: Disappointing
- 2019: Phenomenal, benefiting from a low baseline in the prior year
- 2020: Fairly disappointing
- 2021: Phenomenal
- 2022: Much better than expected fueled by the very weak euro
- 2023: Targeting a conservative low single-digit growth rate (the more likely scenario is now a 25%+ increase in dividend income)
YTD Dividend Growth (Designed by author)
I have updated the YTD Dividend Race chart to show the development of YTD dividend income on a daily basis, allowing us to see that most of my dividend income is generated mid-month and towards the end of the month. The chart also breaks down the development by month for the current year, making it easy to identify significant jumps in income.
YTD Dividend Race (Designed by author)
Expressed in GWT, it presents itself as follows:
Gifted Working Time in Hours (Designed by author)
What this shows is as follows:
- All time (blue area) - Around 1,199 hours, or 150 days, of active work have been replaced with passive income since the start of my dividend journey. Assuming a five-day workweek, this translates into 30 weeks of vacation funded via dividends, which itself is equal to more than half a year in total.
- Full-year 2023 (green bars) - Around 262 hours, or 32.8 days, of active work have been replaced with passive income in 2023 already, which is basically equivalent to six full-time working weeks funded with dividends, or to put differently, the YTD dividends have so far provided me with around 1.5 extra monthly salaries and if this trend continues, it will accumulate to over two monthly salaries by year-end even though the second part of the year is expected to be weaker than the first half due to the volume of annual dividend payers in Q2.
- Highlighted in pink is the accumulated YTD total at the end of the current reporting month ( October ).
This visualization allows us to see the overall impact of my dividend income on the amount of active work I am able to replace with passive income. It also enables us to see the progress made year-to-date, as well as the accumulated total at the end of the current reporting month.
Upcoming November Dividends
Contrary to October, November features significantly fewer dividend payers but among them are the big annual dividends from German companies as well as the still sizable dividend from AT&T ( T ). Beyond that dividend payments are overall concentrated in the first half of the month with only 2 meaningful dividend payments from high-yielding Hercules Capital and the Royal Bank of Canada ( RY ) expected in the second half of November.
The snapshot below is taken from my free-for-all released Dividend Calendar (make sure to follow instructions in the video) and shows my expected dividend payments in November.
My Dividend Calendar (Designed by Author)
At the end of October, my dividend portfolio is composed as follows:
| Company Name |
| Ticker |
| % Market Value |
| Market Value (€) |
| Apple Inc. |
| ( AAPL ) |
| 11.53% |
| 24,373 |
| Visa Inc |
| ( V ) |
| 4.37% |
| 9,238 |
| Microsoft Corporation |
| ( MSFT ) |
| 4.08% |
| 8,617 |
| Ares Capital Corporation |
| ( ARCC ) |
| 3.53% |
| 7,467 |
| AbbVie Inc |
| ( ABBV ) |
| 3.50% |
| 7,395 |
| McDonald's Corp |
| ( MCD ) |
| 3.49% |
| 7,377 |
| NVIDIA Corporation |
| ( NVDA ) |
| 3.12% |
| 6,598 |
| Cisco Systems, Inc. |
| ( CSCO ) |
| 2.83% |
| 5,993 |
| Main Street Capital Corporation |
| ( MAIN ) |
| 2.35% |
| 4,964 |
| Commonwealth Bank of Australia |
| ( OTCPK:CBAUF ) |
| 2.31% |
| 4,890 |
| Stag Industrial Inc |
| ( STAG ) |
| 2.25% |
| 4,755 |
| Shell |
| ( SHEL ) |
| 2.22% |
| 4,698 |
| Johnson & Johnson |
| ( JNJ ) |
| 2.10% |
| 4,430 |
| W.P. Carey |
| ( WPC ) |
| 1.94% |
| 4,110 |
| AT&T Inc. |
| ( T ) |
| 1.94% |
| 4,103 |
| JPMorgan Chase & Co. |
| ( JPM ) |
| 1.89% |
| 3,999 |
| Allianz SE |
| ( OTCPK:ALIZF ) |
| 1.86% |
| 3,932 |
| Home Depot |
| ( HD ) |
| 1.77% |
| 3,736 |
| Broadcom Inc |
| ( AVGO ) |
| 1.65% |
| 3,497 |
| Texas Instruments Incorporated |
| ( TXN ) |
| 1.64% |
| 3,475 |
| Gilead Sciences, Inc. |
| ( GILD ) |
| 1.63% |
| 3,439 |
| Southern Co |
| ( SO ) |
| 1.59% |
| 3,362 |
| Hercules Capital |
| ( HTGC ) |
| 1.56% |
| 3,293 |
| Toronto-Dominion Bank |
| ( TD ) |
| 1.46% |
| 3,089 |
| Altria Group Inc |
| ( MO ) |
| 1.45% |
| 3,059 |
| Wells Fargo & Co |
| ( WFC ) |
| 1.43% |
| 3,014 |
| New Residential Corporation |
| ( RITM ) |
| 1.42% |
| 3,002 |
| Intel Corporation |
| ( INTC ) |
| 1.26% |
| 2,656 |
| Blackstone Group LP |
| ( BX ) |
| 1.25% |
| 2,649 |
| Bank of Nova Scotia |
| ( BNS ) |
| 1.20% |
| 2,534 |
| Siemens Healthineers |
| ( OTCPK:SEMHF ) |
| 1.14% |
| 2,400 |
| Apollo Investment |
| ( MFIC ) |
| 1.12% |
| 2,375 |
| Enbridge |
| ( ENB ) |
| 1.12% |
| 2,366 |
| BMW |
| ( OTCPK:BMWYY ) |
| 0.96% |
| 2,040 |
| BP2 |
| ( BP ) |
| 0.87% |
| 1,836 |
| PepsiCo, Inc. |
| ( PEP ) |
| 0.86% |
| 1,819 |
| Procter & Gamble Co |
| ( PG ) |
| 0.86% |
| 1,812 |
| Morgan Stanley |
| ( MS ) |
| 0.77% |
| 1,638 |
| BP1 |
| ( BP ) |
| 0.74% |
| 1,555 |
| Philip Morris International Inc. |
| ( PM ) |
| 0.70% |
| 1,488 |
| Honeywell International Inc. |
| ( HON ) |
| 0.67% |
| 1,416 |
| Starwood Property Trust, Inc. |
| ( STWD ) |
| 0.67% |
| 1,410 |
| Realty Income Corp |
| ( O ) |
| 0.63% |
| 1,324 |
| Bank of America Corp |
| ( BAC ) |
| 0.57% |
| 1,196 |
| Gladstone Investment |
| ( GAIN ) |
| 0.55% |
| 1,163 |
| Daimler |
| ( OTCPK:MBGAF ) |
| 0.55% |
| 1,160 |
| Stryker |
| ( SYK ) |
| 0.51% |
| 1,068 |
| Brookfield Renewable Partners |
| ( BEP ) |
| 0.50% |
| 1,054 |
| The Coca-Cola Co |
| ( KO ) |
| 0.50% |
| 1,051 |
| Gladstone Commercial Corporation |
| ( GOOD ) |
| 0.49% |
| 1,044 |
| Unilever NV ADR |
| ( UL ) |
| 0.46% |
| 978 |
| Gladstone Capital |
| ( GLAD ) |
| 0.46% |
| 973 |
| Apple Hospitality REIT |
| ( APLE ) |
| 0.45% |
| 943 |
| Medical Properties Trust |
| ( MPW ) |
| 0.44% |
| 934 |
| 3M Co |
| ( MMM ) |
| 0.42% |
| 881 |
| CVS Health Corp |
| ( CVS ) |
| 0.40% |
| 850 |
| Target Corporation |
| ( TGT ) |
| 0.40% |
| 844 |
| Royal Bank of Canada |
| ( RY ) |
| 0.37% |
| 790 |
| Annaly Capital Management |
| ( NLY ) |
| 0.37% |
| 786 |
| NextEra Energy Partners LP |
| ( NEP ) |
| 0.37% |
| 772 |
| Verizon Communications Inc. |
| ( VZ ) |
| 0.34% |
| 726 |
| Spirit Realty Corporation |
| ( SRC ) |
| 0.32% |
| 686 |
| Antero Midstream Corporation |
| ( AM ) |
| 0.31% |
| 664 |
| AGNC Investment Corporation |
| ( AGNC ) |
| 0.31% |
| 658 |
| Medtronic |
| ( MDT ) |
| 0.30% |
| 644 |
| Sino AG |
| (XTP.F) |
| 0.30% |
| 641 |
| BASF |
| ( OTCQX:BASFY ) |
| 0.29% |
| 616 |
| Dominion Energy Inc |
| ( D ) |
| 0.29% |
| 614 |
| Exxon Mobil Corporation |
| ( XOM ) |
| 0.28% |
| 591 |
| Apollo Commercial Real Est. Finance Inc |
| ( ARI ) |
| 0.27% |
| 570 |
| Canadian Imperial Bank of Commerce |
| ( CM ) |
| 0.27% |
| 567 |
| Vonovia |
| ( OTCPK:VONOY ) |
| 0.26% |
| 552 |
| NextEra Energy |
| ( NEE ) |
| 0.25% |
| 532 |
| Kinder Morgan Inc |
| ( KMI ) |
| 0.22% |
| 473 |
| Pfizer Inc. |
| ( PFE ) |
| 0.19% |
| 409 |
| B&G Foods, Inc. |
| ( BGS ) |
| 0.19% |
| 406 |
| Alibaba Group Holding Ltd |
| ( BABA ) |
| 0.19% |
| 399 |
| Walgreens Boots Alliance Inc |
| ( WBA ) |
| 0.18% |
| 386 |
| Mastercard |
| ( MA ) |
| 0.18% |
| 382 |
| Sixt |
| ( OTC:SXTSY ) |
| 0.17% |
| 354 |
| Omega Healthcare Investors Inc |
| ( OHI ) |
| 0.17% |
| 352 |
| Colgate-Palmolive Company |
| ( CL ) |
| 0.17% |
| 349 |
| BRT Realty Trust |
| ( BRT ) |
| 0.13% |
| 275 |
| Bayer AG |
| ( OTCPK:BAYZF ) |
| 0.12% |
| 252 |
| Owl Rock Capital Corporation |
| ( OBDC ) |
| 0.12% |
| 251 |
| ZIM Integrated Shipping Services |
| ( ZIM ) |
| 0.10% |
| 213 |
| Blue Owl Capital |
| ( OWL ) |
| 0.09% |
| 185 |
| Fresenius SE |
| ( OTCPK:FSNUF ) |
| 0.07% |
| 145 |
| Boeing |
| ( BA ) |
| 0.06% |
| 134 |
| Equitrans Midstream Corporation |
| ( ETRN ) |
| 0.06% |
| 121 |
| Uniti Group Inc |
| ( UNIT ) |
| 0.05% |
| 97 |
| Diversified Healthcare Trust |
| ( DHC ) |
| 0.05% |
| 97 |
| Walt Disney Co |
| ( DIS ) |
| 0.04% |
| 80 |
| Bank of Montreal |
| ( BMO ) |
| 0.04% |
| 75 |
| Newtek Business Services |
| ( NEWT ) |
| 0.03% |
| 73 |
| Fresenius Medical Care |
| ( FMS ) |
| 0.03% |
| 64 |
| The GEO Group Inc |
| ( GEO ) |
| 0.03% |
| 60 |
| Service Properties Trust |
| ( SVC ) |
| 0.02% |
| 36 |
For further details see:
My Dividend Stock Portfolio: New October Dividend Record - 98 Holdings With 23 Buys