GMRE - My Oh My 3 Small-Cap Buys
2023-03-10 07:00:00 ET
Summary
- I'm beginning to see more and more readers on Seeking Alpha chasing yield.
- That's not necessarily a bad thing, especially if you do your homework and research before you buy.
- Today, I will provide a list of three vetted small-cap REITs that yield from 6.1% to 8.6%.
We're up. We're down.
We're back. We're forth.
We're here. We're there.
We're heading toward a recession. We've got a strong enough economy to make it through these complicated times.
It's like a sick and twisted stock market version of the opening of Charles Dickens' A Tale of Two Cities . For every argument made in favor of a pessimistic point of view, there's an easy rebuttal to stay positive. And for every attempt to stay positive, there's an easy counterargument in favor of a pessimistic point of view.
It's really difficult to get a read on anything, which makes it a riskier time to invest by most definitions - mine included. It's just that I'm not nearly as risk-averse - or risk-ridiculous on the other end of the spectrum - as some other people out there.
That's why I'm still more than willing to consider small-cap real estate investment trusts ("REITs"). Now might not seem like the best of times to invest in such "short fry" orders.
But it's hardly the worst of times either.
They Say Time Heals All Wounds, but It Apparently Doesn't Bring Clarity Along the Way
I believe the last time I wrote about small-cap REITs was back in February. February 18 , to be specific, so not even a month ago.
And let's face it… not much has changed in that timespan. We still have no idea what's going on with the economy. For that matter, neither does Fed Chairman Jerome Powell, judging by his remarks on Monday.
Here's CNBC's take on the matter (emphasis added):
"Federal Reserve Chairman Jerome Powell on Tuesday cautioned that interest rates are likely to head higher than central bank policymakers had expected.
"Citing data earlier this year showing that inflation has reversed the deceleration it showed in late 2022, the central bank leader warned of tighter monetary policy ahead to slow a growing economy.
"'The latest economic data have come in stronger than expected, which suggests that the ultimate level of interest rates is likely to be higher than previously anticipated ,' Powell said in remarks prepared for two appearances this week on Capitol Hill. 'If the totality of the data were to indicate that faster tightening is warranted, we would be prepared to increase the pace of rate hikes .'"
In case you haven't been following the last two years of Fed-inflation drama, here's what's obvious to everyone else:
"Those remarks carry two implications: One, that the peak, or terminal, level of the federal funds rate is likely to be higher than the previous indication from the Fed officials. And, two, that the switch last month to a smaller quarter-percentage point increase could be short-lived if inflation data continues to run hot."
With all due respect to Jerome Powell, who seems like a very intelligent man…
So much for reading the signs. Again.
More That Hasn't Changed One Bit
Admittedly, some things have changed to some degree over the last three weeks. Here's where the markets were then and "now" as I'm writing this on March 8:
- S&P 500: 4079.09 vs. 3980.12
- Dow: 33,826.69 vs. 32,680.23
- Nasdaq: 11,144.96 vs. 11,529.16.
I'm not trying to say we're starring in Groundhog Day . But…
There's one more thing I can't see a difference in. To illustrate what I mean, let me quote that other small-cap article from last month. While referencing the wonders of small things, I noted how they can offer bigger wonders as time goes on:
"Take a seed, which is pretty pointless in its initial state. But under the proper conditions, it takes root, sprouts up, and [develops] until it's offering fruit or shade (and definitely oxygen) season after season.
"In the same way, small-cap stocks can make a big impact over time. Better yet, they're cheap to pick up!"
And:
"Your personal portfolio should probably be filled with tried-and-true investments like that. You want a solid core of assets to keep you moving forward in both good times and bad.
"However, small-cap stocks like the ones I'm about to feature can offer amazing riches under the right circumstances. You obviously want to do your research and limit your positions more carefully to protect against the greater risks they present.
"But when they're run by intelligent, ethical management teams that know their spaces and how to work them…
You can find yourself with gains that really could be in the running for "the best."
That's why I have another round to recommend.
Armada Hoffler Properties: Yielding 6.1%
Armada Hoffler Properties, Inc. ( AHH ) is a diversified REIT that develops and acquires office, retail, and multifamily properties. It also provides general construction services to third parties.
Its construction experience includes office buildings, strip malls, apartment complexes, hotels, industrial warehouses, manufacturing facilities, parking garages, and mixed-use properties. To a lesser extent, it engages in mezzanine lending and preferred equity arrangements to invest in development projects.
AHH operates through four business segments:
- Office real estate
- Retail real estate
- Multifamily real estate
- General contracting and services conducted through their taxable REIT subsidiaries (TRS's).
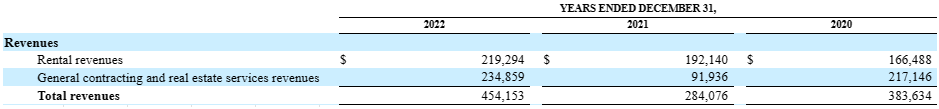
The company breaks down its revenue into two categories: rental revenue and general contracting. While many REITs develop properties in addition to leasing stabilized properties, AHH has a large focus on its development side of the business. Over half its revenue came from general contracting and real estate services in 2022.
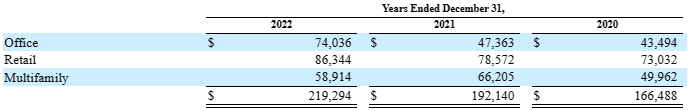
AHH's rental revenue is broken down by property type consisting of office, retail, and multifamily. Its revenue streams change from year to year, but, in general, they are well diversified by property type.
In 2022 retail properties led the way with $86.3 million, followed by office properties with $74 million, and multifamily properties contributing the least at $58.9 million.
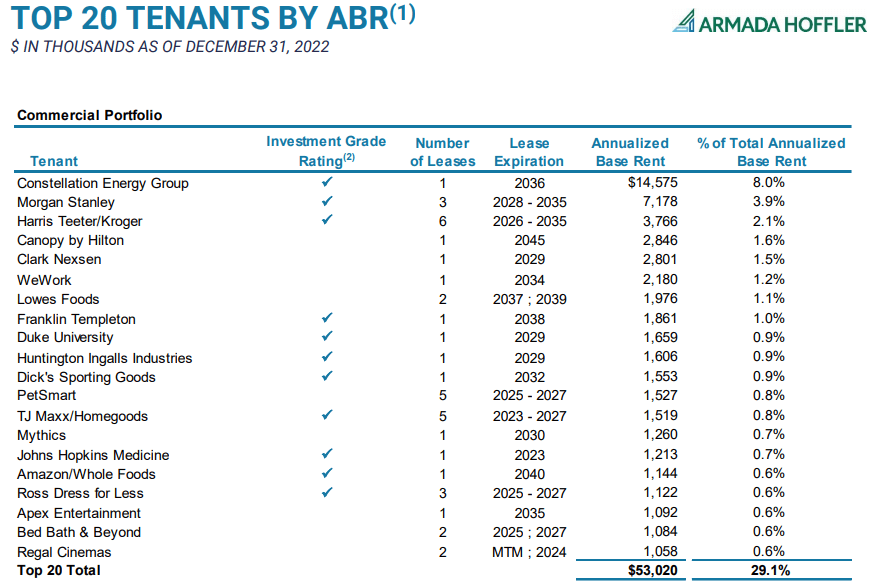
Armada Hoffler is diversified by tenant too. Its top 20 contribute 29.1% of its annual base rent ("ABR"), and only eight make up 1% or more. And out of those, 11 are investment-grade.
With that said, it is somewhat concentrated in its tip-top tenant, since Constellation Energy Group comes in at 8% of ABR.
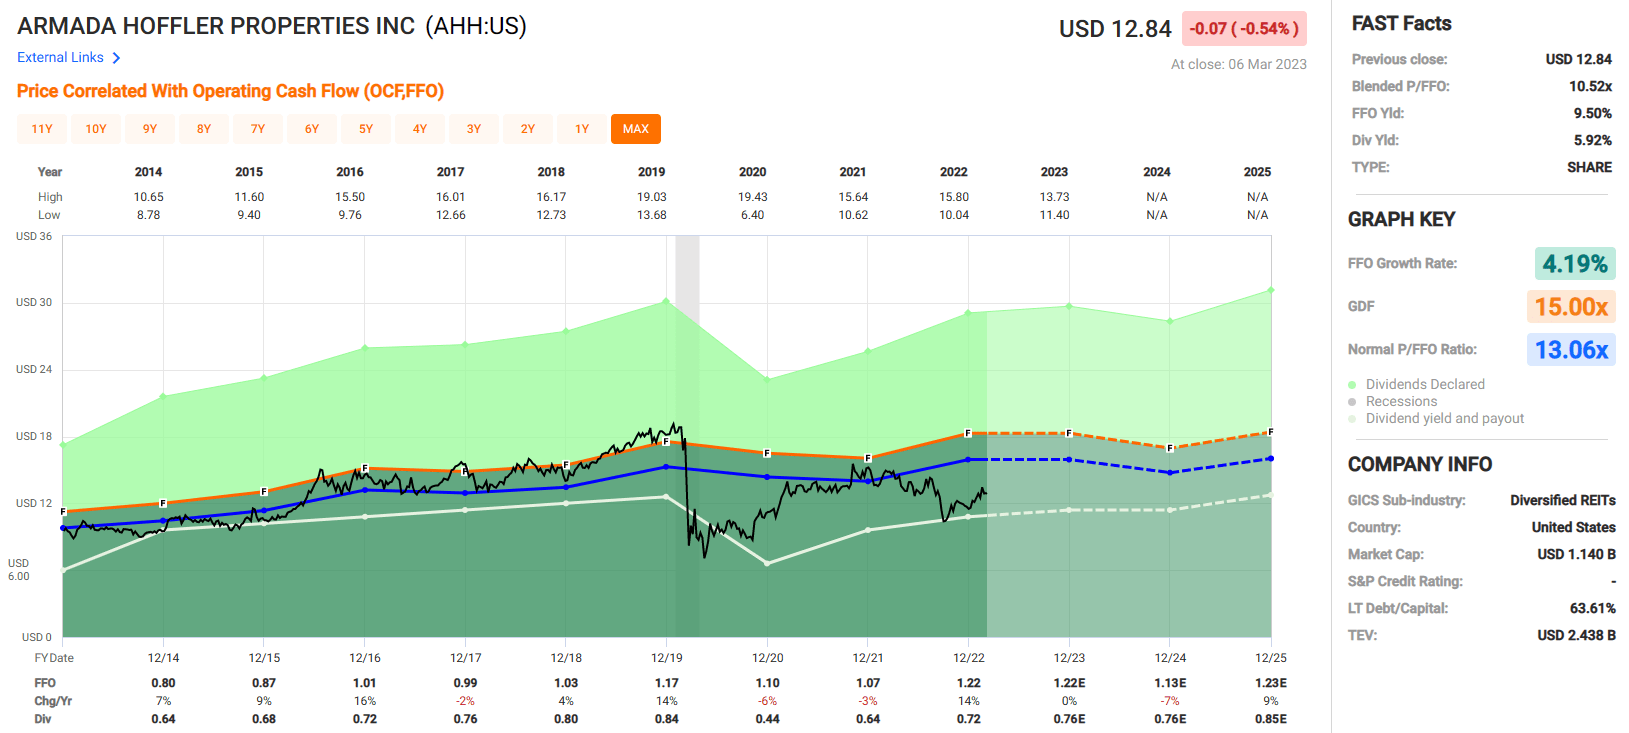
Armada Hoffler reported its fourth quarter and full-year 2022 results on February 14. For the full year:
- Net income was $82.5 million ($0.93 per share) vs. $13.9 million ($0.17 per share) in 2021.
- Funds from operations ((FFO)) increased 15% year-over-year to $106.6 million ($1.21 per share) vs. $85.4 million ($1.05 per share).
- Normalized FFO increased 13% to $107.2 million ($1.22 per share) vs. $87.6 million ($1.08 per share).
Then there was portfolio occupancy, which was at 97% as of December 31, 2022. Office occupancy was 97%, retail was at 98%, and multifamily came in at 96%. Meanwhile, AHH announced its third-party construction backlog was $656.6 million.
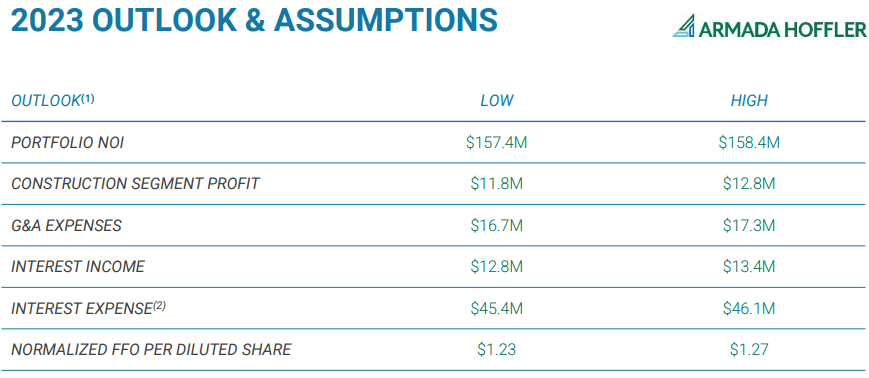
The company initiated 2023 full-year normalized FFO guidance to $1.23-$1.27 per share. And the midpoint of $1.25 represents a 2.5% year-over-year uptick.
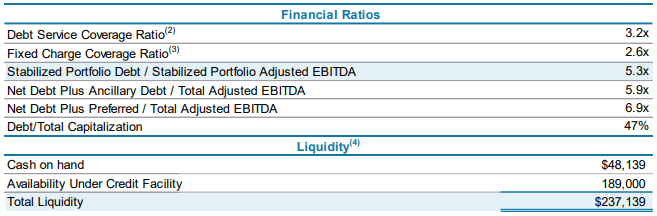
AHH has reasonable debt metrics with a debt service coverage ratio of 3.2x… a fixed-charge coverage ratio of 2.6x… a net debt plus preferred to adjusted earnings before interest, taxes, depreciation, and amortization ((EBITDA)) of 6.9x… and debt as a percentage of total capitalization of 47%.
Its debt is approximately 60% fixed rate and 43% unsecured. Its weighted average interest rate is 3.6%, and its weighted average term to maturity is 4.7 years.
At year's end, the REIT had $48.1 million in cash and $189 million in availability under its credit facility for $237.1 million in total liquidity.
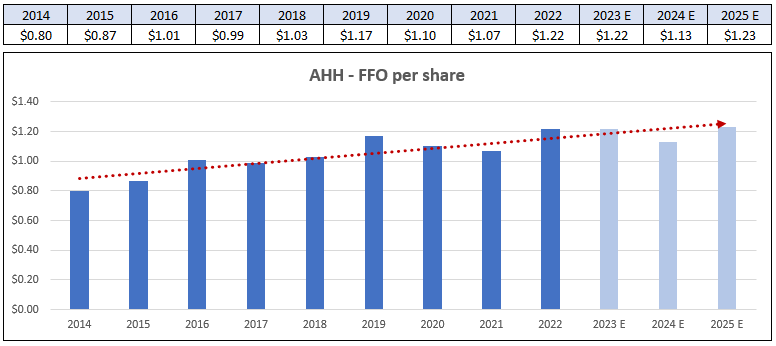
Armada Hoffler's FFO has been choppy, it's true. But it has increased on average by 4.19% annually since 2014.
As for the future, analysts expect no growth this year, a 7% decline in FFO in 2024, and a 9% increase in 2025.
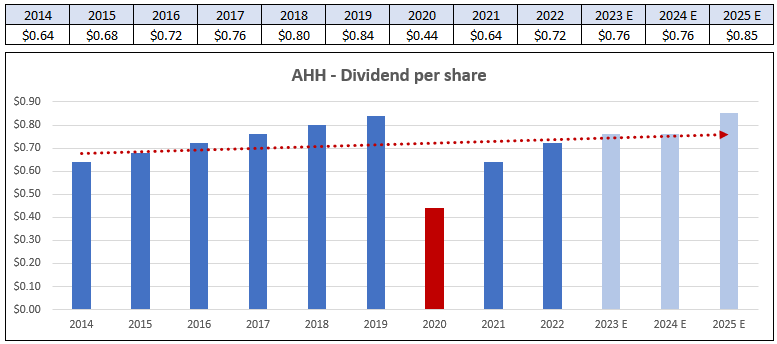
AHH had a nice dividend streak until 2020, when it didn't make a distribution in the second and third quarters in order to preserve liquidity due to the uncertainty caused by the pandemic. While understandable, 2020's $0.44 dividend was also significantly lower than 2019's $0.84.
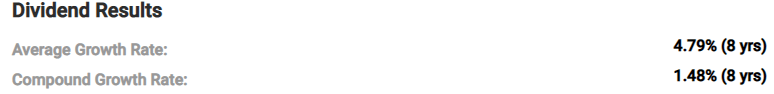
In all, over the last eight years, AHH has shown an average dividend growth rate of 4.79% or a compound growth rate of 1.48%. It currently offers a 5.92% yield that's well covered with a 2022 AFFO payout ratio of 73.47%.
But here's a reason to root for it anyway…
AHH is trading at a price-to-FFO multiple of 10.52x compared to its normal 13.06x. And while FFO and dividend growth have been choppy, they have still grown over the long term.
All things considered, iREIT on Alpha rates Armada Hoffler a Buy.
CTO Realty Growth: Yielding 8.5%
CTO Realty Growth, Inc. ( CTO ) is a diversified REIT that primarily owns retail-based shopping centers, but also some office and mixed-use properties. It also derives revenue from Alpine Income Property Trust, Inc. ( PINE ), a net lease REIT. CTO currently owns an approximate 14% interest in PINE, providing meaningful alignment of interest.
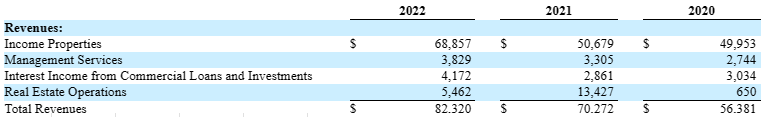
Income properties made up 83.65% of 2022 revenue, while the remaining three categories combined totaled 16.35%. Its interest income revenue comes from three commercial loans and one preferred equity investment. And its real estate operations revenue comes from a portfolio of subsurface mineral interest covering 355,000 surface acres in Florida that are leased to mineral exploration firms.
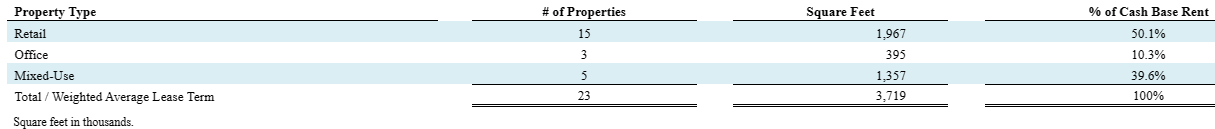
CTO's income properties consist of both single tenant and multi-tenant. It has eight single-tenant properties that cover 436,000 square feet with a weighted average lease term of 5.7 years. And then there are 15 multi-tenant properties that cover 3.3 million square feet with a weighted average lease term of 4.8 years.
In total, CTO has 23 income properties covering 3.7 million square feet with a weighted average remaining lease term of 5.5 years.
CTO Realty Growth, Inc.'s income properties can be broken down further by property type. Retail is its largest category, with 15 properties that make up 50.1% of its cash base rent. Another five mixed-use properties contribute 39.6%, and three office properties make up 10.3%.
CTO was originally founded over 100 years ago as Consolidated-Tomoka Land Co., which primarily owned undeveloped land. At one time, it was one of the largest landowners in Florida.
The company began selling off the undeveloped land for developed properties until, in May 2020, it changed its name to CTO Realty Growth. And it converted to a REIT that December.
On February 23, CTO released its 2022 fourth-quarter and full-year results:
- Net income was a loss of $0.09 per share vs. $1.56 in 2021.
- Core FFO was $1.74 per share vs. $1.29.
- AFFO was $1.83 per share vs. $1.45.
During 2022, CTO invested $314 million in five mixed-use or retail properties covering 1.3 million square feet at a weighted-average going-in cash cap rate of 7.5%. It also sold six properties, totaling a disposition amount of $81.1 million at an exit cap rate of 6.2%.
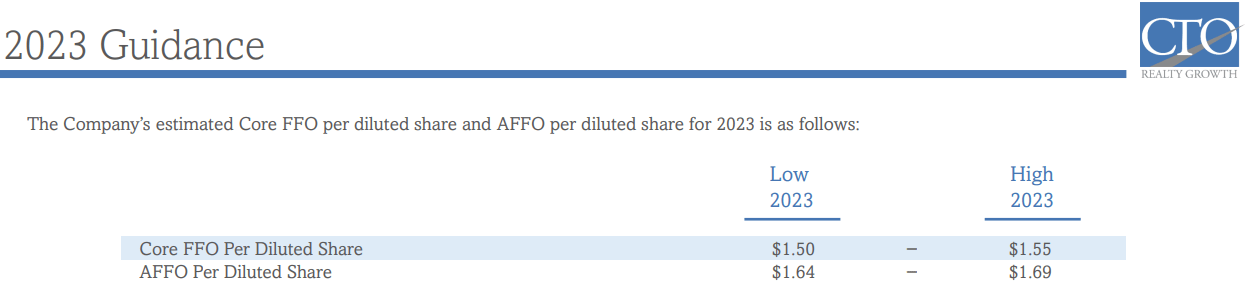
Its 2023 guidance for core FFO of $1.50-$1.55 per share and adjusted FFO ("AFFO") of $1.64-$1.69. The core FFO midpoint of $1.53 represents a 12% decrease, and the AFFO midpoint of $1.67 represents an 8.7% decrease from the 2022 levels.
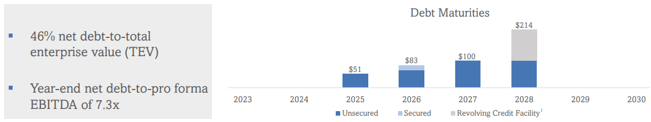
CTO's debt metrics are also a mixed bag. It doesn't have a credit rating by S&P Global. And it has a fairly large amount of debt related to its earnings, with net debt to pro forma EBITDA of 7.3x.
However, it does have a very well-staggered maturity schedule - with nothing due until 2025 - and a reasonable net debt-to-total enterprise value of 46%. Additionally, 75% of its debt is fixed rate and its weighted average interest rate is 3.94%.
The REIT also has sufficient liquidity with $21.2 million in cash and $186.2 million in available capacity on its credit facility as of December 31, 2022.
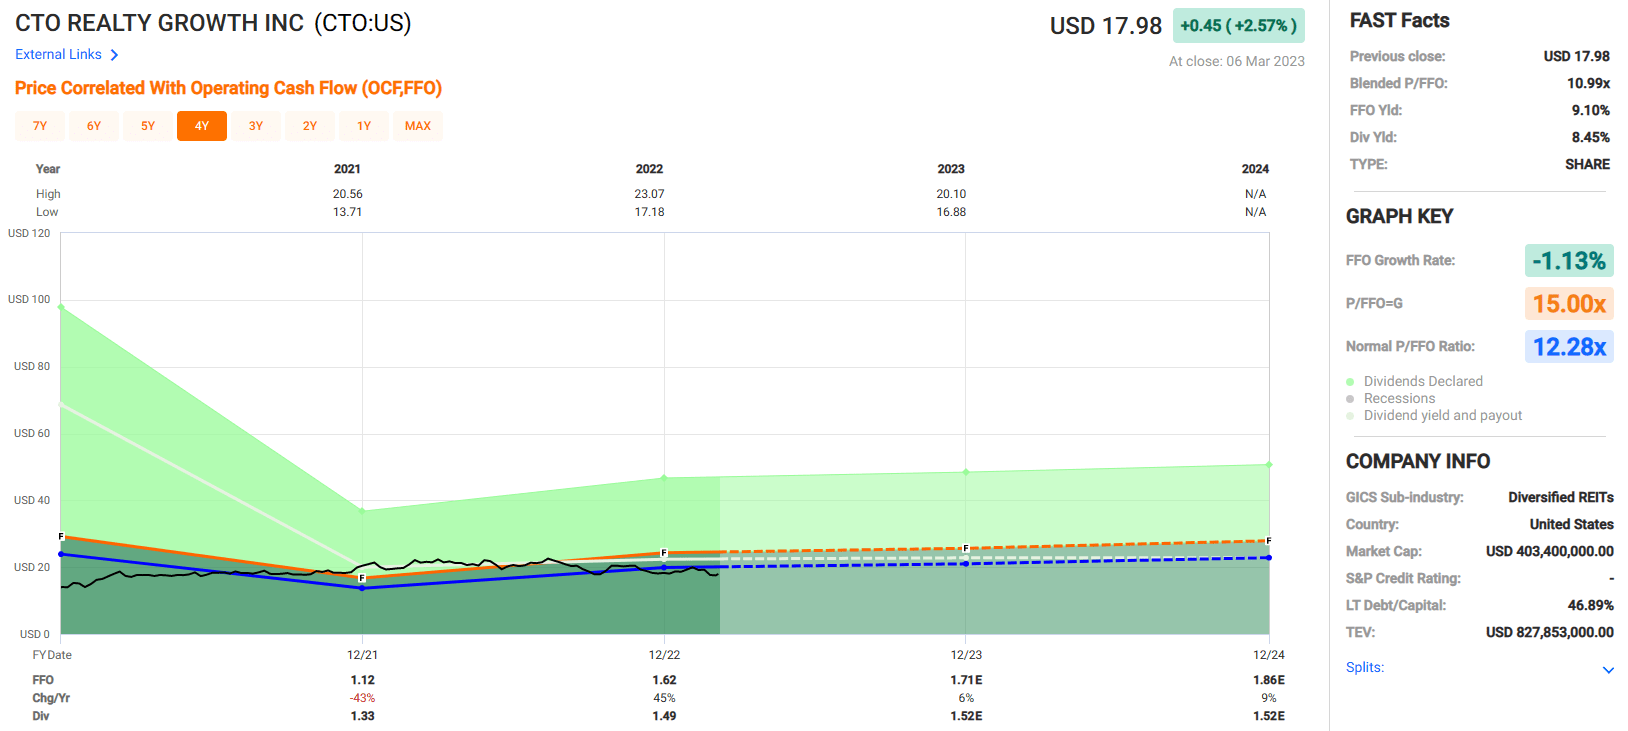
Since CTO converted to a REIT in December 2020, I left off the previous years in the figure below. In 2021, it had $1.12 in FFO per share and $1.62 per share in 2022 - an increase of 45%. FFO growth is expected to normalize in 2023 and 2024, with growth rates of 6% and 9%, respectively.
FAST Graphs (compiled by iREIT)
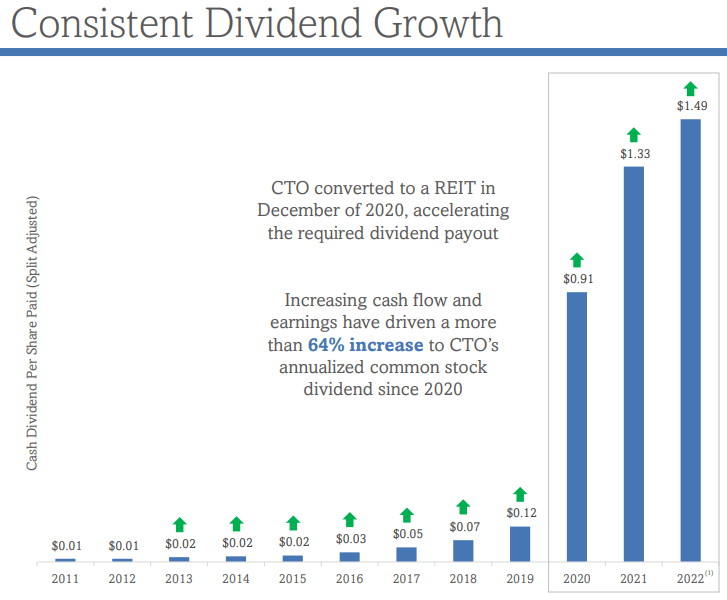
Long-term dividend growth is also hard to gauge since CTO has very little history as a REIT. As shown in the chart below, its dividend payout increased dramatically in 2020, going from $0.12 in 2019 to $0.91.
From 2020 to the present, CTO increased its dividend by 64%. But this isn't indicative of long-term dividend growth, since it was required to increase its dividend payout since becoming a REIT.
CTO pays a dividend yield of 8.45% that is well covered with its 2022 AFFO payout ratio of 81.6%. Its stock trades at a blended FFO multiple of 10.99x, which is a discount to its normal 12.28x.
Once again, it's hard to pin down a long-term growth rate for CTO Realty Growth, Inc.'s earnings and dividend, but from what we do see…
We rate CTO a Speculative Buy.
Global Medical REIT: Yielding 8.6%
Global Medical REIT Inc. ( GMRE ) operates in the healthcare sector. It specializes in net-lease medical office and healthcare facilities that are leased to physician groups and national healthcare systems.
The REIT has 189 buildings in 35 states covering 4.9 million leasable square feet with a weighted average portfolio cap rate of 7.8% and a weighted average lease term of 6.2 years. At the end of 2022, it had a total of 266 tenants, its leased occupancy was 96.5%, and its portfolio rent coverage was 4.4x.
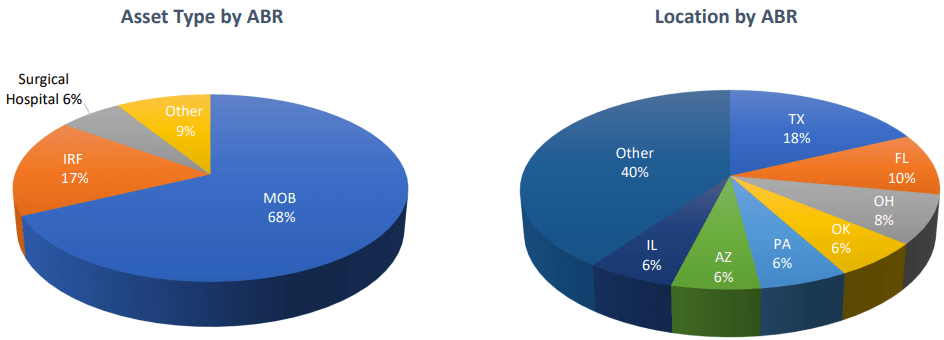
GMRE - Investor Presentation
As a percentage of ABR, medical office buildings ("MOB") lead the way with 68%. Inpatient rehab facilities ("IRF") contribute 17%, surgical hospitals makes up 6%, and the remaining 9% is described as "other."
By location, Texas and Florida are its largest states, contributing 18% and 10% of ABR, respectively.
Global Medical REIT's top 10 tenants are listed below.
GMRE - Investor Presentation, compiled by iREIT
Its weighted average lease term ("WALT") ranges from 0.8 to 15.2 years. And combined, its top 10 tenants have a WALT of approximately seven.
Out of those, six have credit ratings, though only two are investment-grade. Moreover, the smallest tenant in its top 10, Pipeline Health, recently filed for Chapter 11 bankruptcy. But it did emerge from bankruptcy in January 2023 after successfully reorganizing its business.
As part of the bankruptcy process, Pipeline assumed its lease with GMRE for the White Rock Medical Center in Dallas, with some modifications to help it exit bankruptcy.
Global Medical REIT released its fourth-quarter and year-end 2022 financial result on February 28. Full-year results are as follows:
- Revenue increased 18.4% year-over-year to $137.3 million. Much of the increase was due to acquisition activity.
- Net income was $13.3 million ($0.20 per share) vs. $11.8 million ($0.19 per share) in 2021.
- FFO was $64 million ($0.92 per share) in 2022, compared to $58.2 million ($0.90 per share).
- AFFO was $68 million ($0.98 per share) in 2022 vs. $61.4 million ($0.95 per share).
As for the just-mentioned acquisitions, it completed 14 totaling 583,253 leasable square feet for $148.9 million with a weighted average cap rate of 7.4%. And it sold a medical office building for $17.9 million in 2022.
There was no 2023 guidance provided in their earnings release.
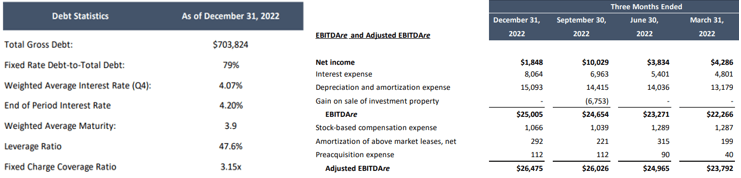
GMRE has reasonable debt metrics. Adding up the adjusted EBITDAre for the four quarters in 2022 gives us a total of $101,258,000 vs gross total debt of $703,824,000 for a gross debt to adjusted EBITDAre of 6.95x. Their weighted average interest rate in the fourth quarter was 4.07% and their weighted average term to maturity is 3.9 years. Almost 80% of their debt is fixed rate and they have a fixed charge coverage ratio of 3.15x.
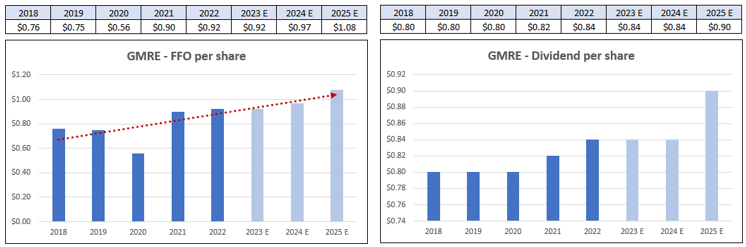
Since 2018, GMRE has a blended average FFO growth rate of 9.05%. FFO per share fell sharply in 2020 - from $0.75 to $0.56 per share - but then rebounded in 2021 to $0.90 per share. Analysts don't expect any FFO growth in 2023 but project a 5% increase in 2024 and an 11% increase in 2025.
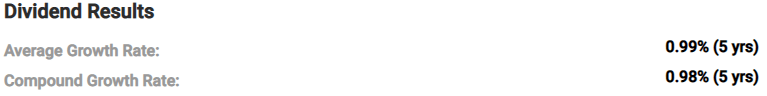
Its dividend, however, is another story - and not in the best of ways. Over the last five years, GMRE has an average dividend growth rate of under 1% . So hardly attractive.
From 2018 to 2020, it remained at $0.80 per share. And while the REIT raised it to $0.84 in 2022, analysts expect it to remain at that level until 2025.
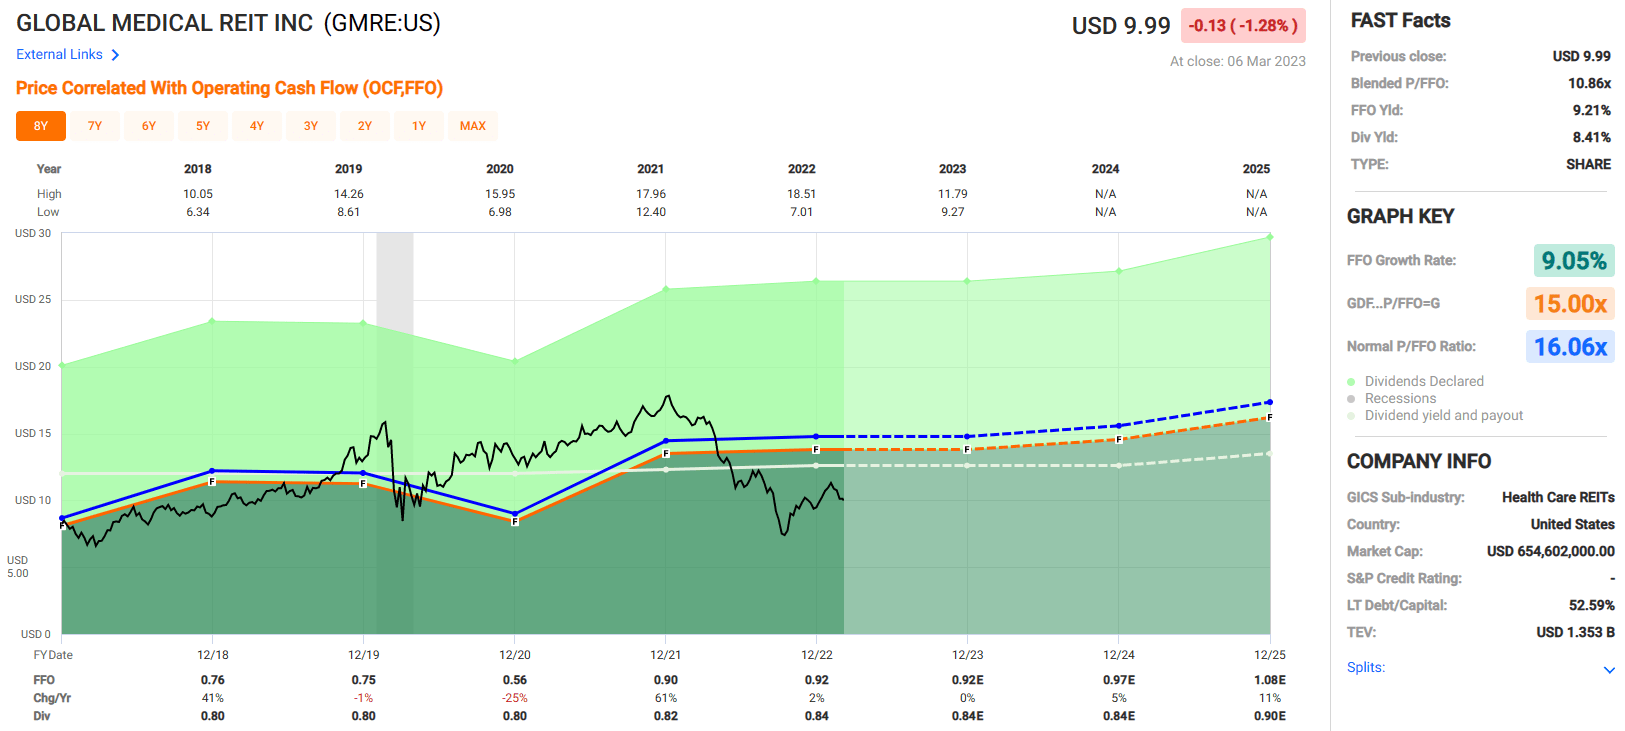
Currently, GMRE is trading at a p/FFO multiple of 10.86x, which compares very favorably to its normal 16.06x. It pays an 8.41% dividend yield that's covered by a 2022 AFFO payout ratio of 85.71%.
My concerns with GMRE center around its debt levels, the current struggles facing the healthcare industry, and its dividend growth rate. With that said, at this price, a patient investor could be rewarded nicely… just as long as he or she can bear probable near-term volatility.
At iREIT, we rate Global Medical REIT a Spec Buy.
Due Diligence!
Over the years, our team has developed an excellent track record for selecting small-cap REITs, and I credit much of the success to careful due diligence.
I know this sounds crazy, but just because a company is structured as a REIT does not make it safe. Over the last decade, I have seen quite a few REIT managers trying to sell their shiny new toys to unsuspecting retail investors, via financial engineering (high payout ratios), high leverage, or, in one case - a Ponzi scheme.
For these reasons, we spend considerable time underwriting a small-cap REIT and meeting with management. For example, I interviewed the AHH CEO, Lou Haddad, today (before publishing this article). Based upon the interview and our research to date, we upgraded Armada Hoffler to a BUY.
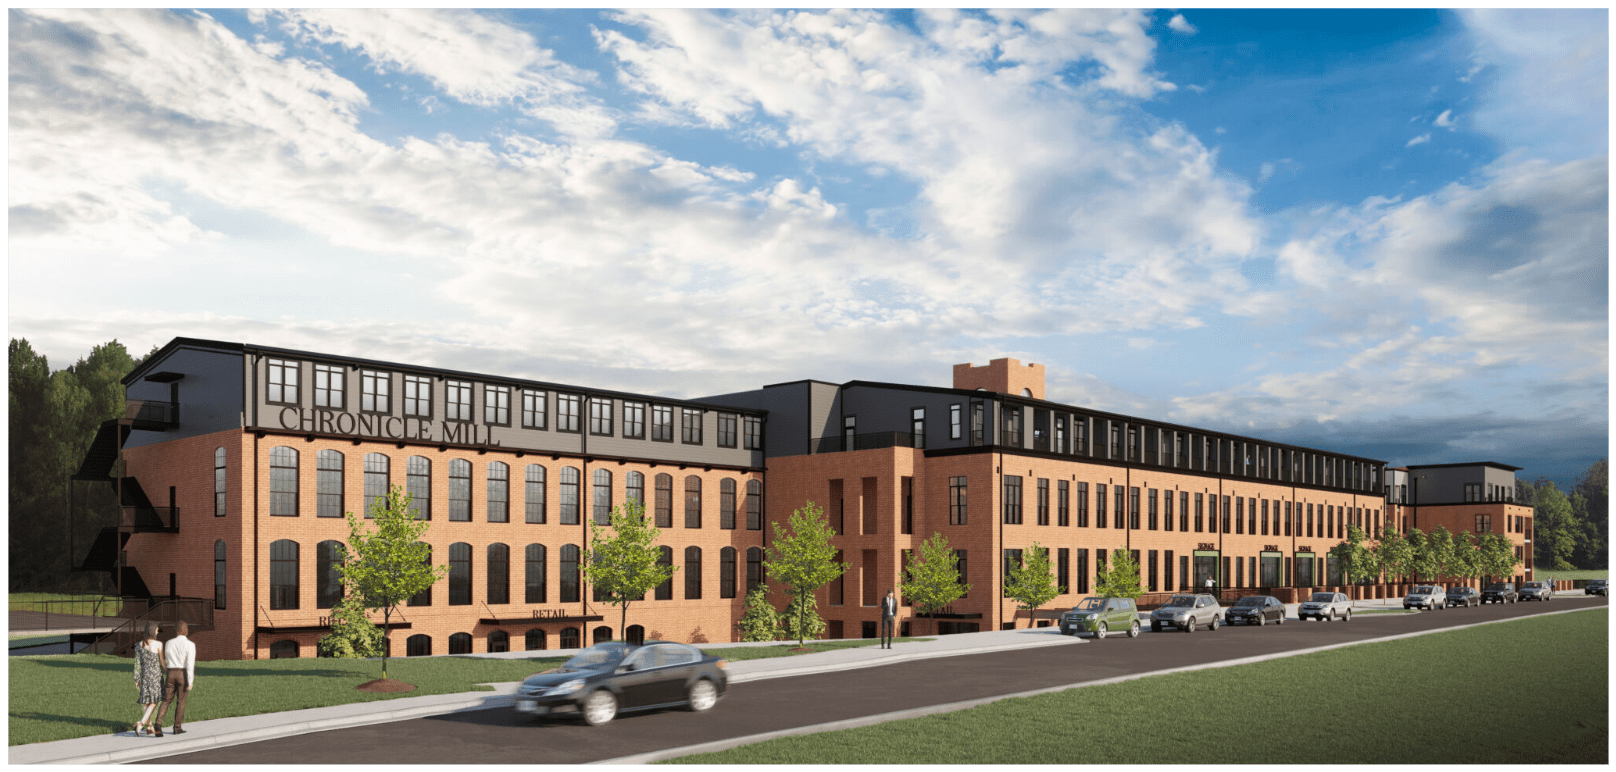
Next week, I plan to visit an AHH property in Belmont, North Carolina to conduct a boots-on-the-ground article/video. Our members at iREIT on Alpha enjoy these interviews (videos) because they get to see first-hand the value of the real estate.
Earliest this week I interviewed Farmland Partners' (FPI) CEO, and next week I plan to interview the CEO of CTO, John Albright - our team has conducted hundreds of interviews which demonstrates the depth of sophisticated of our REIT research platform. Future C-suite interviews include the following REITs:
- NewLake Capital ( OTCQX:NLCP )
- Chicago Atlantic ( REFI )
- Agree Realty ( ADC )
- Arbor Realty ( ABR )
- Spirit Realty ( SRC )
- Hannon Armstrong ( HASI )
- Iron Mountain ( IRM )
- Safehold ( SAFE )
- STAG Industrial ( STAG )
- UMH Properties ( UMH )
- National Storage ( NSA )
- NETSTREIT ( NTST )
- Postal Realty ( PSTL )
- Sachem Capital ( SACH ).
At the end of the day, we insist on due diligence and providing readers with all resources to make the best possible investment decisions. As always, thank you for reading and for the opportunity to be of service.
For further details see:
My Oh My, 3 Small-Cap Buys