TFC - My Top 10 High Yield Dividend Stocks For April 2023
2023-04-03 11:02:23 ET
Summary
- I present my top 10 High Yield dividend stocks that are poised to offer strong future returns.
- The annualized rate of return for this watchlist is 14.14% over the past 29 months.
- The top 10 stocks for March returned 0.50% last month, outperforming VYM that posted a loss of 0.60% but trailing SPY that returned 3.71%.
- Since inception, the watchlist trails VYM by 1.88% but is beating SPY by 2.59%, on an annualized basis.
Market Recap
2023 has been a mixed year for stock market returns to say the least. The year started off on a bright note but last year's volatility quickly came roaring back in February. March was a continuation of the prior month and had it not been for a strong last week the month would have ended red for most broad equity indices. The SPDR S&P 500 Trust ETF ( SPY ) posted a gain of 3.71% in March and is up 7.47% year-to-date. Vanguard's High Dividend Yield ETF ( VYM ) fell by 0.60% in March and is down 1.82% year-to-date. High yield strategies are no longer enjoying the favorable returns we saw in 2022. My watchlist managed to pull out a positive month in March, adding 0.50%, and it is doing just fine on the year, up 6.31% year-to-date.
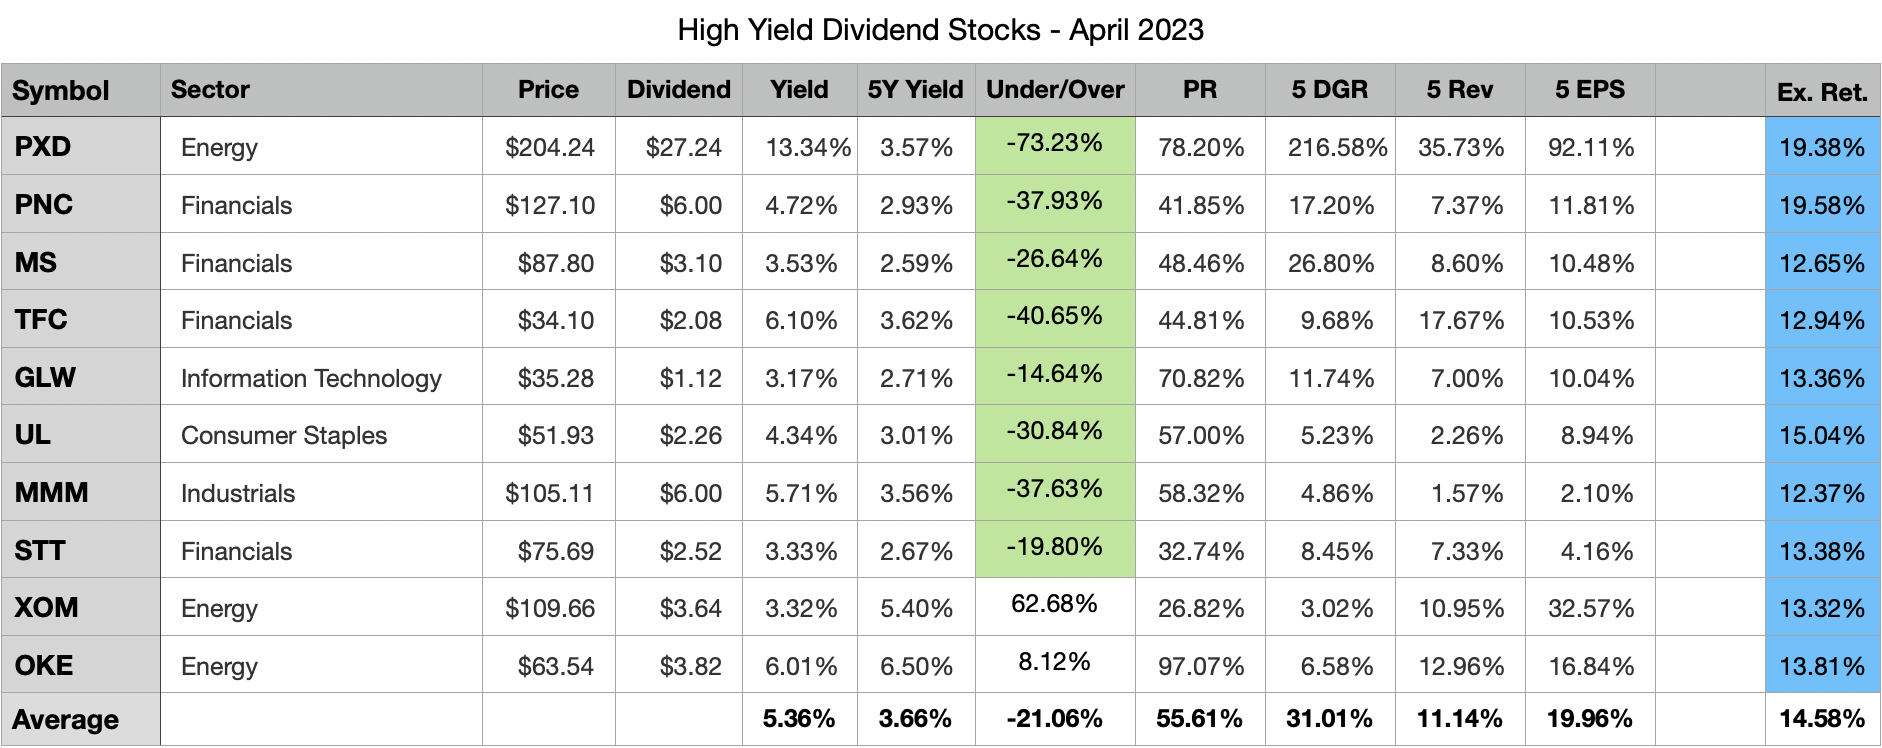
The main purpose of a high dividend yield portfolio is not to outperform the broad market but to generate a passive income stream that is relatively safe, reliable, and one that can grow in the future. The top 10 stocks on my watchlist for April 2023, collectively, offer a 5.36% dividend yield that is more than double the dividend yield of the S&P 500. These 10 stocks have also grown their dividends at a historical rate of 31.01% per year during the last five years. Collectively, all 10 stocks appear to be potentially about 21% undervalued right now based on dividend yield theory.
The best way to create a strong high yield dividend portfolio is with a buy-and-hold strategy. This strategy forces you to think about the stocks you decide to invest your capital into as the plan is to hold the positions indefinitely. Applying this approach over the long term while focusing on potentially undervalued stocks allows investors to generate alpha through capital appreciation. While this may not pan out for every position, diversifying your high-yield portfolio across 20 or more unique stocks will increase the odds of picking up shares of certain stocks when they are trading for bargain prices. The beauty of a long-term outlook is time; you can sit back and wait for the valuation to revert to historical norms, all the while collecting a generous passive income stream.
Watchlist Criteria
Creating the high yield watchlist, I had four areas of interest that I focused on: basic criteria, safety, quality, and stability. First off, the basic criterion aims to narrow down the list of stocks to those that pay a dividend, offer a yield above 2.75%, and trade on the NYSE and NASDAQ. The next set of criteria focuses on safety because that is a crucial part of a high yield investing strategy. The filter excludes companies with payout ratios above 100% and companies with negative 5-year dividend growth rates. Another level of safety can be associated with larger companies; therefore, the watchlist narrows in on stocks with a market cap of at least $10 billion. The next set of criteria set out to narrow down the list to include higher quality businesses.
The three filters for quality are: a wide or narrow Morningstar moat, a standard or exemplary Morningstar stewardship, and an S&P quality rating of B+ or higher. A Morningstar moat rating represents the company's sustainable competitive advantage, the main difference between a wide and narrow moat is the duration that Morningstar expects that advantage to last. Companies with a wide moat are expected to maintain their advantage for the next 20 years, whereas companies with a narrow moat are expected to maintain their advantage for the next 10 years. The Morningstar stewardship evaluates the management team of a company with respect to shareholders' capital.
The S&P quality rating evaluates a company's earnings and dividend history. A rating of B+ or higher is associated with above-average businesses. The last set of criteria focuses on the stability of a company's top-line and bottom-line growth. The filter eliminates companies with negative 5-year revenue or earnings per share growth rate. I believe a company that is growing both their top-line and bottom-line has the ability to provide growth to its investors in the future.
All of the stocks that pass the initial screener criteria (46 this month) are then ranked based on quality and valuation. Further, I sort the stocks in descending order based on the best combination of quality and value and select the top 10 stocks that are forecasted to have at least a 12% annual long-term return.
April 2023 Watchlist
Here is the watchlist for April 2023. There are six changes from the prior month: Best Buy ( BBY ), CMS Energy ( CMS ), EOG Resources (EOG), Enterprise Products Partners ( EPD ), Texas Instruments ( TXN ) and Verizon ( VZ ) drop off and are replaced by 3M Company ( MMM ), Morgan Stanley ( MS ), ONEOK, Inc. ( OKE ), State Street ( STT ), Truist Financial ( TFC ) and Exxon Mobil ( XOM ). The data shown in the image below is as of 3/31/23.
8 out of the 10 selected stocks this month appear to be potentially undervalued based on dividend yield theory.
The expected rate of return shown in the last column is computed by taking the current dividend yield plus a return to fair value over the next 5 years and a discounted long-term earnings forecast.
Please keep in mind that my return forecasts are based on assumptions and should be viewed as such. I am not expecting that these 10 companies will hit the forecasted returns. What I do expect is that these 10 companies have the potential to offer better returns during the next 5 years compared to the 36 high yield stocks that passed my initial filters but ranked worse in quality and valuation.
Past Performance
The top 10 list for March did not perform too well, collectively the chosen stocks gained 0.50%. This was 1.1% better than VYM but 3.21% worse than SPY. The main culprit was the exposure to banks that struggled during March following the fallout from Silicon Valley Bank and Signature Bank. Even with this minor setback the top 10 list is off to a great start this year and will look to redeem itself from a not-so-great showing in 2022. Since inception, which was 29 months ago, the watchlist trails VYM by 1.88% but is outpacing SPY by 2.59%.
I do not expect that this watchlist will beat VYM or SPY every month. However, I believe that a buy-and-hold investing approach leveraging the stocks presented on this watchlist will generate long-term alpha compared to the broad market. I also have a personal target rate of return of 12% that I believe will be attained by this watchlist when measured over long periods of time.
Following February, the long-term annualized rate of return for the watchlist shrunk from 14.43% to 14.14%. The 2 years of history I have measured thus far is a long period of time but I would really like to have 5 or 10 years of results before I start passing more judgment.
| Date |
| Watchlist |
| ALL |
| VYM |
| SPY |
| 6 month |
| 15.10% |
| 11.70% |
| 13.00% |
| 15.60% |
| 3 month |
| 6.31% |
| 1.17% |
| -1.82% |
| 7.47% |
| 1 month |
| 0.50% |
| -1.39% |
| -0.60% |
| 3.71% |
| YTD |
| 6.31% |
| 1.17% |
| -1.82% |
| 7.47% |
| Since Inception |
| 37.66% |
| 44.28% |
| 43.20% |
| 30.22% |
| Annualized |
| 14.14% |
| 16.38% |
| 16.02% |
| 11.55% |
Individual watchlist returns for March 2023 were:
- ((TXN)) +8.49%
- ( PXD ) +4.62%
- ((CMS)) +4.09%
- ( UL ) +4.01%
- ( GLW ) +3.92%
- ((EOG)) +2.42%
- ((EPD)) +1.45%
- ((VZ)) +0.21%
- ((BBY)) -4.68%
- ( PNC ) -19.52%
Top 5 Stocks by total return since joining the watchlist:
- ( PFG ) +107.69% (29 months)
- ( GD ) +83.29% (29 months)
- ( PGR ) +67.75% (26 months)
- ( BMO ) +63.65% (29 months)
- ( MRK ) +59.73% (23 months)
Top 5 Stocks by Average Monthly return since joining the watchlist:
- ( FDX ) +7.67% (6 months)
- ( SWKS ) +5.78% (6 months)
- ((PXD)) +4.62% (1 month)
- ((UL)) +4.01% (1 month)
- ((GLW)) +3.92% (1 month)
In total there have been 74 unique high yield dividend stocks that have appeared in the top 10 list during the past 2 years. Out of these 74 unique stocks 57 have a positive total return since first appearing on the top 10 list. The average total return for these 57 stocks is 29.30%. The average loss for the 17 stocks that have negative total returns is -18.65%. Here are all 74 stocks, their total return since inception and the number of months since they first appeared in the top 10 list.
| Symbol |
| Since Inception |
| Count |
| PFG |
| 107.69% |
| 29 |
| GD |
| 83.29% |
| 29 |
| PGR |
| 67.75% |
| 26 |
| BMO |
| 63.65% |
| 29 |
| MRK |
| 59.73% |
| 23 |
| CSCO |
| 55.86% |
| 29 |
| FDX |
| 55.81% |
| 6 |
| AVGO |
| 49.38% |
| 23 |
| GIS |
| 48.87% |
| 20 |
| TD |
| 48.06% |
| 29 |
| RY |
| 47.04% |
| 29 |
| PEP |
| 46.47% |
| 29 |
| LMT |
| 44.66% |
| 29 |
| JPM |
| 41.62% |
| 29 |
| SWKS |
| 40.06% |
| 6 |
| BK |
| 40.06% |
| 29 |
| SRE |
| 39.92% |
| 25 |
| CVS |
| 39.86% |
| 29 |
| STT |
| 38.49% |
| 29 |
| PAYX |
| 37.89% |
| 26 |
| CPB |
| 37.85% |
| 18 |
| BNS |
| 34.11% |
| 29 |
| SO |
| 33.80% |
| 29 |
| PM |
| 30.27% |
| 25 |
| EPD |
| 28.36% |
| 20 |
| ATO |
| 28.29% |
| 16 |
| CM |
| 27.11% |
| 29 |
| K |
| 25.69% |
| 25 |
| MTB |
| 24.31% |
| 29 |
| TXN |
| 23.67% |
| 9 |
| RCI |
| 22.90% |
| 29 |
| XEL |
| 22.62% |
| 25 |
| SNA |
| 22.51% |
| 14 |
| EVRG |
| 21.26% |
| 29 |
| NTRS |
| 20.77% |
| 29 |
| AMGN |
| 20.33% |
| 29 |
| CMS |
| 20.19% |
| 25 |
| CMI |
| 20.18% |
| 13 |
| HBAN |
| 20.02% |
| 29 |
| TRP |
| 14.34% |
| 29 |
| DTE |
| 12.80% |
| 29 |
| DRI |
| 11.91% |
| 20 |
| QSR |
| 11.50% |
| 19 |
| WEC |
| 10.34% |
| 27 |
| BLK |
| 10.24% |
| 11 |
| KMB |
| 9.99% |
| 26 |
| HD |
| 9.72% |
| 9 |
| FAST |
| 7.43% |
| 2 |
| CMCSA |
| 6.46% |
| 7 |
| PXD |
| 4.62% |
| 1 |
| UL |
| 4.01% |
| 1 |
| GLW |
| 3.92% |
| 1 |
| MDT |
| 3.81% |
| 4 |
| LNT |
| 3.30% |
| 29 |
| EOG |
| 2.42% |
| 1 |
| USB |
| 1.66% |
| 29 |
| VZ |
| 1.35% |
| 4 |
| CLX |
| -1.36% |
| 19 |
| AMT |
| -3.40% |
| 6 |
| MS |
| -3.96% |
| 20 |
| UPS |
| -4.66% |
| 13 |
| TFC |
| -10.70% |
| 29 |
| BEN |
| -14.75% |
| 15 |
| PARA |
| -15.36% |
| 29 |
| BBY |
| -18.50% |
| 15 |
| PNC |
| -19.52% |
| 1 |
| INTC |
| -19.77% |
| 29 |
| TROW |
| -22.97% |
| 14 |
| DLR |
| -23.20% |
| 13 |
| BX |
| -27.68% |
| 12 |
| MMM |
| -27.74% |
| 29 |
| HAS |
| -30.59% |
| 29 |
| CMA |
| -34.53% |
| 24 |
| AAP |
| -38.38% |
| 13 |
Buy-And-Hold Portfolios
The buy-and-hold [B&H] portfolios are a more useful measure of how a long-term investing approach utilizing this watchlist could perform. With the new year I also have a new B&H portfolio, in total there are 3 that I am tracking now. Each B&H portfolio invests an equal amount each month into all 10 chosen high yield stocks, the positions are never sold and all dividends are reinvested back into the issuing stock.
Here's a quick breakdown of how each portfolio is performing.
The 2021 B&H portfolio has now been around for more than 2 full years. It fell 2.92% in March, coming up short of both VYM and SPY. The exposure to banking stocks was the culprit of the below average return last month. Despite the poor return the portfolio maintains a positive 0.17% year-to-date return. On an annualized basis, the portfolio has a return of 11.03% compared to 9.78% for VYM and 5.68% for SPY.
| TOTAL |
| Cumulative |
| 2021 |
| 2022 |
| 2023 |
| Annualized |
| 2021 B&H |
| 26.54% |
| 32.97% |
| -4.99% |
| 0.17% |
| 11.03% |
| VYM |
| 23.36% |
| 26.21% |
| -0.45% |
| -1.82% |
| 9.78% |
| SPY |
| 13.24% |
| 28.76% |
| -18.16% |
| 7.47% |
| 5.68% |
The portfolio is made up of 56 unique high yield dividend stocks. Below is a table of all of the positions, the cumulative return for each component and the allocation as of March 31, 2023.
| Symbol |
| Return |
| Alloc. |
| AAP |
| -34.43% |
| 1.89% |
| AMGN |
| 12.20% |
| 4.45% |
| AMT |
| -2.02% |
| 0.71% |
| ATO |
| 28.29% |
| 0.46% |
| AVGO |
| 39.35% |
| 3.01% |
| BBY |
| -0.20% |
| 5.40% |
| BEN |
| -14.75% |
| 0.31% |
| BK |
| 13.40% |
| 0.41% |
| BLK |
| 8.91% |
| 2.36% |
| BMO |
| -7.99% |
| 0.99% |
| BX |
| -10.32% |
| 2.26% |
| CMI |
| 20.18% |
| 0.43% |
| CMA |
| -37.40% |
| 0.68% |
| CMCSA |
| 12.83% |
| 1.63% |
| CMS |
| 5.46% |
| 1.14% |
| CSCO |
| 4.08% |
| 0.75% |
| DLR |
| -26.04% |
| 1.33% |
| DRI |
| 17.98% |
| 2.98% |
| DTE |
| 4.70% |
| 1.13% |
| EOG |
| 2.42% |
| 0.37% |
| EPD |
| 9.14% |
| 2.36% |
| EVRG |
| 5.08% |
| 1.89% |
| FAST |
| 7.43% |
| 0.39% |
| FDX |
| 50.07% |
| 1.08% |
| GD |
| 62.34% |
| 1.17% |
| GLW |
| 3.92% |
| 0.37% |
| HBAN |
| -1.98% |
| 0.35% |
| HD |
| 9.72% |
| 0.40% |
| INTC |
| -0.90% |
| 2.14% |
| JPM |
| 8.20% |
| 0.78% |
| LMT |
| 41.74% |
| 3.58% |
| MDT |
| 1.88% |
| 1.10% |
| MMM |
| -33.37% |
| 4.32% |
| MS |
| 1.60% |
| 5.86% |
| MTB |
| -13.50% |
| 2.49% |
| NTRS |
| 1.51% |
| 1.10% |
| PEP |
| 32.05% |
| 1.90% |
| PFG |
| 30.84% |
| 3.77% |
| PGR |
| 68.96% |
| 1.22% |
| PM |
| 13.20% |
| 3.26% |
| PNC |
| -19.52% |
| 0.29% |
| PXD |
| 4.62% |
| 0.38% |
| QSR |
| 21.34% |
| 4.81% |
| RY |
| 10.78% |
| 2.00% |
| SNA |
| 22.51% |
| 0.44% |
| SWKS |
| 39.46% |
| 1.01% |
| STT |
| 12.76% |
| 1.22% |
| TD |
| -1.74% |
| 3.19% |
| TFC |
| -30.44% |
| 2.01% |
| TROW |
| -6.25% |
| 3.72% |
| TXN |
| 12.18% |
| 2.83% |
| UL |
| 4.01% |
| 0.37% |
| UPS |
| 3.03% |
| 1.86% |
| USB |
| -27.69% |
| 0.78% |
| VZ |
| -1.16% |
| 1.43% |
| PARA |
| -0.20% |
| 1.44% |
The 2022 B&H portfolio performed slightly better in March, losing 1.35%. The portfolio continues to trail VYM by 3.07% and outpace SPY by 4.88% on an annualized basis since inception. I believe the portfolio will catch-up to VYM and offer alpha in the long run.
| TOTAL |
| Cumulative |
| 2022 |
| 2023 |
| Annualized |
| 2022 B&H |
| -6.06% |
| -9.43% |
| 3.71% |
| -4.88% |
| VYM |
| -2.26% |
| -0.45% |
| -1.82% |
| -1.81% |
| SPY |
| -12.05% |
| -18.16% |
| 7.47% |
| -9.76% |
As of month end March, the portfolio is made up of 41 unique high yield dividend stocks. Below is a table of all of the positions, the cumulative return for each component, and the allocation as of March 31, 2023.
| Symbol |
| Return |
| Alloc. |
| AAP |
| -34.43% |
| 3.53% |
| AMGN |
| 11.27% |
| 1.50% |
| AMT |
| -2.02% |
| 1.32% |
| BBY |
| -0.20% |
| 10.07% |
| BEN |
| -14.75% |
| 0.57% |
| BLK |
| 8.91% |
| 4.40% |
| BMO |
| -9.49% |
| 1.22% |
| BX |
| -10.32% |
| 4.22% |
| CMCSA |
| 12.83% |
| 3.04% |
| CMI |
| 20.18% |
| 0.81% |
| CMS |
| 4.09% |
| 0.70% |
| DLR |
| -26.04% |
| 2.49% |
| DRI |
| 33.91% |
| 1.80% |
| EOG |
| 2.42% |
| 0.69% |
| EPD |
| 5.29% |
| 3.54% |
| FAST |
| 7.43% |
| 0.72% |
| FDX |
| 50.07% |
| 2.02% |
| GLW |
| 3.92% |
| 0.70% |
| HD |
| 9.72% |
| 0.74% |
| INTC |
| 4.78% |
| 3.53% |
| LMT |
| 37.32% |
| 0.92% |
| MDT |
| 1.88% |
| 2.06% |
| MMM |
| -23.73% |
| 3.59% |
| MS |
| 2.94% |
| 9.00% |
| MTB |
| -19.37% |
| 0.54% |
| PM |
| 9.44% |
| 0.74% |
| PNC |
| -19.52% |
| 0.54% |
| PXD |
| 4.62% |
| 0.70% |
| QSR |
| 22.18% |
| 5.75% |
| RY |
| -12.80% |
| 0.59% |
| SNA |
| 22.51% |
| 0.82% |
| SWKS |
| 39.46% |
| 1.88% |
| TD |
| -19.90% |
| 1.08% |
| TFC |
| -23.47% |
| 2.06% |
| TROW |
| -6.25% |
| 6.94% |
| TXN |
| 12.18% |
| 5.28% |
| UL |
| 4.01% |
| 0.70% |
| UPS |
| 3.03% |
| 3.47% |
| USB |
| -33.64% |
| 0.89% |
| VZ |
| -1.16% |
| 2.66% |
| PARA |
| 7.57% |
| 2.17% |
The 2023 B&H portfolio was the only one to manage a positive return last month, the portfolio tacked on a gain of 0.34%. It remains 6.62% ahead of VYM but trails SPY by 2.66%.
| TOTAL |
| Cumulative |
| 2023 B&H |
| 4.81% |
| VYM |
| -1.82% |
| SPY |
| 7.47% |
Following March the portfolio now consists of 20 unique dividend stocks. Below is a table of the positions, the cumulative return for each component, and the allocation as of March 31, 2023.
| Symbol |
| Return |
| Alloc. |
| BBY |
| -5.54% |
| 9.39% |
| BMO |
| -0.59% |
| 3.29% |
| CMCSA |
| 9.23% |
| 3.62% |
| CMS |
| 4.09% |
| 3.45% |
| EOG |
| 2.42% |
| 3.39% |
| EPD |
| 4.02% |
| 10.34% |
| FAST |
| 7.43% |
| 3.56% |
| GLW |
| 3.92% |
| 3.44% |
| INTC |
| 25.18% |
| 4.15% |
| MDT |
| 0.91% |
| 6.69% |
| MMM |
| -9.30% |
| 6.01% |
| MS |
| -9.79% |
| 2.99% |
| PNC |
| -19.52% |
| 2.67% |
| PXD |
| 4.62% |
| 3.47% |
| QSR |
| 1.20% |
| 3.35% |
| TFC |
| -19.89% |
| 2.65% |
| TXN |
| 8.95% |
| 10.83% |
| UL |
| 4.01% |
| 3.45% |
| UPS |
| 5.65% |
| 3.50% |
| VZ |
| -1.99% |
| 9.74% |
Two benefits these portfolios offer over VYM and SPY are a higher starting dividend yield and more consistent dividend payment schedules. The 2021 BAH portfolio is performing very well thus far, the 2022 portfolio got off to a slow start but is looking more promising here in 2023, and the 2023 portfolio is off to a pretty decent start.
I believe that a buy-and-hold investing approach is the best strategy for all dividend investors. If you apply this strategy targeting quality companies trading for attractive prices, you should achieve better-than-average results in the long run.
For further details see:
My Top 10 High Yield Dividend Stocks For April 2023