TXN - My Top 10 High Yield Dividend Stocks For November 2023
2023-11-02 08:50:35 ET
Summary
- The market slide continues in October with the SPDR S&P 500 Trust ETF dropping by 2.17%, marking three consecutive months of losses for the fund.
- The top 10 stocks on the watchlist for November 2023 offer a 4.58% dividend yield, more than double the S&P 500.
- My top 10 list of high dividend yield stocks has generated an annualized rate of return of 8.20% since its inception in November 2020.
Market Recap
October marks three consecutive months of negative returns for the SPDR S&P 500 Trust ETF ( SPY ). The ETF fell by 1.63% in August, 4.74% in September and 2.17% in October, with a cumulative decline of approximately 8.33%. Vanguard's High Dividend Yield ETF ( VYM ) has experienced a similar decline of approximately 8.28%. My high yield watchlist finds itself in an even worse decline, falling 4.81% in October and being down 14.21% during the past 3 months. Following October my watchlist was finally pushed into negative territory year-to-date but remains modestly ahead of VYM. Since inception, November 2020, the watchlist has an annualized rate of return of 8.2% which is below my target of 12%.
My watchlist has a bigger focus on growth and therefore tends to underperform when market sentiment is poor but it outperforms when market sentiment is favorable. Over the long term positive market periods last longer than negative market periods, therefore I am optimistic my watchlist will catch-up and surpass both SPY and VYM in the coming months and years.
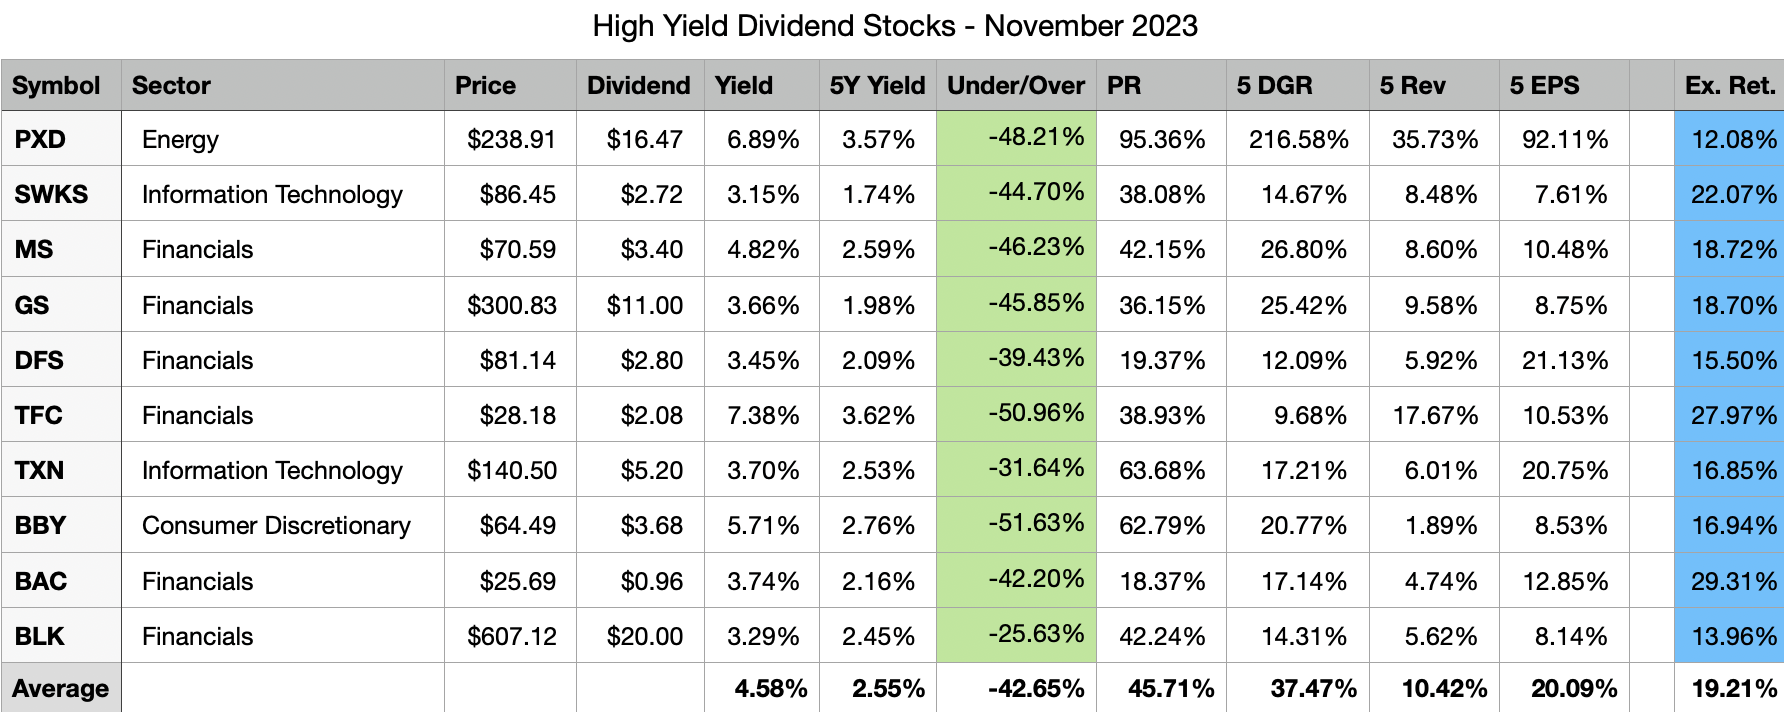
The main purpose of a high dividend yield portfolio is not to outperform the broad market but to generate a passive income stream that is relatively safe, reliable, and one that can grow in the future. The top 10 stocks on my watchlist for November 2023, collectively, offer a 4.58% dividend yield that is more than double the dividend yield of the S&P 500. These 10 stocks have also grown their dividends at a historical rate of 37.47% per year during the last five years. Collectively, all 10 stocks appear to be potentially about 42% undervalued right now based on dividend yield theory.
The best way to create a strong high yield dividend portfolio is with a buy-and-hold strategy. This strategy forces you to think about the stocks you decide to invest your capital into as the plan is to hold the positions indefinitely. Applying this approach over the long term while focusing on potentially undervalued stocks allows investors to generate alpha through capital appreciation. While this may not pan out for every position, diversifying your high-yield portfolio across 20 or more unique stocks will increase the odds of picking up shares of certain stocks when they are trading for bargain prices. The beauty of a long-term outlook is time; you can sit back and wait for the valuation to revert to historical norms, all the while collecting a generous passive income stream.
Watchlist Criteria
Creating the high yield watchlist, I had four areas of interest that I focused on: basic criteria, safety, quality, and stability. First off, the basic criterion aims to narrow down the list of stocks to those that pay a dividend, offer a yield above 2.75%, and trade on the NYSE and NASDAQ. The next set of criteria focuses on safety because that is a crucial part of a high yield investing strategy. The filter excludes companies with payout ratios above 100% and companies with negative 5-year dividend growth rates. Another level of safety can be associated with larger companies; therefore, the watchlist narrows in on stocks with a market cap of at least $10 billion. The next set of criteria set out to narrow down the list to include higher quality businesses.
The three filters for quality are: a wide or narrow Morningstar moat, a standard or exemplary Morningstar stewardship, and an S&P quality rating of B+ or higher. A Morningstar moat rating represents the company's sustainable competitive advantage, the main difference between a wide and narrow moat is the duration that Morningstar expects that advantage to last. Companies with a wide moat are expected to maintain their advantage for the next 20 years, whereas companies with a narrow moat are expected to maintain their advantage for the next 10 years. The Morningstar stewardship evaluates the management team of a company with respect to shareholders' capital.
The S&P quality rating evaluates a company's earnings and dividend history. A rating of B+ or higher is associated with above-average businesses. The last set of criteria focuses on the stability of a company's top-line and bottom-line growth. The filter eliminates companies with negative 5-year revenue or earnings per share growth rate. I believe a company that is growing both their top-line and bottom-line has the ability to provide growth to its investors in the future.
All of the stocks that pass the initial screener criteria (56 this month) are then ranked based on quality and valuation. Further, I sort the stocks in descending order based on the best combination of quality and value and select the top 10 stocks that are forecasted to have at least a 12% annual long-term return.
November 2023 Watchlist
Here is the watchlist for November 2023. There is only one change from the prior month: NextEra Energy ( NEE ) drops out and is replaced by Blackrock ( BLK ). The data shown in the image below is as of 10/31/23.
All of the selected stocks this month appear to be potentially undervalued based on dividend yield theory.
The expected rate of return shown in the last column is computed by taking the current dividend yield plus a return to fair value over the next 5 years and a discounted long-term earnings forecast.
Please keep in mind that my return forecasts are based on assumptions and should be viewed as such. I am not expecting that these 10 companies will hit the forecasted returns. What I do expect is that these 10 companies have the potential to offer better returns during the next 5 years compared to the 46 high yield stocks that passed my initial filters but ranked worse in quality and valuation.
Past Performance
The top 10 list for October performed rather poorly, collectively the 10 chosen stocks were down by 4.81%. This was 2.03% worse than VYM and 2.64% worse than SPY. Year-to-date the watchlist maintains a decent lead on VYM of 2.86%, but trails SPY by a wide margin, 12.75%. Since inception, which was 36 months ago, the watchlist trails VYM by 3.27% and SPY by 2.04%.
I do not expect that this watchlist will beat VYM or SPY every month. However, I believe that a buy-and-hold investing approach leveraging the stocks presented on this watchlist will generate long-term alpha compared to the broad market. I also have a personal target rate of return of 12% that I believe will be attained by this watchlist when measured over long periods of time.
Following October the long-term annualized rate of return for the watchlist decreased from 10.29% to 8.20%. My target rate of return is 12% and this isn't the first time the watchlist has dipped below this threshold. It may dip below this range in the short-term but over a longer period of time I believe it will meet this target.
| Date |
| Top 10 List |
| ALL |
| VYM |
| SPY |
| 1 month |
| -4.81% |
| -3.27% |
| -2.78% |
| -2.17% |
| 3 month |
| -14.21% |
| -11.37% |
| -8.28% |
| -8.33% |
| 6 month |
| -9.71% |
| -8.27% |
| -4.49% |
| 1.27% |
| YTD |
| -2.18% |
| -6.01% |
| -5.04% |
| 10.57% |
| Since Inception |
| 26.67% |
| 34.03% |
| 38.50% |
| 33.98% |
| Annualized |
| 8.20% |
| 10.26% |
| 11.47% |
| 10.24% |
Individual watchlist returns for October 2023 were:
- Bank of America ( BAC ) -3.80%
- Best Buy ( BBY ) -3.81%
- Discover Financial Services ( DFS ) -5.25%
- Goldman Sachs ( GS ) -6.17%
- Morgan Stanley ( MS ) -12.24%
- NextEra Energy ( NEE ) +1.76%
- Pioneer Natural Resources ( PXD ) +4.12%
- Skyworks Solutions ( SWKS ) -12.02%
- Truist Financial ( TFC ) -0.87%
- Texas Instruments ( TXN ) -9.86%
Top 5 performing past and present watchlist stocks in October 2023:
- Progressive ( PGR ) +13.57%
- Lockheed Martin ( LMT ) +11.17%
- Verizon ( VZ ) +10.73%
- General Dynamics ( GD ) +9.87%
- American Tower Group ( AMT ) +9.46%
Top 5 Stocks by total return since joining the watchlist:
- Broadcom ( AVGO ) +98.08% (30 months)
- General Dynamics ( GD ) +97.33% (36 months)
- Principal Financial Group ( PFG ) +92.62% (36 months)
- Progressive ( PGR ) +85.79% (33 months)
- FedEx ( FDX ) +65.46% (13 months)
Top 5 Stocks by Average Monthly return since joining the watchlist:
- FedEx ( FDX ) +3.95% (13 months)
- Pioneer Natural Resources ( PXD ) +2.87% (8 months)
- Broadcom ( AVGO ) +2.30% (30 months)
- General Dynamics ( GD ) +1.91% (36 months)
- Progressive ( PGR ) +1.89% (33 months)
In total there have been 80 unique high yield dividend stocks that have appeared in the top 10 list during the past 36 months. Out of these 80 unique stocks 47 have a positive total return since first appearing on the top 10 list. The average total return for these 47 stocks is 28.74%. The average loss for the 33 stocks that have negative total returns is -18.50%. Here are all 80 stocks, their total return since inception and the number of months since they first appeared in the top 10 list.
| Symbol |
| Since Inception |
| Count |
| AVGO |
| 98.08% |
| 30 |
| GD |
| 97.33% |
| 36 |
| PFG |
| 92.62% |
| 36 |
| PGR |
| 85.79% |
| 33 |
| FDX |
| 65.46% |
| 13 |
| CSCO |
| 58.90% |
| 36 |
| MRK |
| 56.26% |
| 30 |
| JPM |
| 54.49% |
| 36 |
| BMO |
| 44.10% |
| 36 |
| TD |
| 43.02% |
| 36 |
| LMT |
| 41.02% |
| 36 |
| EPD |
| 36.51% |
| 27 |
| PAYX |
| 35.69% |
| 33 |
| BK |
| 34.70% |
| 36 |
| CVS |
| 33.17% |
| 36 |
| PEP |
| 33.03% |
| 36 |
| SO |
| 32.02% |
| 36 |
| SRE |
| 31.82% |
| 32 |
| SNA |
| 29.56% |
| 21 |
| AMGN |
| 29.52% |
| 36 |
| RY |
| 26.95% |
| 36 |
| PXD |
| 25.42% |
| 8 |
| ATO |
| 24.48% |
| 23 |
| PM |
| 22.75% |
| 32 |
| STT |
| 20.49% |
| 36 |
| MTB |
| 19.74% |
| 36 |
| CMCSA |
| 18.43% |
| 14 |
| FAST |
| 18.40% |
| 9 |
| GIS |
| 16.36% |
| 27 |
| EOG |
| 15.04% |
| 8 |
| QSR |
| 13.29% |
| 26 |
| BNS |
| 11.19% |
| 36 |
| CMI |
| 10.41% |
| 20 |
| XEL |
| 9.62% |
| 32 |
| CM |
| 9.15% |
| 36 |
| CMS |
| 8.16% |
| 32 |
| DRI |
| 7.68% |
| 27 |
| HD |
| 7.31% |
| 16 |
| OKE |
| 7.16% |
| 7 |
| HBAN |
| 6.40% |
| 36 |
| TRP |
| 5.08% |
| 36 |
| SWKS |
| 4.25% |
| 13 |
| CPB |
| 3.77% |
| 25 |
| K |
| 2.79% |
| 32 |
| BLK |
| 2.34% |
| 18 |
| DTE |
| 0.97% |
| 36 |
| RCI |
| 0.03% |
| 36 |
| KMB |
| -0.17% |
| 33 |
| EVRG |
| -0.42% |
| 36 |
| DLR |
| -0.79% |
| 20 |
| XOM |
| -1.82% |
| 7 |
| LNT |
| -3.14% |
| 36 |
| VZ |
| -3.20% |
| 11 |
| TXN |
| -3.32% |
| 16 |
| UL |
| -3.45% |
| 8 |
| WEC |
| -3.61% |
| 34 |
| GS |
| -5.48% |
| 5 |
| USB |
| -7.44% |
| 36 |
| MDT |
| -7.64% |
| 11 |
| NTRS |
| -7.85% |
| 36 |
| DFS |
| -8.87% |
| 2 |
| INTC |
| -9.17% |
| 36 |
| NEE |
| -12.73% |
| 2 |
| AMT |
| -13.57% |
| 13 |
| BAC |
| -17.00% |
| 3 |
| GLW |
| -19.79% |
| 8 |
| MS |
| -20.20% |
| 27 |
| BX |
| -22.00% |
| 19 |
| TFC |
| -23.04% |
| 36 |
| PNC |
| -24.77% |
| 8 |
| CLX |
| -24.82% |
| 26 |
| BEN |
| -26.18% |
| 22 |
| BBY |
| -28.67% |
| 22 |
| UPS |
| -29.27% |
| 20 |
| MMM |
| -35.57% |
| 36 |
| TROW |
| -36.88% |
| 21 |
| CMA |
| -38.60% |
| 31 |
| HAS |
| -39.38% |
| 36 |
| PARA |
| -58.44% |
| 36 |
| AAP |
| -73.08% |
| 20 |
Closer Look At New Stock
Here's a closer look at the new stock this month, Blackrock.
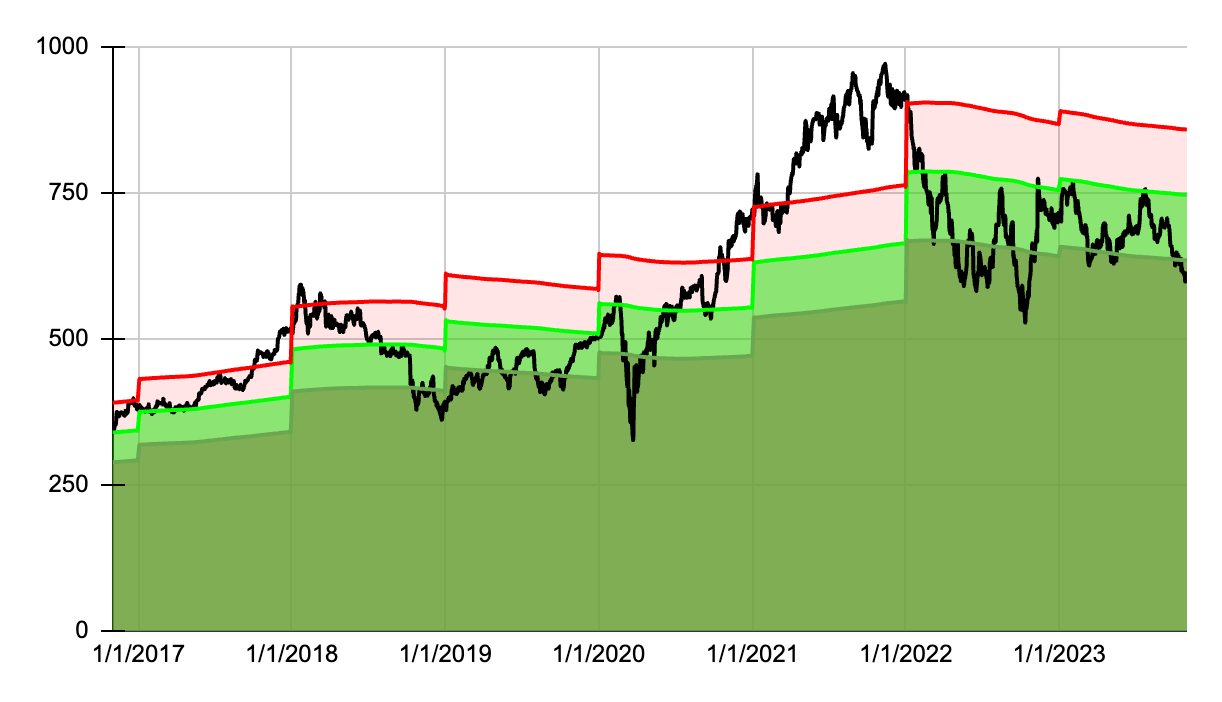
Let's start with the 7-year dividend yield theory chart.
The share price peaked in late 2021 and crashed in early to mid 2022. In the latter part of 2022 and majority of 2023 the price has stagnated in a range of $600-$750 with continued volatility. Dividend yield theory did suggest that the all time high price for Blackrock in 2021 was excessive and that the current price is attractive.
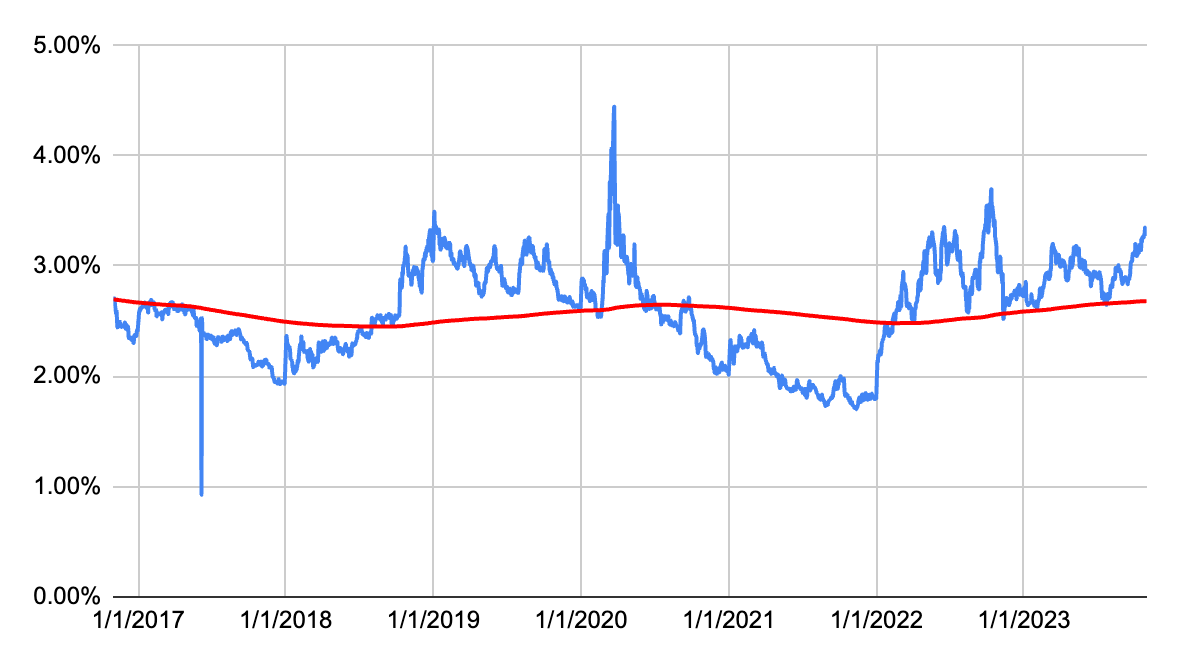
During the last 7 years Blackrock's dividend yield has generally fluctuated between 2%-3%, on occasion moving outside this range. The current dividend yield of approximately 3.25% is historically quite attractive, but not as nice as the yield during the 2020 pandemic lows (4%+).
In the dividend growth department, Blackrock has a pretty decent but mixed history. Out of the past ten years seven have seen double digit dividend growth but the most recent increase in 2023 was the lowest we have ever seen, at just 2.45%. The dividend rate for 2023 in the table below is automatically fed from Finviz.com and may not be truly representative of the actual 2023 dividend paid by the company.
| Year |
| Dividend |
| Growth |
| CAGR |
| 2023 |
| 20.02 |
| 2.56% |
| 2022 |
| 19.52 |
| 18.16% |
| 2.56% |
| 2021 |
| 16.52 |
| 13.77% |
| 10.08% |
| 2020 |
| 14.52 |
| 10.00% |
| 11.30% |
| 2019 |
| 13.20 |
| 9.82% |
| 10.97% |
| 2018 |
| 12.02 |
| 20.20% |
| 10.74% |
| 2017 |
| 10.00 |
| 9.17% |
| 12.26% |
| 2016 |
| 9.16 |
| 5.05% |
| 11.82% |
| 2015 |
| 8.72 |
| 12.95% |
| 10.95% |
| 2014 |
| 7.72 |
| 14.88% |
| 11.17% |
| 2013 |
| 6.72 |
| 12.00% |
| 11.53% |
| 2012 |
| 6.00 |
| 9.09% |
| 11.58% |
| 2011 |
| 5.50 |
| 11.37% |
For further details see:
My Top 10 High Yield Dividend Stocks For November 2023