TXN - My Top 10 High Yield Dividend Stocks For September 2023
2023-09-03 12:09:21 ET
Summary
- August saw a wave of volatility in equity markets, with the SPDR S&P Trust ETF falling by 1.63%.
- My top 10 list of high dividend yield stocks has generated an annualized rate of return of 12.71% since its inception in November 2020.
- The list from August did not perform well, losing 4.93% last month, underperforming both VYM and SPY.
Market Recap
After two solid months of strong returns from equity markets we entered another wave of volatility in August. The SPDR S&P Trust ETF ( SPY ) fell by 1.63% last month but remains up 18.65% year-to-date. Vanguard's High Dividend Yield ETF (VYM) posted a larger loss of 2.39%, pushing its year-to-date return down to just 1.06%. My watchlist for August struggled more as it fell by 4.93%. Following this sour month the year-to-date return for the watchlist falls to 8.4%, well ahead of VYM but considerably worse than SPY. Since inception, November 2020, the watchlist continues to trail SPY by 0.96% and VYM by 1.96%, on an annualized basis.
Since I started tracking this list in November of 2020 it has generated an annualized rate of return of 12.71%. My watchlist has a bigger focus on growth and therefore tends to underperform when market sentiment is poor but it outperforms when market sentiment is favorable. Over the long term positive market periods last longer than negative market periods, therefore I am optimistic my watchlist will catch-up and surpass both SPY and VYM in due time.
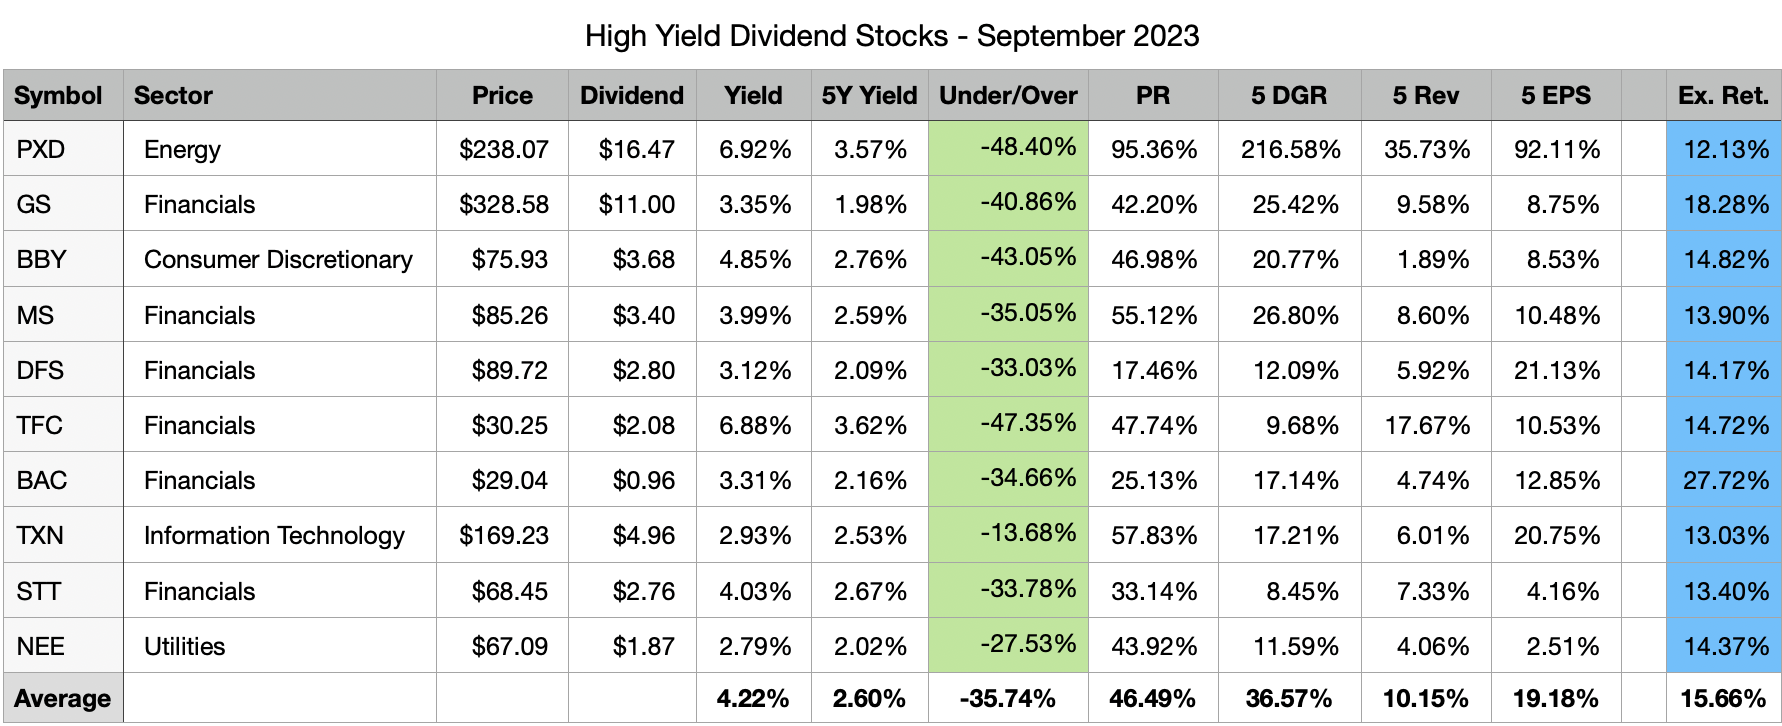
The main purpose of a high dividend yield portfolio is not to outperform the broad market but to generate a passive income stream that is relatively safe, reliable, and one that can grow in the future. The top 10 stocks on my watchlist for September 2023, collectively, offer a 4.22% dividend yield that is more than double the dividend yield of the S&P 500. These 10 stocks have also grown their dividends at a historical rate of 36.57% per year during the last five years. Collectively, all 10 stocks appear to be potentially about 36% undervalued right now based on dividend yield theory.
The best way to create a strong high yield dividend portfolio is with a buy-and-hold strategy. This strategy forces you to think about the stocks you decide to invest your capital into as the plan is to hold the positions indefinitely. Applying this approach over the long term while focusing on potentially undervalued stocks allows investors to generate alpha through capital appreciation. While this may not pan out for every position, diversifying your high-yield portfolio across 20 or more unique stocks will increase the odds of picking up shares of certain stocks when they are trading for bargain prices. The beauty of a long-term outlook is time; you can sit back and wait for the valuation to revert to historical norms, all the while collecting a generous passive income stream.
Watchlist Criteria
Creating the high yield watchlist, I had four areas of interest that I focused on: basic criteria, safety, quality, and stability. First off, the basic criterion aims to narrow down the list of stocks to those that pay a dividend, offer a yield above 2.75%, and trade on the NYSE and NASDAQ. The next set of criteria focuses on safety because that is a crucial part of a high yield investing strategy. The filter excludes companies with payout ratios above 100% and companies with negative 5-year dividend growth rates. Another level of safety can be associated with larger companies; therefore, the watchlist narrows in on stocks with a market cap of at least $10 billion. The next set of criteria set out to narrow down the list to include higher quality businesses.
The three filters for quality are: a wide or narrow Morningstar moat, a standard or exemplary Morningstar stewardship, and an S&P quality rating of B+ or higher. A Morningstar moat rating represents the company's sustainable competitive advantage, the main difference between a wide and narrow moat is the duration that Morningstar expects that advantage to last. Companies with a wide moat are expected to maintain their advantage for the next 20 years, whereas companies with a narrow moat are expected to maintain their advantage for the next 10 years. The Morningstar stewardship evaluates the management team of a company with respect to shareholders' capital.
The S&P quality rating evaluates a company's earnings and dividend history. A rating of B+ or higher is associated with above-average businesses. The last set of criteria focuses on the stability of a company's top-line and bottom-line growth. The filter eliminates companies with negative 5-year revenue or earnings per share growth rate. I believe a company that is growing both their top-line and bottom-line has the ability to provide growth to its investors in the future.
All of the stocks that pass the initial screener criteria (46 this month) are then ranked based on quality and valuation. Further, I sort the stocks in descending order based on the best combination of quality and value and select the top 10 stocks that are forecasted to have at least a 12% annual long-term return.
September 2023 Watchlist
Here is the watchlist for September 2023. There are two changes from the prior month: Bank of Montreal ( BMO ) and Verizon ( VZ ) drop off and are replaced by Discover Financial Services ( DFS ) and NextEra Energy ( NEE ). The data shown in the image below is as of 8/31/23.
All of the selected stocks this month appear to be potentially undervalued based on dividend yield theory.
The expected rate of return shown in the last column is computed by taking the current dividend yield plus a return to fair value over the next 5 years and a discounted long-term earnings forecast.
Please keep in mind that my return forecasts are based on assumptions and should be viewed as such. I am not expecting that these 10 companies will hit the forecasted returns. What I do expect is that these 10 companies have the potential to offer better returns during the next 5 years compared to the 36 high yield stocks that passed my initial filters but ranked worse in quality and valuation.
Past Performance
The top 10 list for August performed rather poorly, collectively the 10 chosen stocks were down by 4.93%. This was 2.54% worse than VYM and 3.3% worse than SPY. Year-to-date the watchlist maintains a healthy lead on VYM, +8.4% versus 1.06%, but trails SPY by a wide margin, +8.4% versus +18.65%. Since inception, which was 34 months ago, the watchlist trails VYM by 1.96% and SPY by 0.96%.
I do not expect that this watchlist will beat VYM or SPY every month. However, I believe that a buy-and-hold investing approach leveraging the stocks presented on this watchlist will generate long-term alpha compared to the broad market. I also have a personal target rate of return of 12% that I believe will be attained by this watchlist when measured over long periods of time.
Following July, the long-term annualized rate of return for the watchlist decreased from 15.22% to 12.71%. Even with the continued ups and downs in the market the watchlist is delivering on my target rate of return of 12%. It may dip below this range in the short-term but over a longer period of time I believe it will meet this target.
| Date |
| Top 10 List |
| ALL |
| VYM |
| SPY |
| 6 month |
| 2.48% |
| -0.76% |
| 2.32% |
| 14.50% |
| 3 month |
| 6.56% |
| 5.78% |
| 7.14% |
| 8.17% |
| 1 month |
| -4.93% |
| -3.99% |
| -2.39% |
| -1.63% |
| YTD |
| 8.40% |
| 1.82% |
| 1.06% |
| 18.65% |
| Since Inception |
| 40.37% |
| 45.20% |
| 47.40% |
| 43.77% |
| Annualized |
| 12.71% |
| 14.07% |
| 14.68% |
| 13.67% |
The sour return in August was not a great way to push into the second half of the year. The watchlist did gain 6.11% in July, and therefore still remains positive in the 2H of 2023.
Individual watchlist returns for August 2023 were:
- Bank of America ( BAC ) -9.66%
- Best Buy ( BBY ) -7.95%
- Bank of Montreal ( BMO ) -7.35%
- Goldman Sachs ( GS ) -7.14%
- Morgan Stanley ( MS ) -7.00%
- Pioneer Natural Resources ( PXD ) +5.43%
- State Street Corp. ( STT ) -5.11%
- Truist Financial (TFC) -6.52%
- Texas Instruments ( TXN ) -6.63%
- Verizon (VZ) +2.64%
Top 5 performing past and present watchlist stocks in August 2023:
- Hasbro ( HAS ) +11.52%
- Amgen ( AMGN ) +10.36%
- Cisco ( CSCO ) +10.20%
- Progressive ( PGR ) +5.95%
- Digital Realty Trust ( DLR ) +5.70%
Top 5 Stocks by total return since joining the watchlist:
- Principal Financial Group ( PFG ) +119.30% (34 months)
- Broadcom ( AVGO ) +116.06% (28 months)
- General Dynamics ( GD ) +84.20% (34 months)
- FedEx ( FDX ) +78.99% (11 months)
- Cisco ( CSCO ) +73.56% (34 months)
Top 5 Stocks by Average Monthly return since joining the watchlist:
- FedEx ( FDX ) +5.43% (11 months)
- Pioneer Natural Resources ( PXD ) +3.64% (6 months)
- Broadcom ( AVGO ) +2.79% (28 months)
- EOG Resources ( EOG ) +2.58% (6 months)
- Skyworks Solutions ( SWKS ) +2.46% (11 months)
In total there have been 78 unique high yield dividend stocks that have appeared in the top 10 list during the past 34 months. Out of these 78 unique stocks 57 have a positive total return since first appearing on the top 10 list. The average total return for these 57 stocks is 30.36%. The average loss for the 21 stocks that have negative total returns is -15.92%. Here are all 78 stocks, their total return since inception and the number of months since they first appeared in the top 10 list.
| Symbol |
| Since Inception |
| Count |
| PFG |
| 119.30% |
| 34 |
| AVGO |
| 116.06% |
| 28 |
| GD |
| 84.20% |
| 34 |
| FDX |
| 78.99% |
| 11 |
| CSCO |
| 73.56% |
| 34 |
| MRK |
| 64.71% |
| 28 |
| BMO |
| 61.89% |
| 34 |
| JPM |
| 61.40% |
| 34 |
| PGR |
| 56.74% |
| 31 |
| TD |
| 54.41% |
| 34 |
| PAYX |
| 49.36% |
| 31 |
| PEP |
| 44.97% |
| 34 |
| RY |
| 41.43% |
| 34 |
| BK |
| 40.82% |
| 34 |
| LMT |
| 39.07% |
| 34 |
| EPD |
| 36.90% |
| 25 |
| SNA |
| 34.91% |
| 19 |
| ATO |
| 34.07% |
| 21 |
| CMCSA |
| 33.24% |
| 12 |
| SO |
| 32.86% |
| 34 |
| MTB |
| 32.80% |
| 34 |
| SRE |
| 31.06% |
| 30 |
| SWKS |
| 30.69% |
| 11 |
| PM |
| 30.39% |
| 30 |
| BNS |
| 30.34% |
| 34 |
| AMGN |
| 29.84% |
| 34 |
| STT |
| 26.85% |
| 34 |
| CVS |
| 24.68% |
| 34 |
| HD |
| 24.50% |
| 14 |
| PXD |
| 23.91% |
| 6 |
| CM |
| 20.56% |
| 34 |
| HBAN |
| 20.52% |
| 34 |
| GIS |
| 19.54% |
| 25 |
| CMI |
| 17.43% |
| 18 |
| K |
| 16.69% |
| 30 |
| EOG |
| 16.49% |
| 6 |
| BLK |
| 16.25% |
| 16 |
| QSR |
| 16.16% |
| 24 |
| FAST |
| 16.14% |
| 7 |
| DRI |
| 13.97% |
| 25 |
| TXN |
| 13.35% |
| 14 |
| CMS |
| 11.83% |
| 30 |
| EVRG |
| 11.40% |
| 34 |
| RCI |
| 8.78% |
| 34 |
| TRP |
| 8.02% |
| 34 |
| DTE |
| 7.35% |
| 34 |
| KMB |
| 6.50% |
| 31 |
| CPB |
| 6.10% |
| 23 |
| MDT |
| 5.77% |
| 9 |
| OKE |
| 5.60% |
| 5 |
| NTRS |
| 5.32% |
| 34 |
| XEL |
| 4.73% |
| 30 |
| USB |
| 4.52% |
| 34 |
| DLR |
| 4.09% |
| 18 |
| UL |
| 4.03% |
| 6 |
| XOM |
| 3.14% |
| 5 |
| GS |
| 2.02% |
| 3 |
| WEC |
| -0.38% |
| 32 |
| CLX |
| -1.05% |
| 24 |
| LNT |
| -1.32% |
| 34 |
| GLW |
| -1.62% |
| 6 |
| HAS |
| -4.81% |
| 34 |
| MS |
| -5.20% |
| 25 |
| VZ |
| -5.65% |
| 9 |
| BAC |
| -9.66% |
| 1 |
| BX |
| -10.95% |
| 17 |
| INTC |
| -12.56% |
| 34 |
| AMT |
| -12.95% |
| 11 |
| BEN |
| -14.44% |
| 20 |
| UPS |
| -15.17% |
| 18 |
| TFC |
| -17.10% |
| 34 |
| BBY |
| -19.44% |
| 20 |
| PNC |
| -21.68% |
| 6 |
| TROW |
| -22.59% |
| 19 |
| MMM |
| -24.44% |
| 34 |
| CMA |
| -26.22% |
| 29 |
| PARA |
| -42.57% |
| 34 |
| AAP |
| -64.57% |
| 18 |
Closer Look At New Stocks
Here's a closer look at the two new stocks on this month's watchlist: Discover Financial Services and NextEra Energy
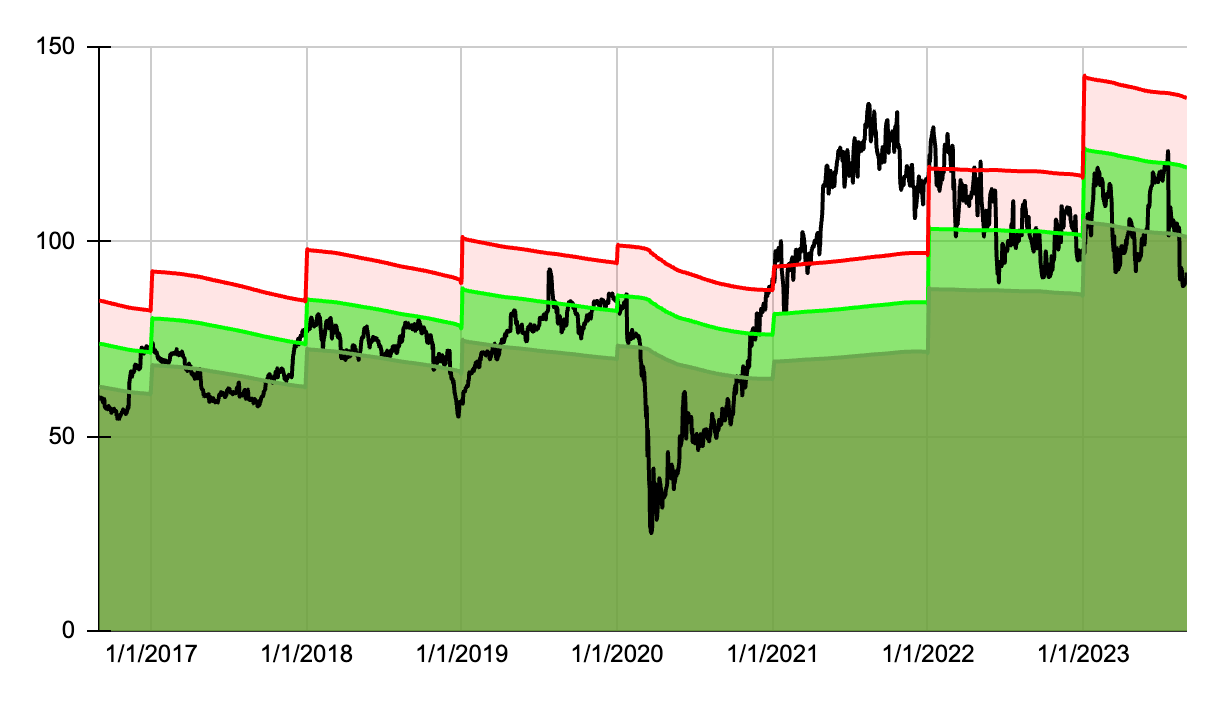
Let's start with the 7-year dividend yield theory chart for Discover.
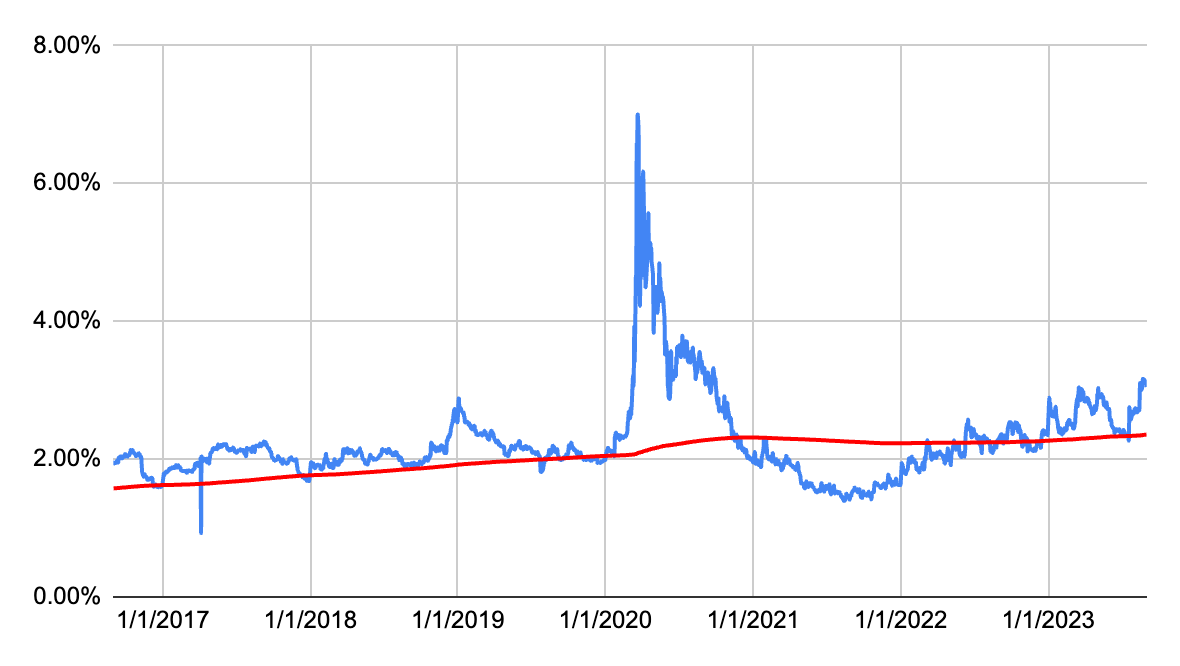
The share price peaked in late 2021 but did not crash as many other equities in 2022. While we still saw a downward shift in share price with DFS it has modestly trended lower back into the undervalued zone. As shown below the stock is offering strong yields today but nothing like we saw during the 2020 pandemic crash.
In the dividend growth department, Discover raised its dividend rate by 16.67% back in April of this year. During the last decade dividend growth has been very strong with the exception of 2016, 2020 and 2021 where shareholders saw single digit dividend increases. The short and long term CAGR has remained very healthy since 2011.
| Year |
| Dividend |
| Growth |
| CAGR |
| 2023 |
| 2.80 |
| 21.74% |
| 2022 |
| 2.30 |
| 22.34% |
| 21.74% |
| 2021 |
| 1.88 |
| 6.82% |
| 22.04% |
| 2020 |
| 1.76 |
| 4.76% |
| 16.74% |
| 2019 |
| 1.68 |
| 12.00% |
| 13.62% |
| 2018 |
| 1.50 |
| 15.38% |
| 13.30% |
| 2017 |
| 1.30 |
| 12.07% |
| 13.64% |
| 2016 |
| 1.16 |
| 7.41% |
| 13.42% |
| 2015 |
| 1.08 |
| 17.39% |
| 12.65% |
| 2014 |
| 0.92 |
| 53.33% |
| 13.16% |
| 2013 |
| 0.60 |
| 36.36% |
| 16.65% |
| 2012 |
| 0.44 |
| 57.14% |
| 18.32% |
| 2011 |
| 0.28 |
| 21.15% |
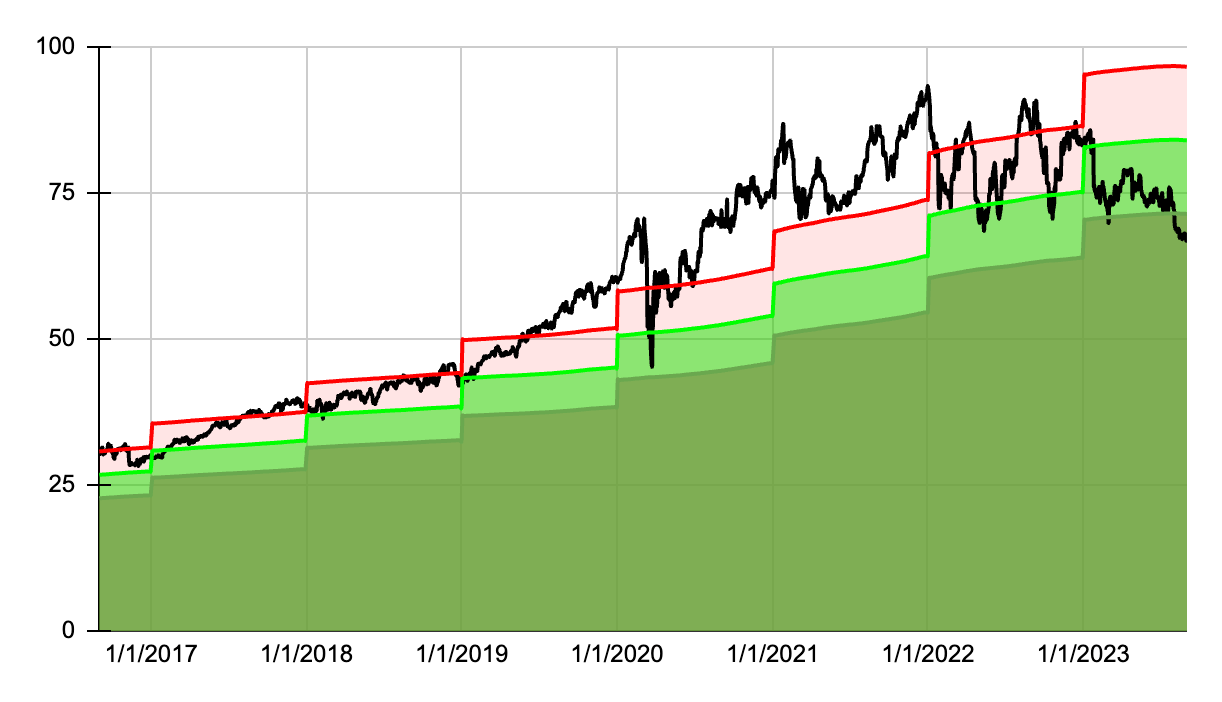
Now let's take a look at NextEra Energy, here is the 7-year dividend yield theory chart.
The stock has traded for a premium to fair value, as suggested by DYT, during the last 7 years and only more recently has it actually dipped back into undervalued territory. Aside from the 2020 pandemic this valuation model has not found many good entry points to purchase shares of NEE at a reasonable price. Today might be a unique opportunity for those of us that find NextEra to be a solid long term investment.
As you can see in the chart below the dividend yield for NEE has trended lower for the majority of the past 7 years. More recently it has ticked back up closer to 3% and presents an entry point we have not seen since the 2020 pandemic lows.
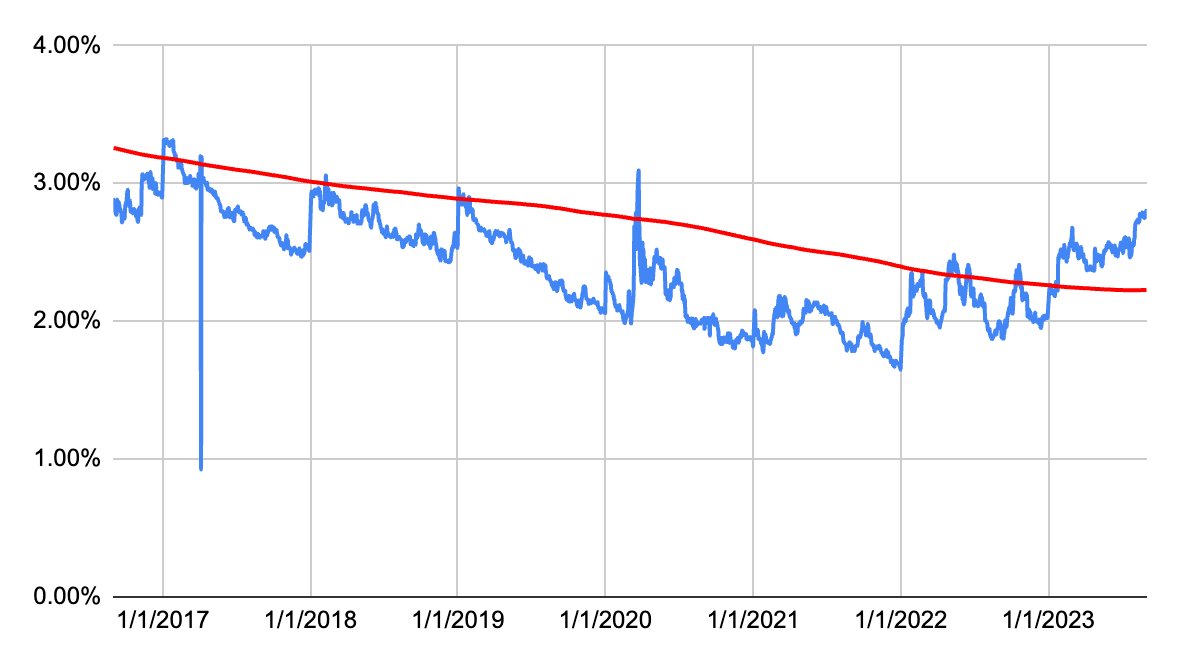
The company has a very good history of dividend growth, maintaining a double digit growth rate for 8 consecutive years now. That's not an easy feat to achieve, and made more impressive by the fact that NextEra is a dividend aristocrat with more than 25 years of dividend growth under its belt.
| Year |
| Dividend |
| Growth |
| CAGR |
| 2023 |
| 1.87 |
| 10.00% |
| 2022 |
| 1.70 |
| 10.39% |
| 10.00% |
| 2021 |
| 1.54 |
| 10.00% |
| 10.19% |
| 2020 |
| 1.40 |
| 12.00% |
| 10.13% |
| 2019 |
| 1.25 |
| 12.61% |
| 10.59% |
| 2018 |
| 1.11 |
| 12.98% |
| 11.00% |
| 2017 |
| 0.98 |
| 12.93% |
| 11.32% |
| 2016 |
| 0.87 |
| 12.99% |
| 11.55% |
| 2015 |
| 0.77 |
| 6.21% |
| 11.73% |
| 2014 |
| 0.73 |
| 9.85% |
| 11.10% |
| 2013 |
| 0.66 |
| 10.00% |
| 10.98% |
| 2012 |
| 0.60 |
| 9.09% |
| 10.89% |
| 2011 |
| 0.55 |
| 10.74% |
For further details see:
My Top 10 High Yield Dividend Stocks For September 2023