IP - My Top 3 YARP Stocks Right Now (Yield At A Reasonable Price)
2024-01-10 10:58:13 ET
Summary
- This article introduces a dividend stock selection process called YARP (Yield At a Reasonable Price) that prioritizes risk management and total return.
- YARP aims to identify stocks with historically high dividend yields that are currently undervalued and have the potential for price appreciation.
- Within this article, I provide three stocks that meet the YARP criteria: Entergy, International Paper, and Gilead Sciences, highlighting their solid fundamentals, profitability, and dividend situations.
Steve Jobs said that "People don't know what they want until you show it to them." If one looks back at the 250 or so articles I've written on the Seeking Alpha platform, or listened to me on the Seeking Alpha Investing Experts podcast, you would assume that I am an ETF geek. And you'd be right!
But that doesn't mean I don't like stocks. And when it comes to a certain type of stock, one that I identified based on a set of characteristics, designed a published index around years ago, and left on the proverbial shelf in recent years, I love stocks! At least, when we get a combination of a hands-on, process-driven approach, combined with a stock market environment that has brought it back into style. This article introduces what I refer to as "Yield At a Reasonable Price, or YARP for short.
Introducing YARP: Why another dividend stock selection process?
Many traditional approaches to dividend investing do not truly address the need for defense as part of the income investing equation. They look at "playing defense" as having your stock portfolio perform better than the broad stock market.
That is NOT what I want from my equity portfolio. To me, risk management is not a "versus the S&P 500" thing. It deals in real dollars, the ones that may no longer be there to enjoy retirement if this inanimate object called the financial markets takes a lot of those dollars away for a while, with no promise of re-earning them. In that situation, a dividend yield of 3-5% or so, while your principal is losing several times that, does not provide much solace.
Mission: Yield and total return, but risk-management is THE highest priority
Every investment has the potential to increase in value at any time. The key is how much risk of major loss comes with that investment. This is often forgotten or ignored by investors, or they do not prioritize its reality in their investment approach. Let's face it: we live in an era where markets just don't function the way they used to. Thank indexing, algorithms and an explosion of retail investor interest... which is great, except that it tends to gravitate toward speculation more than "blocking and tackling" investment basics.
"Dividend" does not always mean "safe." When markets get ugly, emotions take over and nearly all stocks fall together. As part of the back-test study you will see later in this report, the reason there were very few stocks meeting my criteria during 2008 and in early 2020 is straightforward: in a stock bear market or market crash, few if any stocks are spared.
How do dividend investors confront this reality? By learning to play defense, not just offense. The key is to have a process and mechanism to signal when risk of that happening is abnormally high.
Covered calls and chill? Fine until it isn't
I have written extensively on covered call ETFs. They have a lot of outstanding features, and one gigantic risk: they put so much emphasis on the consistent receipt of the call premium, they leave themselves open to market declines that occur quickly. Simply put, earning 1% a month sounds great until you lose 10% in a 3-month period, and instead of the bounce investors have come to expect, you get lower-lows and lower-highs, otherwise known as a downtrend. The longer it lasts, the more months of premium income needed just to get back to even.
Here is a chart of 3-month rolling returns for SPY since its inception more than 30 years ago. Much of the time the stock market does well enough to keep investors in the boat. But when economic conditions weaken, or an exogenous shock occurs, all bets are off. That's when covered call writing gets troublesome. I remain a solid fan of the approach, but the more automated ETF product-makers try to make it, the more I step slowly away from it as a "core" income driver.
It also helps to remind ourselves that any equity-related strategy is vulnerable to what I call "the big loss." And my number one investing rule is ABL: Avoid Big Loss. To me, that is more than 10% from cost on just about anything I own, especially stocks. As the chart below shows, whether it is SPY, a dividend yield ETF or a covered call ETF, they are all in the line of fire when things turn ugly.
I put my money where my mouth is on this one, selling all of my covered call ETFs (I held four at one point) during the past few months, and instead reverting my attention back to something I created several years ago, but kept on the proverbial shelf. When dividend stocks are getting crushed year after year on a relative basis, any dividend strategy will be more difficult. But the one I created during my years as an investment advisor and mutual fund manager has a few differentiating features that prompted me to bring it back, and introduce it to the Seeking Alpha audience. I'm still a big-time ETF-focused investor, but this approach is also a big part of my own process. And, it can even be applied to dividend ETFs.
YARP: The story and the process
Years ago, I developed a stock selection process to help me manage a mutual fund I was lead-managing at the time. It started with my then 19-year old son who was an aspiring investment professional and attending an excellent business school. Along with some help from other summer interns, I asked him to do something I suspect every teenager would like to do at some point in their path to adulthood: point out all of their father's mistakes. Fortunately, we stuck to investment mistakes on this one.
The idea was, I knew that if I combined screening and dividend stock selection with my now 40+ years of technical analysis experience, I could thread the needle in the following way:
- Identify a watchlist of stocks that were financially solid
- Monitor when each watchlist stock went ex-dividend each quarter
- Monitor when each watchlist stock was announcing earnings each quarter
- Use my technical analysis process to invest in the stocks that meet all of these criteria. Not some, all.
Why YARP versus other income approaches?
This is not an either or for investors, even if I am personally shifting most of my income-driven investing to a combination of YARP stocks and the short-term US Treasury portfolio I have maintained for a couple of years now.
Consider some of today's most popular dividend stock investment strategies, and how they can put investors into a false sense of security:
Dividend Growth (a.k.a. Dividend Aristocrats) - these portfolios are typically filled with stocks that have raised their annual dividend for at least 10-20 consecutive years. These portfolios often have yield levels too low to fund a retirement, yet still carry full stock market risk. Case in point was during the 2020 pandemic-induced crash. Many Aristocrat portfolios lost 30-35%, like the S&P 500 did.
High Yield stocks - seeking the highest yields sounds good. However, if you don't first understand WHY those yields are so high, and what risk is associated with them, you may get suckered into a bad investment.
Covered call option writing - these seemingly pop up everywhere when markets get volatile. But option premium is not the same thing as dividend income! This also requires the investor to truly understand a whole other type of vehicle and its risks before taking the leap (there's a pun in there, FYI).
Hybrid income investments - High Yield and Convertible Bonds are pitched as being "equity-like," offering yields equal to or higher than common stocks. But this is offset by the risks of lower credit quality and lower liquidity.
Closed-End funds - the leverage that drives these creates a "feast or famine" situation for investors. Leverage is what often pops market bubbles.
Flexible Bond funds - diversifying bonds with other types of bonds does not solve the issues inherent in today's bond market. Instead, these strategies provide a false sense of security, especially given the potential for a "credit event" within the next year or two.
A modern approach: Same aim, different angle
This is what I want from my non T-bill income portfolio:
1. Deliver sufficient cash flow from dividend income
2. A proactive approach to keep losses in a tolerable range
3. A repeatable, systematic process that combines the best features of algorithmic and human investing techniques
What drives YARP is an almost too simple observation about the stock market. When the dividend yield for a fundamentally solid stock is much higher than normal, and fading off a recently high level of yield versus its own history, that puts it on the YARP radar. This is no different than saying I don't like stock XYZ at 30x trailing earnings, but at 20x I'll inch up to it and see what's going on.
So, YARP starts with the yield history of a stock, going back about seven years. Why? Because the studies I did with my son last decade determined that five was a bit on the short side, and 10 was more data and noise than required. Seven years was a sweet spot for a look back time frame for YARP dividend stock analysis.
The goal of the YARP Ratio is to evaluate the intermediate and long-term attractiveness of a stock's yield AND price. That is why my team and I calculate the YARP Ratio for hundreds of stocks and ETFs every trading day, and observe patterns to draw more confident conclusions about how to deploy it.
Calculating the YARP ratio
Take the annual dividend yield of a stock (or ETF) over each day for the past seven years. Then, take the current annual dividend yield, and calculate its percentile within that seven years of historical data. Note that the "trailing 12-month yield" is typically used, to get a smoother set of data.
For example, if a stock's annual dividend yield has ranged from 3.0% to 6.0% during the past seven years, and the stock yields 3.3% now, it is in the 10th percentile of its 7-year range. That is, it is in the lowest 10% of its historical dividend yield. If the stock were yielding 5.7%, it would be in the 90% percentile. Generally speaking, when looking to purchase a stock or ETF, I aim to do so when it is near the upper-end of its historical percentile range. So, a YARP Ratio of 90% is, at face value, more attractive long-term than a 10% YARP Ratio.
The goal is to buy stocks when they are "cheap" on a yield basis, and hold them until the yield is toward the bottom of its historical range (i.e. expensive" on a yield basis). If buying high and selling low sounds strange, remember that we are talking about a statistic that describes where the dividend yield is, not where the stock price is. This is a form of value investing, but applied to stocks that pay a reasonable dividend, and with a critical added piece: the chart analysis.
YARP can be considered a research factor in stock screening, a core research tool, or a total portfolio construction method. It depends on the goals of the investor. All investors have inherent biases and preferences. Below are some of mine when it comes to dividend stock investing.
By introducing YARP now, my aim to help add a valuable piece of information to the portfolio construction and management approach. I have renewed my own interest in this, after seeing the price-only component of the S&P 500 High Dividend Index (the 80 highest yielding stocks within the 500), do absolutely nothing from the start of 2020 through the end of 2023 (see above chart).
That's four years of dividend yield, but no price appreciation. The yield will always be there to some degree, but if there's not price appreciation, that's not a "total return" investment. And YARP is a total return approach. Because I am a total return investor. I don't care if a stock yields 10-15% if there's a good chance it will tip over in price and wipe out lots of yield I have to make back later on. I want to keep my account value net of the dividend rising patiently, steadily. A "low standard deviation" approach.
What YARP stocks are supposed to look like
1. A "margin of safety" due to their historically high dividend yield
2. Underpriced on a long-term basis, which gives them higher long-term return potential than the typical stock
3. Sufficient yield (for me, even a 2-3% yielder can work in this strategy, for reasons noted below).
4. Price action that indicates a potential transition from merely "cheap" to "competitive long-term total return"
YARP ratio yield "zones"
Sungarden Investment Publishing
When I do that YARP yield calculation and look at the testing and actual experience I've had investing through this process, I observed 6 different "risk zones" based on where that earlier calculation sits at any point in time. I am not against taking risk to earn reward, but I want to have a darn good idea of how much risk I am taking. There is so much data and history on dividend stocks, a table like the one above, which I first created back in 2017, is a good guidepost.
The zones, explained
White zone
This is where the YARP Ratio is close to 100%. That means that the stock's yield is near or at the highest level it has been at during the past seven years. The white zone is where some of the biggest long-term winners start their moves. However, that upside comes with perhaps the highest level of uncertainty. In the same way that a "cheap" stock can get much cheaper, and the stock price can fall much further than one would ever expect, so is the case when the YARP Ratio is in the White zone.
Green zone
If there is a "sweet spot" in the YARP Ratio, this is it. Importantly, a YARP Ratio level between 75% and 95% is not by itself sufficient to conclude you have identified a "winner." When a stock's YARP Ratio drops from above 95% to below 95%, and continues falling for a while, it is usually a good sign. YARP Ratio analysis is a form of technical analysis, in that sense.
Blue zone
The Blue zone is generally where either of two situations are in progress. Either a stock that recently bottomed (moving from white to green) now has a head of steam, and you can have more confidence in the momentum the stock now exhibits. Or, the stock's up move will not be long-lived, and that you have already missed the buying opportunity. This is one of many reasons that the YARP Ratio alone is not an investment strategy. I use the YARP Ratio as a starting point, and add more "data evidence" to make more confident buy and sell decisions.
Grey zone
Just as "grey area" is an expression that implies something is in an in-between or neutral state, so too when the YARP Ratio is in the grey zone. There is appreciation potential, but risk is now higher than when the stock was trading in the green or blue zones. If there is such a thing in the YARP ratio as a "hold" rating, the Grey zone is it. Taken by itself, it means there is no urgency to sell, but also not something attractive to buy.
Yellow zone
I am describing these color zones with the assumption that I bought a stock in the green zone. If it is now in the yellow zone, I likely have made a good profit on the stock. Do I sell it and look elsewhere? Strictly in YARP Ratio terms, yellow is more a signal to pay close attention to the stock, and be ready to react if the price rolls over, since that is more likely to occur in this area than when it was purchased. So this is another form of hold signal, but with greater likelihood than the Grey zone that it is getting late in the stock's up cycle.
Red zone
This is not an automatic sell signal. It is perhaps the highest reward zone for entering the stock, but it comes with the highest risk. So I tend to shy away from purchases here, though I might occasionally take a "flyer" on buying out of the money call options, and purchasing the stock if it rallies strongly, or just profit on the call. I just don't want to put more than a small amount of capital at risk in the red zone.
The exception to the rule
But there is one important exception to the concept that a higher YARP Ratio percentage value is a better entry point than a much lower one. When the YARP Ratio rises and crosses above 98% from below that level, things can get trickier.
This is similar to thinking you have a cheap stock because its price is nearing its 52-week low. It might represent a good buying situation, or it might just be making the first of a long series of new 52-week price lows. This is the proverbial "falling knife" in the old Wall Street expression "don't try to catch a falling knife."
So, while this does leave plenty of room for the YARP Ratio to decline (translating to price growth), such a high percentile may indicate that the security's price is not done falling. Once the YARP level hits 100%, there is no telling how much more the security's price may fall before the YARP value decreases again.
Applying YARP to buy and sell criteria
The YARP Ratio is not enough. That should be obvious by my discussion of its features and limitations above. Buying a dividend/value stock is not about it simply being "cheap." Cheap stocks can get cheaper, and then even cheaper. So, in YARP investing terms, I need more than just a well-positioned YARP Ratio to commit capital to buy something.
Buying a stock is about it not only being a good value. That stock also needs to show signs that its price is ready to start moving up. Selling a stock is about listening to the stock when it tells you it is tired, and it may not last much longer in the upward direction. That means we need to measure the stock's price trend over multiple time periods, and let it tell us when it is getting weak.
My technical analysis approach that I combine with the YARP Ratio is an entire separate article on its own. So here, I'll simply bottom-line it for now and say that a security needs to be in "good buying position" in terms of both its YARP and its actual price trend in order to be given the proverbial "green light" to be purchased. That means that in addition to monitoring the level of the YARP Ratio, I measure the stock's price trend over multiple time periods, and let it tell me when it is getting ready to move, or too weak to risk continuing to hold.
BUY RULES:
1. YARP Ratio between 95% and 75%
2. YARP Ratio declining
3. Upward trend in price
SELL RULES:
If either of two events occurs after a stock has been bought, it is sold:
1. The YARP Ratio rises above 98%
OR
2. The stock falls 10% from its highest point since purchase. Not a trailing stop, but similar in intention. And sometimes, I'll jump in and sell earlier, if I see a confirmed downtrend and there is a better candidate to swap to. Remember, this is a tactical strategy, at least the way I use it.
My Top 3 YARP Stocks Right Now: ETR, IP, GILD
If the feedback from this initial YARP-focused article is strong, I will provide regular updates on what I'm doing in my own YARP portfolio that I recently created in one of my brokerage accounts, with the goal of supplementing that Treasury securities income. I have started to create a YARP watchlist like I did back in my days of running a mutual fund largely on this approach, and from that list I present below three stocks that look like they have good potential. The three stocks are Entergy ( ETR ), International Paper ( IP ), and Gilead Sciences ( GILD ). Three stocks from three different sectors- utilities, materials, and healthcare.
Note that I remain generally risk-averse in the current stock market, so I suspect that as the year goes on, the universe of great, not simply good, YARP picks will expand.
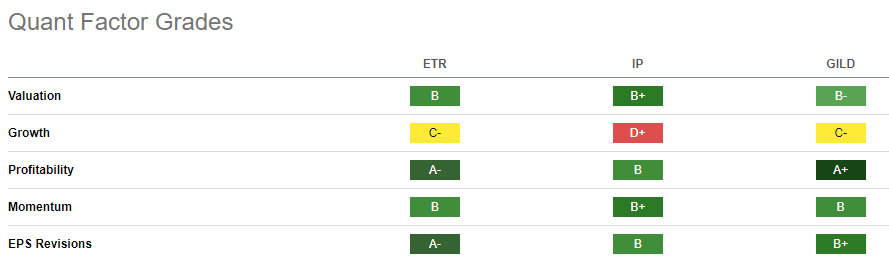
From a fundamental standpoint, I focus primarily on Seeking Alpha's Valuation and Profitability Grades. And the three stocks I have chosen have valuation grades of B+, B and B- and in a market that I suspect still needs a washout at some point, I don't need A-ratings here. There will come a time when I will, but not in this sloppy stock market.
These all have very high profitability grades, which is a key criteria for me. I can't trust the YARP score and the chart if I have to worry about a company's fading fortunes. I try to avoid owning during earnings periods, or at least minimize that, since blowups are not welcome in YARP total return investing.
I assume that my current YARP favorites will have decent momentum scores, and these three all rate in the B range there.
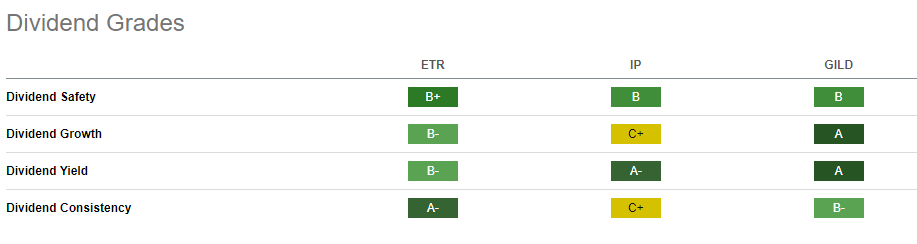
Naturally, any YARP candidate must have a solid dividend situation. It needs to be judged as relatively safe, and the yield needs to be reasonable enough versus what else is out there. Consistency of the dividend is important but I can make room for a lower rating like IP's because this is a tactical strategy, and if the threat level there should really heat up, I can move on to something else, or sit in cash with whatever I had allocated there.
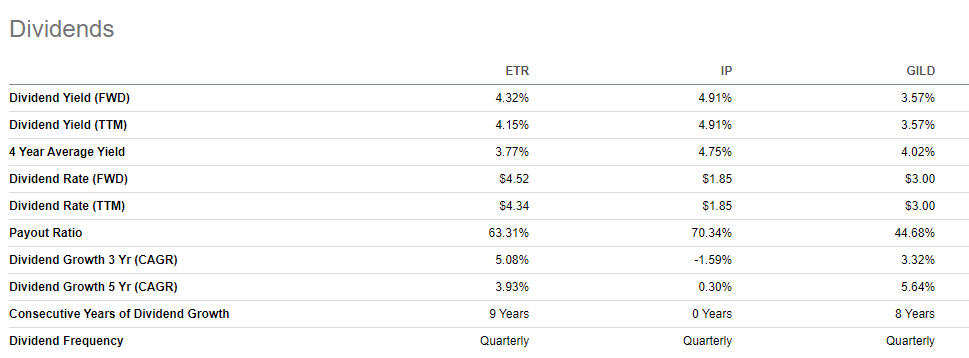
A closer look reveals that IP has not been able to grow its dividend each year, but the payout ratio (70%) is sufficient for the time being. And its 4.9% dividend yield is, I think, fair compensation for that risk. The other two are pretty solid in all respects shown here.
Going forward I'll provide more interesting technical charts and zero in on the yield history more. But as you can see below, all three are near the upper end of their 7-year yield range, and that yield is coming down from a recent peak. That is the tell-tale sign for me that these are candidates, if I were looking just at that picture.
Finally, there's the timing of the ex-dividend date. I'll buy a YARP stock right after it pays if it just hit my radar to qualify, but the ideal situation is when I can own it for at least a few weeks, hopefully earn some price appreciation, grab that quarterly dividend payment, and continue staying "on it" from a research standpoint for as much (and hopefully all) of the next quarterly dividend cycle.
ETR's last ex-dividend date was on November 13, IP on November 14, and GILD on November 21. So all three should go ex-dividend again in mid-February. That's my initial window to try to earn some positive return, then qualify for the next dividend payment by still owning the stock on that date.
Sure, I could just wait until right before the ex date, but that's not what YARP is about. It is NOT a "dividend capture" strategy. It is a total return approach to tactical dividend investing,
Final thoughts for now: YARP dividend investing means buying tactically, but look long-term whenever possible
Ideally, I'll own these for years, but with YARP and the heavy risk-management mandate I have, it is one step at a time. As with any equity I analyze these days, getting through weeks, then months is the first, high bar to jump over, before we get to "long-term capital gains" territory.
For further details see:
My Top 3 YARP Stocks Right Now (Yield At A Reasonable Price)