VICI - My Top REIT Picks For 2023
Summary
- This is the first time in over a decade that my top picks lost money.
- I’m always happy to show you the proof of my stock-market wins. But I have to be just as honest about the losses.
- REITs have performed remarkably well after periods of downturns.
- Don't miss the train before it leaves the station.
There are just a few days left to 2022. Which makes it a great time to put together my “Top 10 REIT Picks for 2023.”
‘Tis the season to think about the future, after all.
Then again, ‘tis also the season to ponder the past. To reminisce about the good things, acknowledge the bad things, and analyze it all in order to make the future a better one.
As such, I’m going to take this moment to exercise some necessary humility. Both for your benefit and for mine.
In the words of my former business partner, “I eat a lot of crow, and it actually tastes good.” So here goes on my eventually tasty humble pie…
2022 was a tough year for real estate investment trust ('REIT') investors. A very tough year, in fact.
This is the first time in over a decade that my top picks lost money.
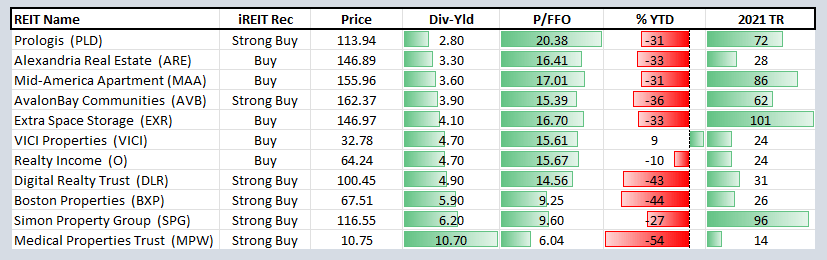
I’m always happy to show you the proof of my stock-market wins. But I have to be just as honest about the losses. So the graphic below shows proof of how things went this year.
iREIT
As you can see, there were a few outliers – as in two – in 2022. VICI Properties ( VICI ) rose nicely, especially in a market like this. And Omega Healthcare ( OHI ) gained a good bit too.
But the vast majority of my picks were losers.
Assessing REITs in 2021, 2022, and 2023
2022’s performance is especially disappointing compared to my 2021 report card. My recommendations that year returned an average of 40.8%, with the top performers being:
- American Campus (ACC) – up 36.2%
- Innovative Industrial ( IIPR ) – up 36.5%
- Iron Mountain ( IRM ) – up 86.7%
- Extra Space ( EXR ) – up 94.7%.
Now, I will also mention that the entire REIT sector returned -22% so far in 2022. So I did outperform in that regard. That’s a relevant fact to point out.
So is this: that the larger REIT sector underperformed against other market categories, as shown below.
U.S. Sector 1 Year Performance - 14th December 2022 - Simply Wall St
But it’s also accurate to say that a loss is a loss.
So what about 2023? We’ve all seen plenty of headlines by now: The debates about how we’ll fare.
Some say we’re in for a recession in the first half of the year. Some say we’re in for a recession in the second half. Some say we’re already in a recession and that won’t change for a while. And some say we’ll avoid a recession altogether.
But I really don’t see anyone saying 2023 will be an easy year.
Not Easy, but Still Better?
Nobody’s throwing parties of anticipation about picking up profits left and right like gold nuggets on the ground.
That isn’t to say there’s no actual optimism out there. Some are seeing a turnaround in the second half. Take the Nasdaq’s recent piece, “ Summary 2023 Outlook: A Market in Transition ,” which reads like this:
“In our view, 2023 will be a year of important ‘transitions.’ We believe the first transition will be away from a bear market to a potential bull. ”
But that does come with some caveats.
The Nasdaq’s Perspective on What to Expect for the Stock Market in 2023
The Nasdaq publication continues with:
“History suggests attractive forward returns for stocks after the type of drawdowns we witnessed in 2022, but the timing of the market boom is unclear and the process will be bumpy, in our view. Longer-term, returns for balanced stock and bond portfolios look attractive to us again, with valuations more reasonable and bond yields above long-term inflation expectations.”
I’d love to say it gets much cheerier from there, but here’s the next paragraph:
“We believe the next two major transitions involve an evolution of investors’ concerns: away from inflation and towards recession, as well as away from pandemic-related disruptions towards geopolitical ones.”
In other words, there will still be doom and gloom, just redirected.
Still, for those investing in U.S. stocks, Nasdaq adds, America will offer more attractive opportunities than the rest of the world. “A Fed ‘pivot’ towards less restrictive policy is likely later in the year…”
And then there’s “the last major transition” it foresees for 2023:
“[This] involves the end of ‘growth’ stock dominance and an increased focus on consistent cash flow, dividend, and coupon generators – what RiverFront calls the ‘P.A.T.T.Y.’ (Pay Attention to the Yield) theme. Under these circumstances, we see modest upside for stocks and bonds in our base case scenario, with preferences for consistent cash flow generators, cyclicals, smaller-cap companies, and traditional ‘value’ plays like energy and financials."
Since REITs are “traditional ‘value’ plays” as well, that analysis ultimately bodes well for the sector.
But even if that isn’t the case, I believe the companies below are worth buying and holding onto for the long term.
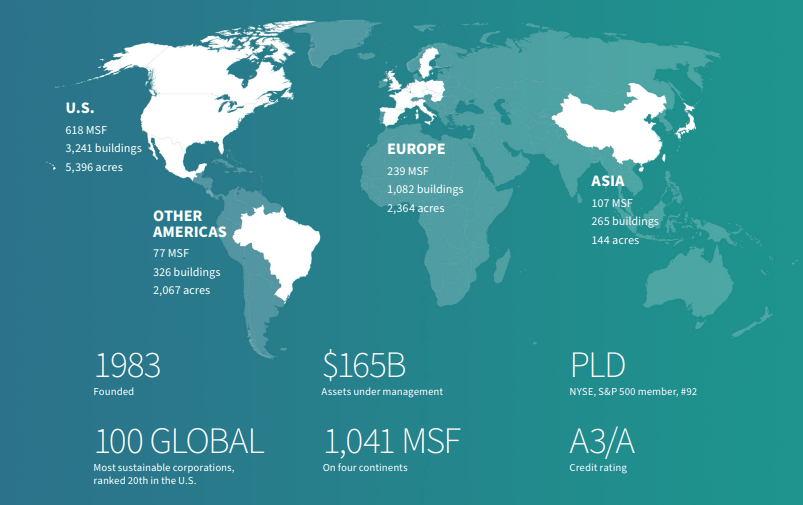
Prologis ( PLD )
Prologis focuses on logistics real estate. Their portfolio has been growing quickly and their position comes with a high barrier to entry that helps Prologis maintain its market-leading spot.
Prologis’ top customers include Amazon, FedEx, Home Depot, and Maersk. They own over 4,900 buildings with 1.0 B square feet across the world.
Investor Relations
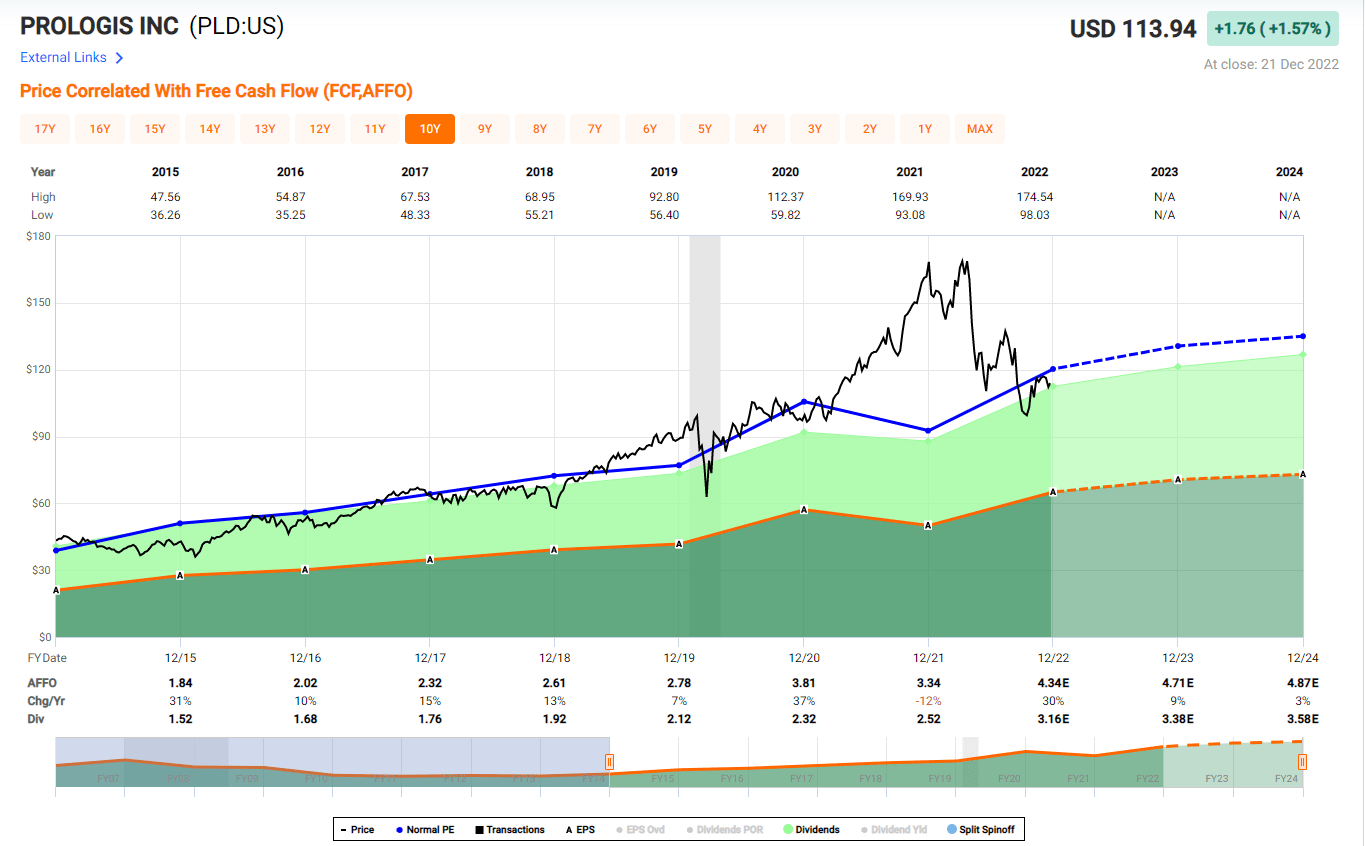
The need for logistics keeps growing, so their footprint and revenue has been expanding, and this is reflected in FFO and AFFO growth.
The AFFO growth rate in the past five years has been 11.13% per year (five-year CAGR), and the dividend growth has been 12.42% per year in the same period.
Their dividend is very safe at this point with 62.59% cash dividend payout ratio and 61.42% FFO payout ratio.
The P/AFFO of 31.34x and P/FFO of 20.03x are far below their historical average, and I believe their stock is undervalued at this point.
FAST Graphs
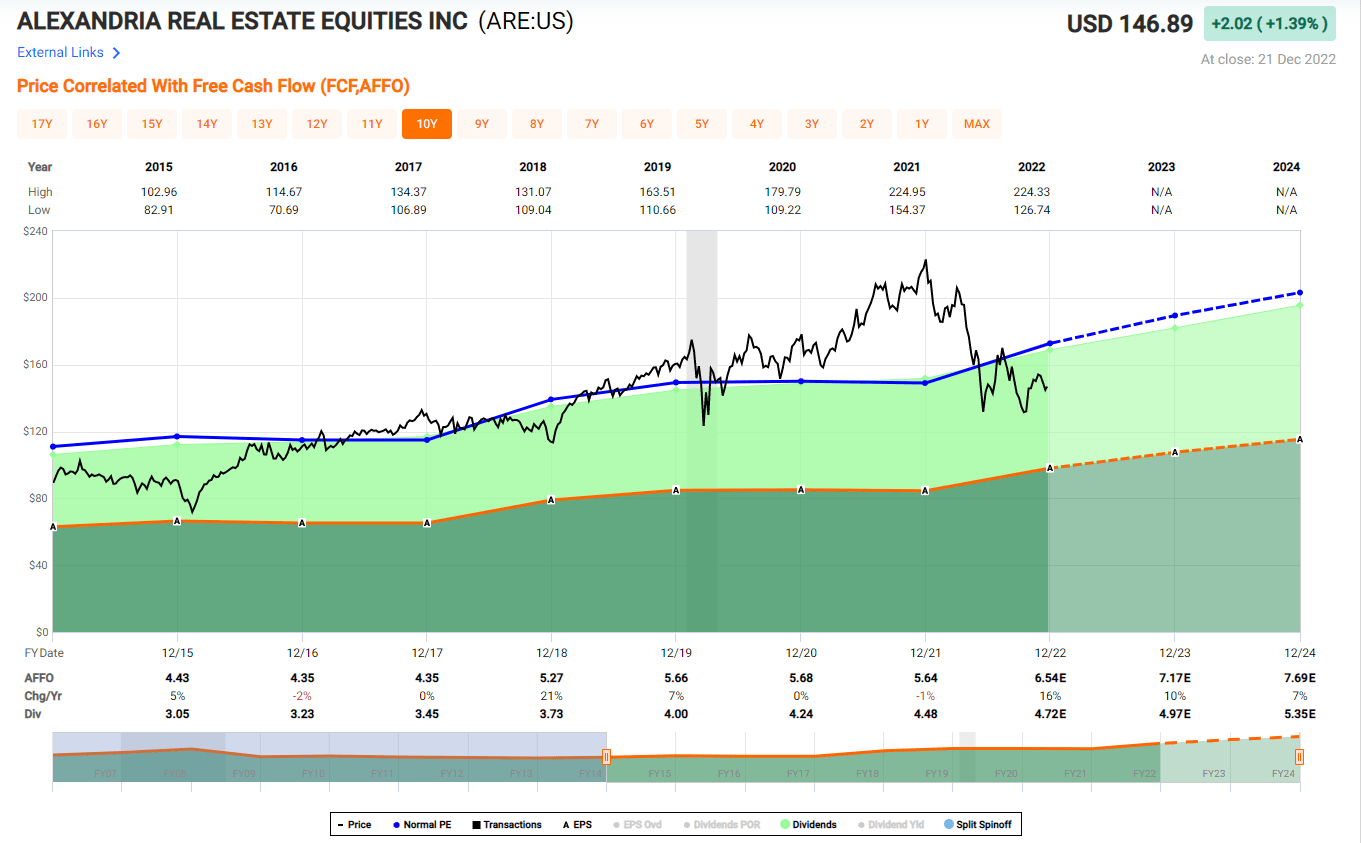
Alexandria Real Estate Equities ( ARE )
Alexandria Real Estate Equities focuses on urban office real estate. They own, operate, and develop collaborative life science, technology, and AgTech campuses.
These are high growth segments, which has allowed Alexandria’s same property net operating income to grow substantially in the past several years. Given their continued strategic investment, I expect the trend to continue in the future.
Investor Relations
They have a solid balance sheet with significant liquidity – in fact, $6.4 B liquidity is available to them.
The weighted average remaining debt term is at 13.2 years, and the weighted average interest rate is at 3.52%. Almost all (95.9%) of their debt is fixed rate.
Their dividend is very safe at this point, shown by a cash dividend payout ratio of 64.32% and FFO payout ratio of 56.48%. And the dividend keeps growing too. In the last five years, the average annual dividend per share growth has been 6.5%.
FAST Graphs
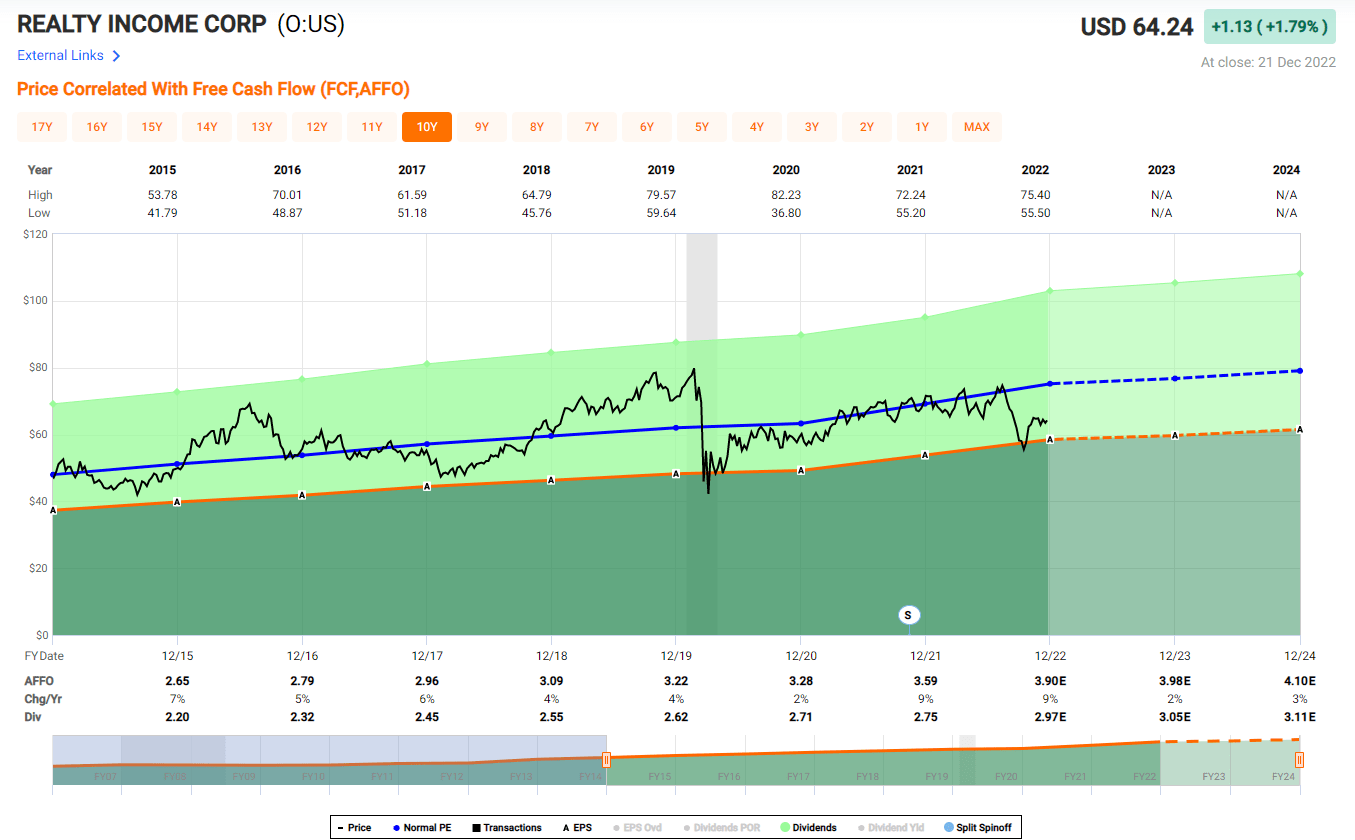
Realty Income Corporation ( O )
Realty Income is a monthly dividend company with a diversified portfolio consisting of over 11,000 properties with high occupancy.
From an investing perspective, one of the highlights of this company is their very strong dividend track record (27 consecutive years of rising dividends), making them a great investment option for dividend seeking investors for a long time. The compounded annual total shareholder returns since 1994 for Realty Income has been 14.4%.
Investor Relations
The valuation metrics show that Realty Income is undervalued at this point. The current P/AFFO of 17.68x and P/FFO of 15.43x are about 25% lower than their historical average. The iREIT equity rating tracker shows the margin of safety for Realty income is 10%.
Also, their dividend is safe at this point with a cash dividend payout ratio of 74.99% and AFFO payout ratio of 76.67%.
FAST Graphs
Mid-America Apartment Communities ( MAA )
Mid-America Apartment is a multifamily focused REIT. They own, operate, acquire, and develop apartment communities located in the Southeast, Southwest, and Mid-Atlantic regions of the U.S.
Mid-America Apartment has been a poster child of steady growth. Their core FFO, annual compounded total shareholder return, and dividend growth history all show steady, reliable growth in their portfolio.
MAA Investor Relations
Recently, we spoke with CEO Eric Bolton and he shared some insight into MAA’s plans and market outlook. The interview and its transcript can be found here ( CEO Interview ).
Their dividend is very safe at this point, demonstrated by a cash dividend payout ratio of 50.30% and AFFO payout ratio of 64.84%.
The current P/AFFO of 25.60x and P/FFO of 16.81x are about 15% lower than their five-year average. This makes it a great time to consider adding some shares.
FAST Graphs
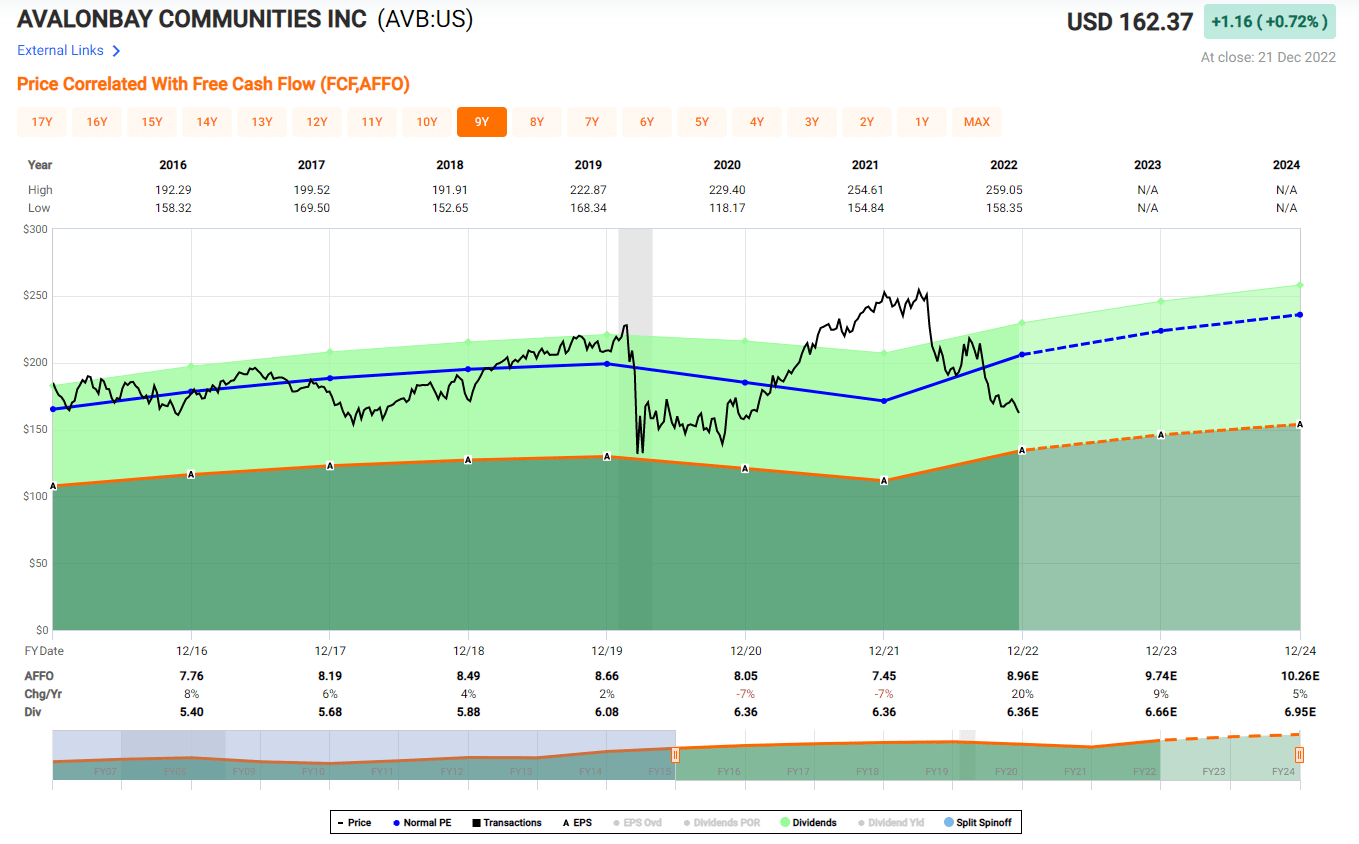
AvalonBay Communities ( AVB )
AvalonBay Communities develops, acquires, owns, and operates multifamily apartment communities in New England, New York, the mid-Atlantic, Pacific Northwest, and California area.
Their portfolio has been growing steadily, and their FFO and dividend has been growing nicely as well. Given their strong operation and embedded growth potential, I expect their growth will continue in the future.
Investor Relations
AvalonBay has a strong balance sheet with solid liquidity. Their net debt-to-core EBITDAre is at 4.6x and the weighted average year to maturity of total debt is at 8.1 years. Also, they have excess liquidity of $1.9 B available to them.
Their dividend is safe at this point with the cash dividend payout ratio of 65.33% and FAD payout ratio of 78.22%. Their valuation metrics (P/AFFO of 22.27x and P/FFO of 15.28x) suggest that they are undervalued.
FAST Graphs
Simon Property Group ( SPG )
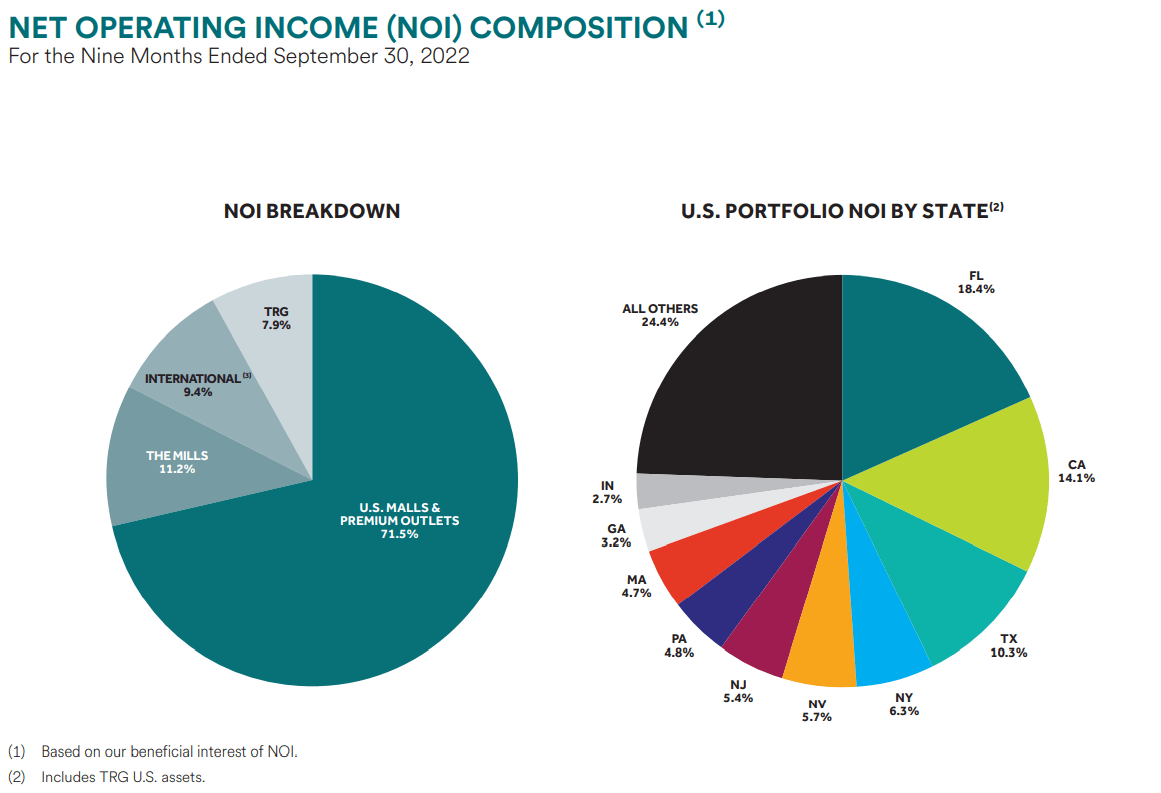
Simon Property Group is a REIT that owns, develops, and manages Class-A malls. They own several other property types, but the majority of their earnings come from the income producing malls that they own. 71.5% of their Net Operating Income (NOI) was derived from U.S. Malls and Premium Outlets.
Followed by 11.2% NOI from The Mills, 9.4% NOI from international properties, and 7.9% NOI came from their interest in Taubman Realty (TRG). They are well diversified geographically with properties across the U.S. as well as their international interests in Klépierre and Taubman Realty.
3Q22 Supplemental Information
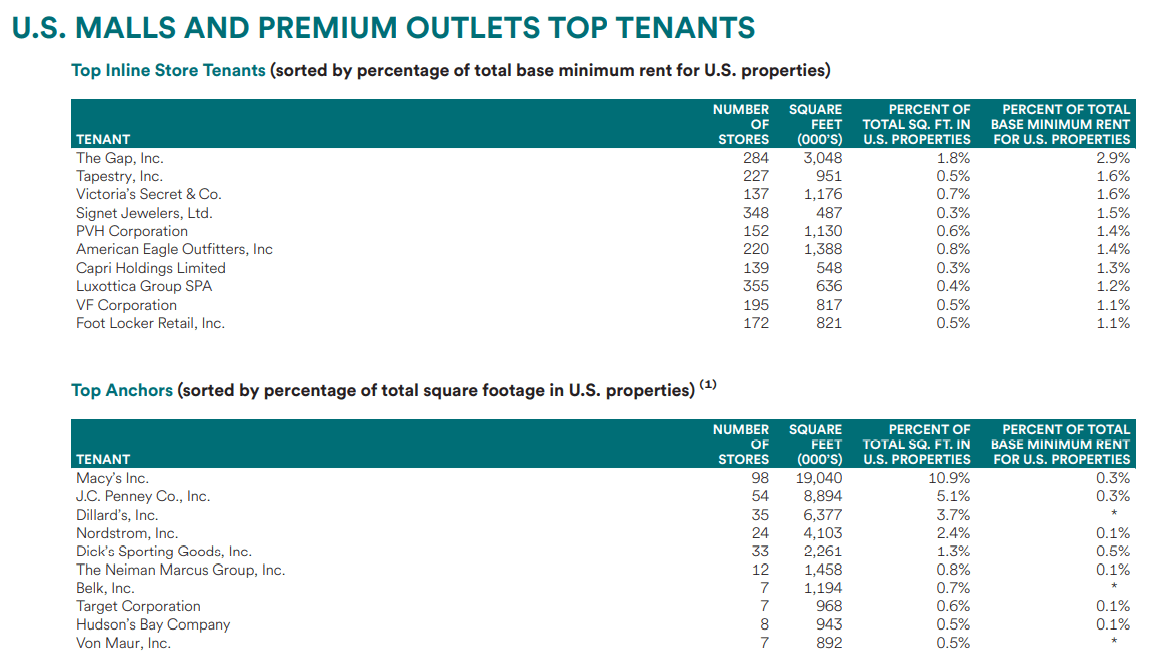
Simon is also well diversified in its tenant base. The Gap Inc., which is Simon’s largest tenant, makes up less than 3% of its base minimum rent, while Macy’s, its largest Anchor tenant only accounts for 0.3%.
3Q22 Supplemental Information
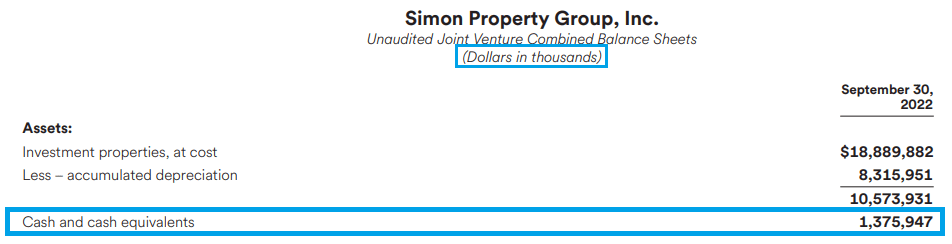
Aside from the fact that Simon Property is one of the most established and respected REITs around, one thing really stands out and makes it a great REIT to hold in 2023 and beyond. Safety – it's one of the few REITs with an A- credit rating and as of 9/30/22 they had 1.2 billion cash on hand.
Between the 7.4 billion they can access under their revolving credit facilities and the cash they have on hand they have an enormous amount of liquidity which puts them in a position of strength to meet their debt obligations and invest in their operations.
3Q22 Supplemental Information
3Q22 Supplemental Information
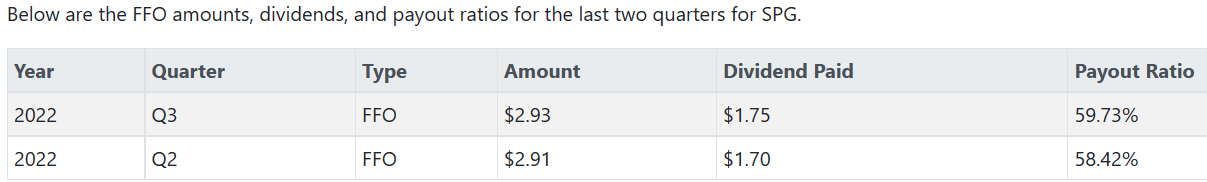
In addition to their liquidity, Simon has safety in its dividend. They pay over a 6% yield and support that with an FFO payout ratio of just 59.73%. I’m not sure many other REITs can support such a high yield with such a low payout. Simon’s Dividend is safe.
REITNotes
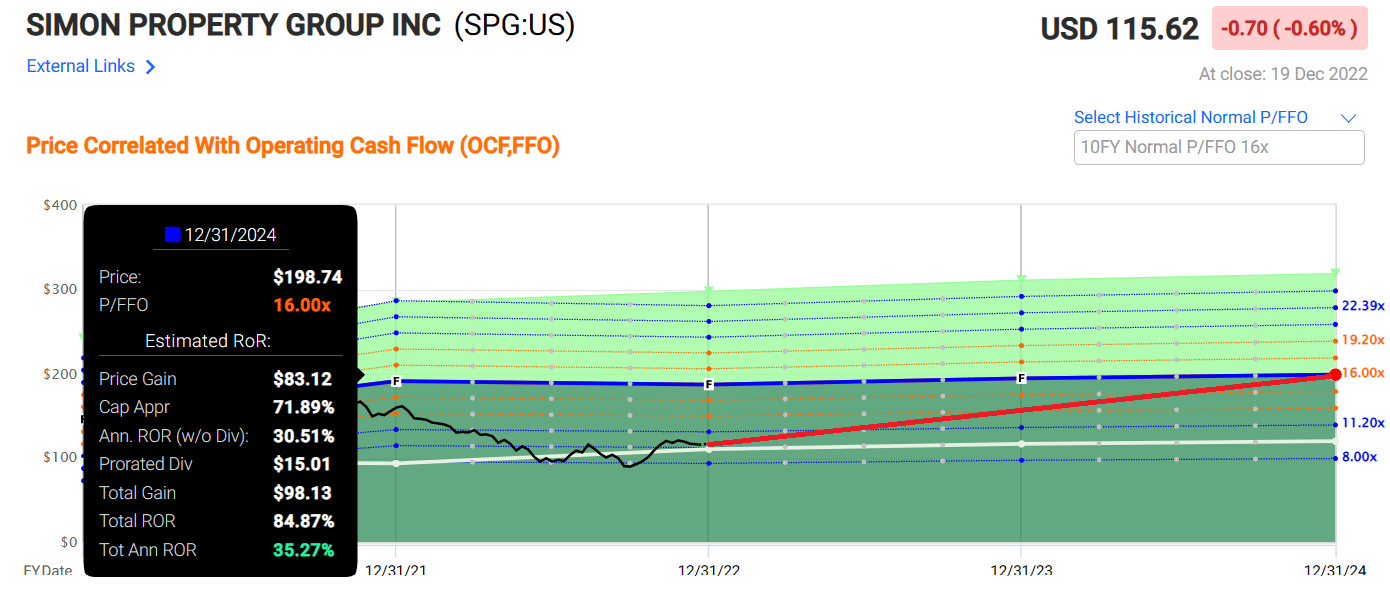
The third point I’d like to make regarding their safety is Simon’s current valuation. They are trading at an FFO multiple of 9.88x compared to their 10-year average multiple of 15.80x which provides a wide margin of safety.
That’s not to say that the price can’t go down from here or can’t go down further in 2023 but buying Simon at an FFO multiple 9.88x and holding it for the long term will likely not only protect your principal but reward the patient investor with a handsome capital gain.
iREIT
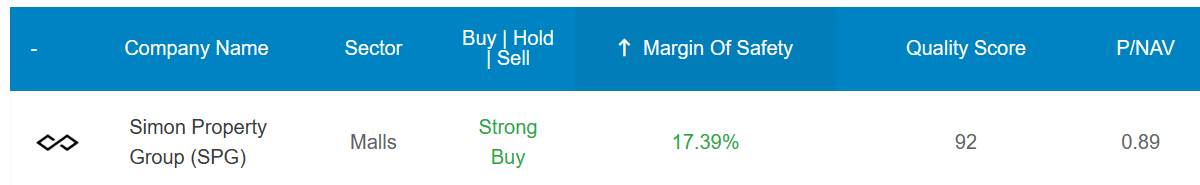
Now Simon may not have the fastest growth rate around, or the most in vogue properties, but in terms of safety of the business, safety in the dividend, and the safety in its current valuation, we rate Simon Property Group a strong buy.
FAST Graphs
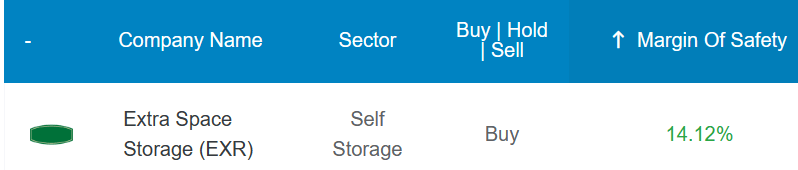
Extra Space Storage ( EXR )
Extra Space Storage is a REIT in the self-storage sector that was founded in 1977 and went public in 2004.
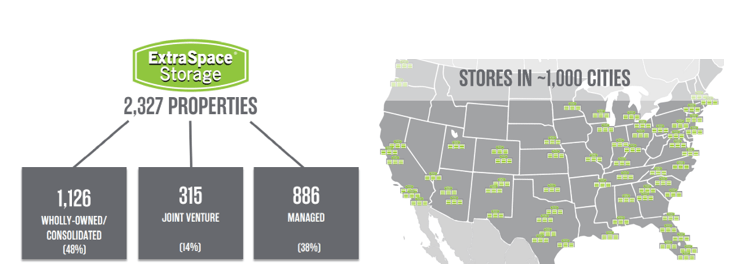
As of t he 3 rd quar ter of 2022 they wholly owned 1,126 properties, have a joint venture in 315 properties, and manage 886 properties. They are geographically diversified with properties in ~1000 cities across 41 states.
EXR Nov '22 Investor Presentation
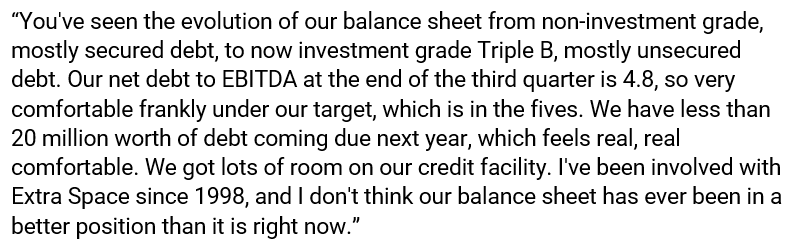
A couple of weeks ago I sat down with Joe Margolis , the CEO of Extra Space, and discussed several aspects of the business. Here’s what Joe had to say about their balance sheet and overall financial health:
Joe Margolis, CEO of Extra Space / iREIT
EXR Nov '22 Investor Presentation
One thing he mentioned that I hadn’t really thought about is the ancillary income they receive from tenant insurance.
Currently more than three quarters of new tenants choose to insure their goods with their in-house product, which shows how a good management team can find ways to generate additional income outside of their core operations.
You can find the full interview and podcast at the link below:
The Ground Up Podcast: Joe Margolis, CEO Of Extra Space | Seeking Alpha
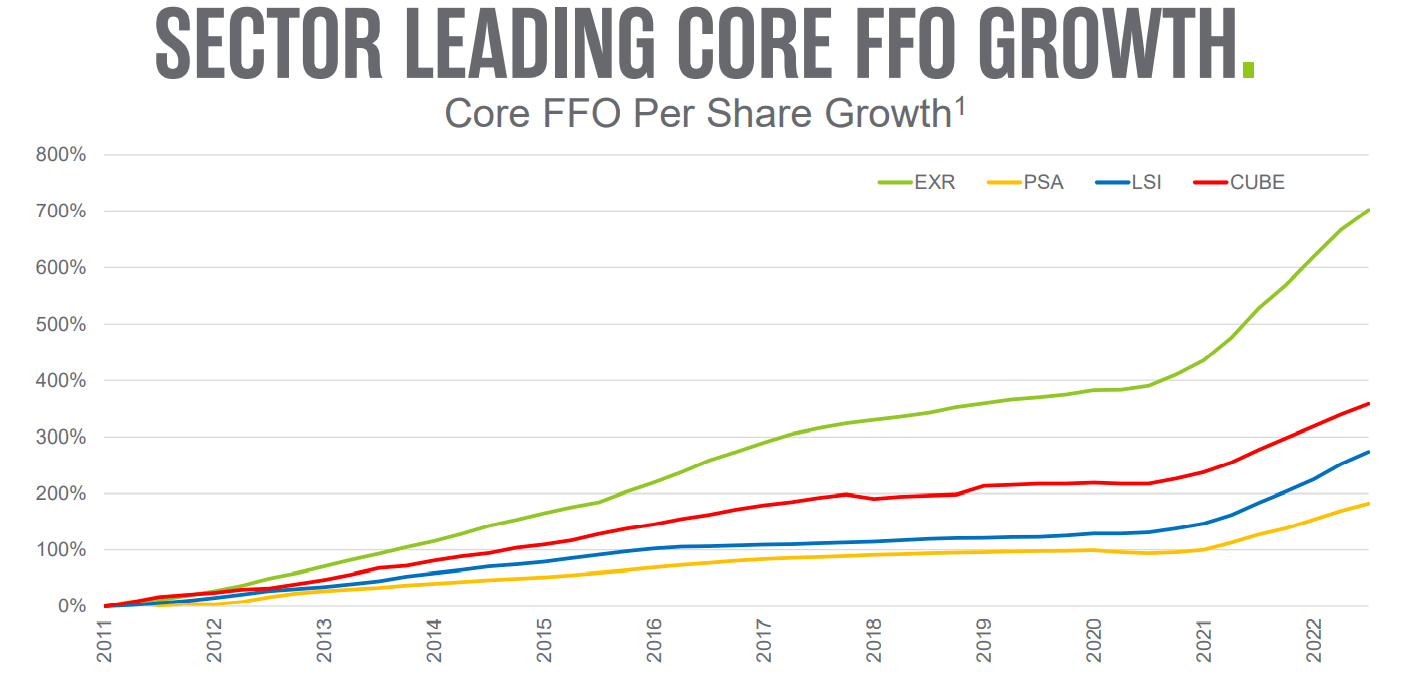
Self-Storage as a whole should be well positioned to deal with the current inflationary environment compared to many other REIT sectors due to the short duration of their leases, but one thing that separates Extra Space from its self-storage peers is the growth they’ve exhibited over the last decade.
EXR Nov '22 Investor Presentation
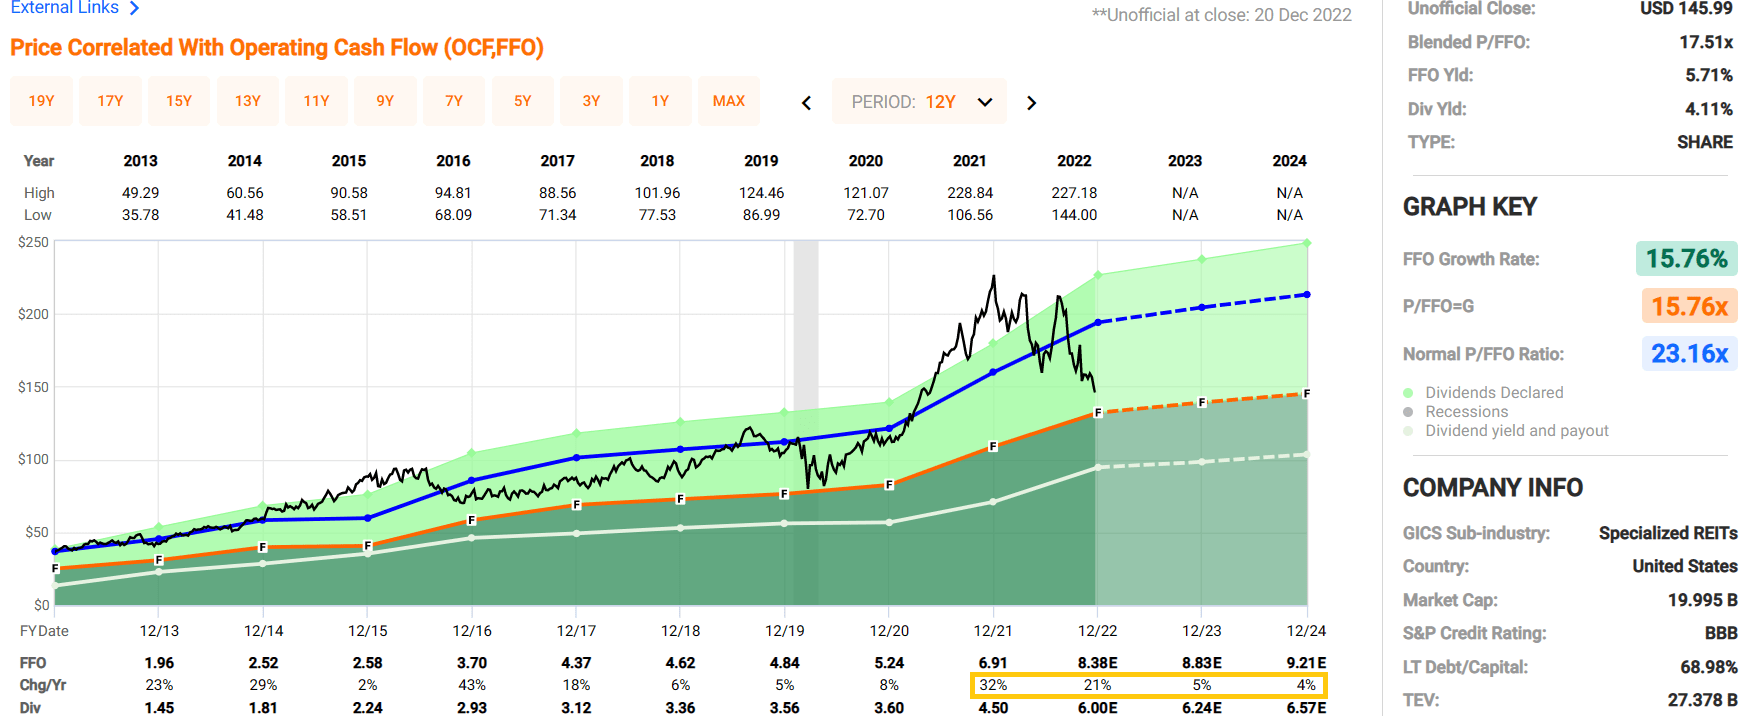
Growth rates have really taken off since the pandemic, with FFO growth rates of 32% in 2021 and 21% in 2022. Understandably growth is expected to decelerate back to normal levels over the next several years, but even then, Extra Space has historically grown FFO by 15.76% annually over the 12-year period shown below.
FAST Graphs
Speaking of growth, Extra Space has grown its dividend by 650% since 2012 and currently yields 4.11%. The dividend is well-covered with an expected AFFO payout ratio of 74.35% in 2022 which is in line with their historic AFFO payout.
EXR Nov '22 Investor Presentation
For a company that has exhibited such earnings and dividend growth one would expect for it to trade at a premium, but due to the selloff we’ve seen this past year Extra Space trades at an FFO multiple of 17.51x vs. their long-term average FFO multiple of 23.16.
REITNotes (Extra Space FFO multiples)
Extra Space has a strong balance sheet and a dividend yield of over 4% that's well covered. They have exhibited excellent growth and currently trade at one of the lowest FFO multiples in recent years. We rate Extra Space Storage a buy.
iREIT
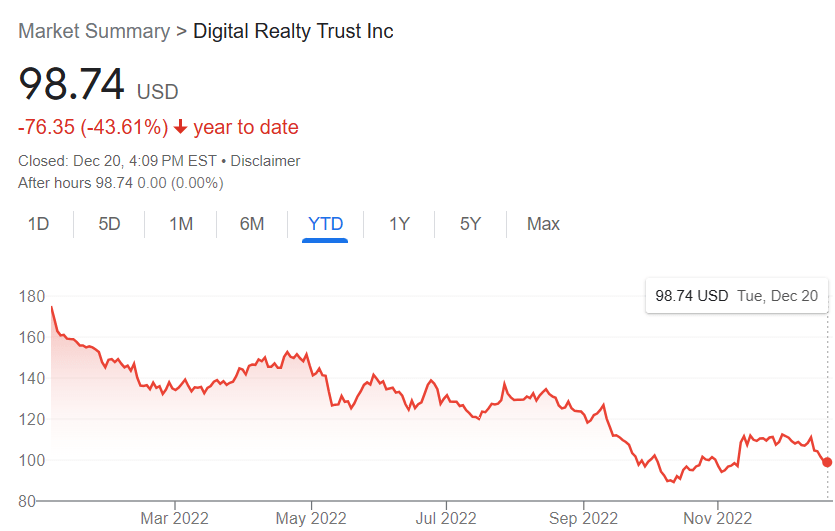
Digital Realty Trust ( DLR )
Digital Realty is a REIT that owns more than 300 data centers with more than 4,000 customers around the world.
Data centers are a key component to the digital infrastructure that's becoming increasingly important as the world is becoming more reliant on digital information. From cloud computing, data storage, and e-commerce – data centers are a necessary part of everyday life.
DLR 3Q22 Investor Presentation
2022 has been a rough year for Digital Realty as it is down -43.61% year-to-date.
Part of the decline can be attributed to macro factors impacting all companies this year, but there has been additional pressure on Digital Realty as well as other data center REITs due to the short campaign waged against it by the well-known short-seller Jim Chanos.
The short thesis is basically that hyper-scalers will go from being data centers' largest tenants to becoming their largest competitors.
While this has been a possibility for the last decade and could potentially be a headwind in the future, nothing in the numbers currently support the short thesis. This is evidenced by the historical bookings Digital Realty has experienced in the third quarter of 2022.
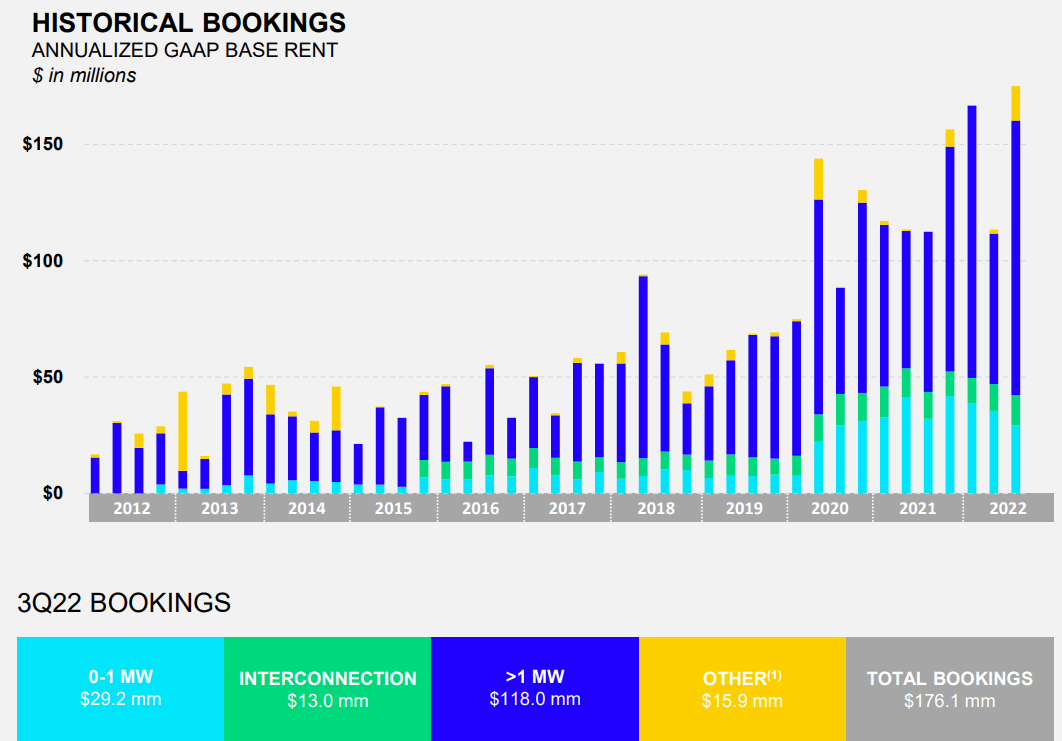
DLR 3Q22 Investor Presentation
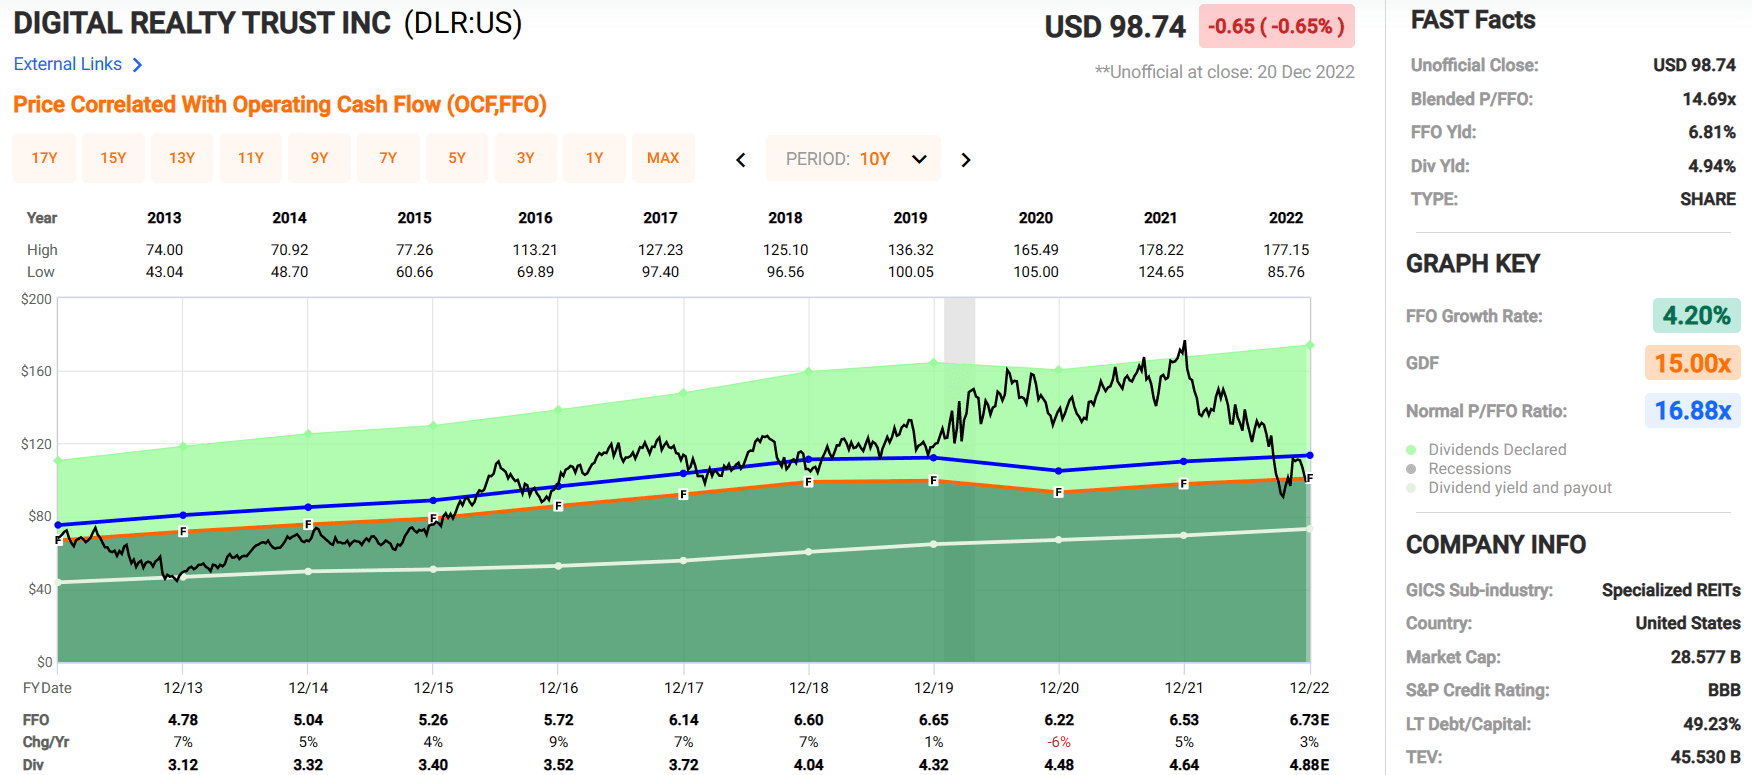
Digital Realty has had steady growth in its funds from operations, averaging a growth rate of 4.20% over the last 10 years.
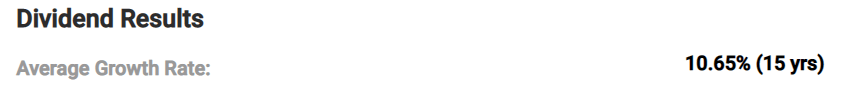
It’s also had consistent dividend growth with 17 consecutive years of increases with an average growth rate of 10.65% annually over the last 15 years. The dividend yield is just under 5% currently and is well covered with an expected AFFO payout ratio of 77.46% in 2022.
FAST Graphs
FAST Graphs
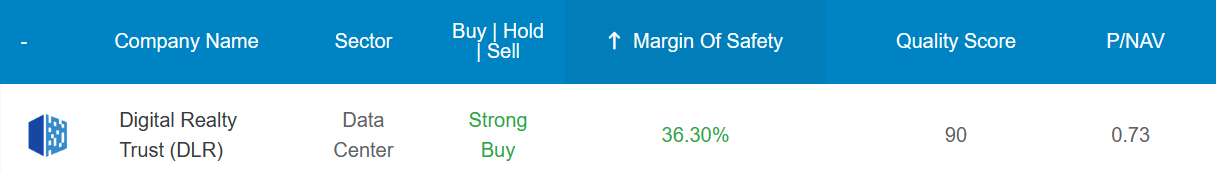
Digital Realty currently trades at an FFO multiple of 14.69x vs its 10-year average FFO multiple of 16.88 and it’s currently trading at a significant discount to its Net Asset Value with a P/NAV of 0.73.
Given the necessity of data centers, Digital Realty’s historic bookings, the wide margin of safety, and their enviable dividend record – we rate Digital Realty a strong buy.
iREIT
Boston Properties ( BXP )
Boston Properties is an internally-managed REIT and is one of the largest office REITs with 193 properties and a market cap of 10.5 billion. They own and develop first-class office properties and have a substantial presence in Boston, New York, Los Angeles, San Francisco, and Washington, D.C.
The only REIT in the office sector will a larger market capitalization is Alexandria ( ARE ) but ARE is somewhat of an outlier in that they are more of a Lab / Life Science REIT as opposed to the more traditional properties in the office sector. Think lab coats and beakers as opposed to cubicles.
The reason I bring this up is that size and scale matters, especially in real estate as this is one of the main areas that provide a competitive advantage. As shown below there is a significant drop off in market cap after Boston Properties with the next highest being Kilroy Realty with a market cap of 4.5 billion.
iREIT
Office REITs have struggled in 2022 as there's a lot of uncertainty in what the future holds for the sector. It’s difficult to gauge the health of an office REIT by vacant properties alone since many of the long-term leases are still being honored.
The concern is what happens when leases expire – how much space will companies lease going forward. Well, we can’t predict the future, but from the most current numbers we have, Boston Properties’ new lease signings look to be in good shape.
Leases totaling 1.4 million SF were signed in the third quarter with a weighted average lease term of 9.8 years, while 6.3 million SF were signed over the last four quarters. I don’t think the companies signing these new long-term leases see the imminent demise of the office sector.
BXP 3Q22 Investor Presentation
Another thing to point out is that many of the existing leases are very long term with the remaining lease terms averaging 10.4 years for their top 20 tenants. The duration of these leases should provide a level of stability in earnings to help Boston Properties navigate the challenges presented by the work-from-home movement.
BXP 3Q22 Investor Presentation
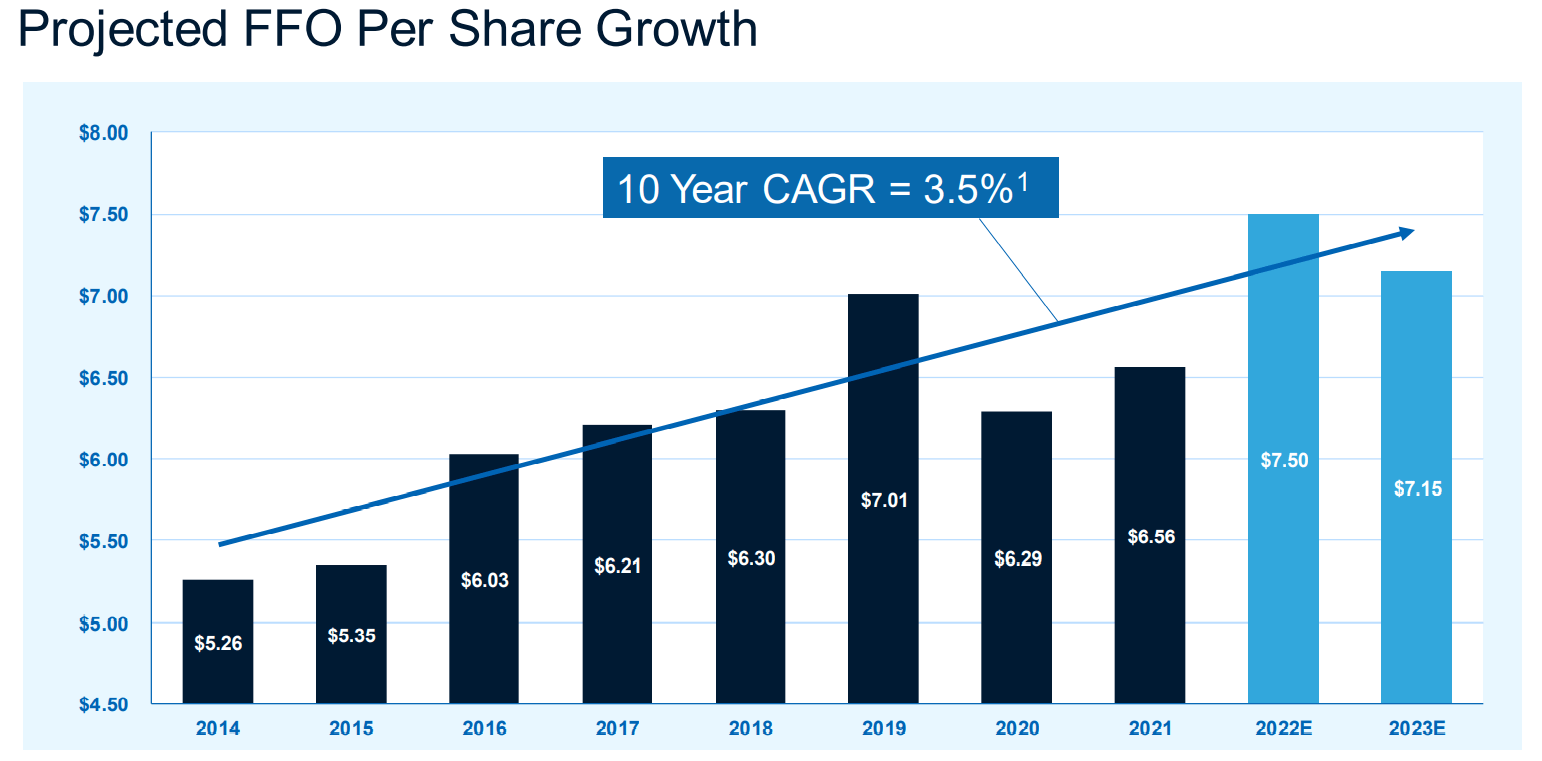
Boston Properties funds from operations took a hit in 2020 from the pandemic but growth resumed in 2021 and the FFO per share in 2022 and 2023 are expected to be above the 2019 pre-pandemic levels.
BXP 3Q22 Investor Presentation
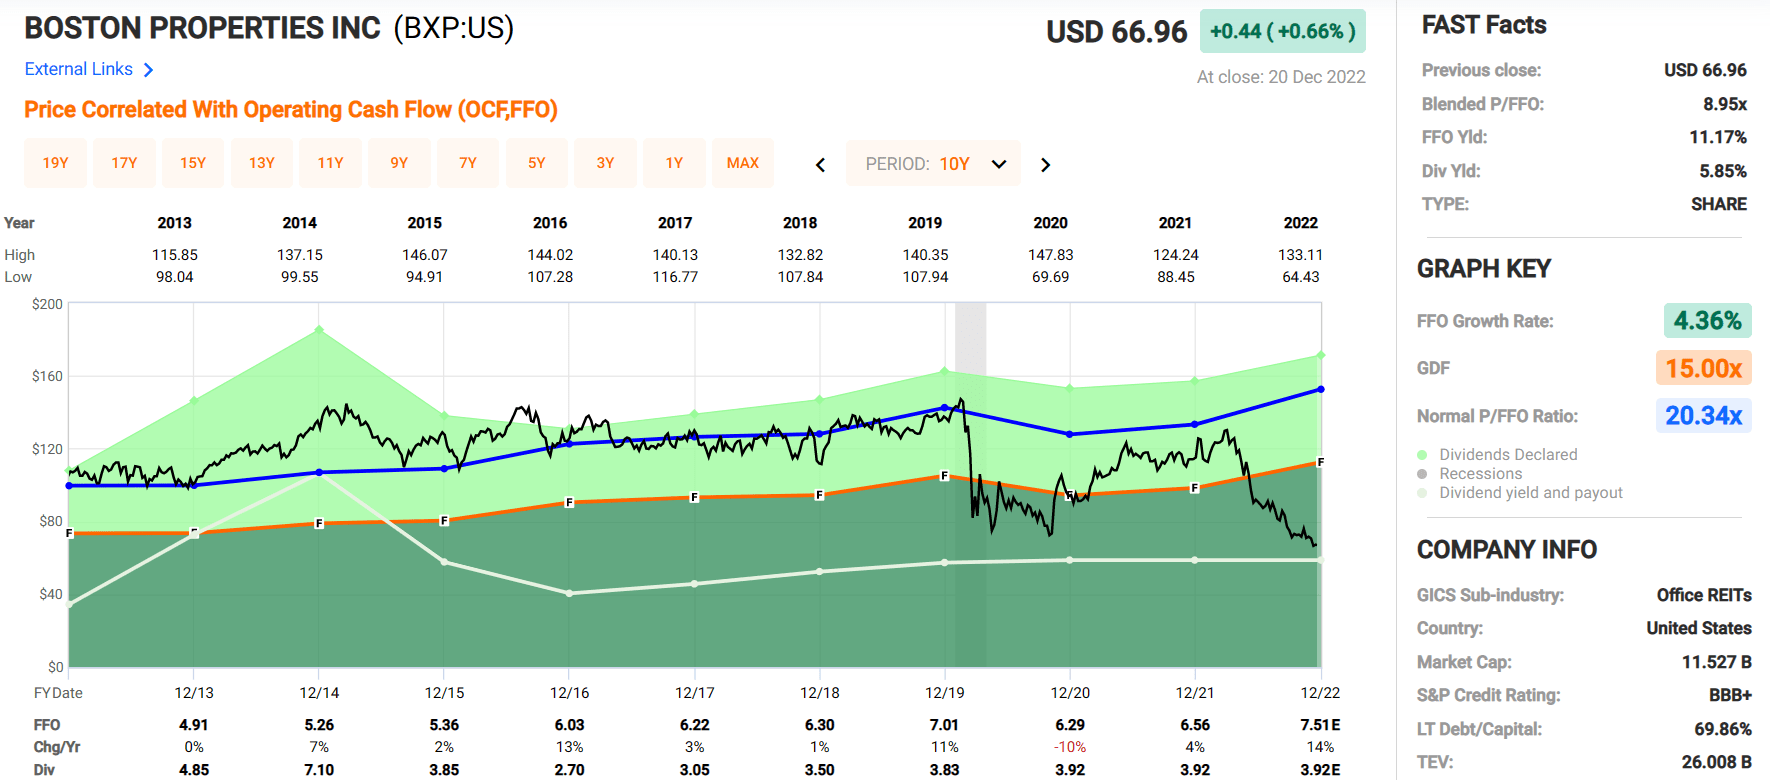
While funds from operations have been steadily increasing since 2020, the FFO multiple has seen a drastic compression. In 2019, when FFO per share was $7.01 the stock averaged a FFO multiple of around 20x.
In 2022 the FFO per share is expected to come in at $7.51 but the company now trades at an FFO multiple of just 8.95x. Due to the discount it’s currently trading at, Boston Properties has a dividend yield of just under 6%.
REITNotes (BXP FFO multiples)
The market tends to overreact in both directions, whether it be too much euphoria or pessimism. There are real challenges facing the office sector, but I believe the pessimism has gone too far when it comes to office properties.
Maybe the office sector won’t be able to sustain pre-pandemic levels of occupancy, maybe they will, but the market has priced office REITs like they're all but certain to fail or at least have negative growth for the foreseeable future.
I just don’t see that in the numbers which could make this a very opportunistic entry point for Boston Properties. We rate Boston Properties as a strong buy.
FAST Graphs
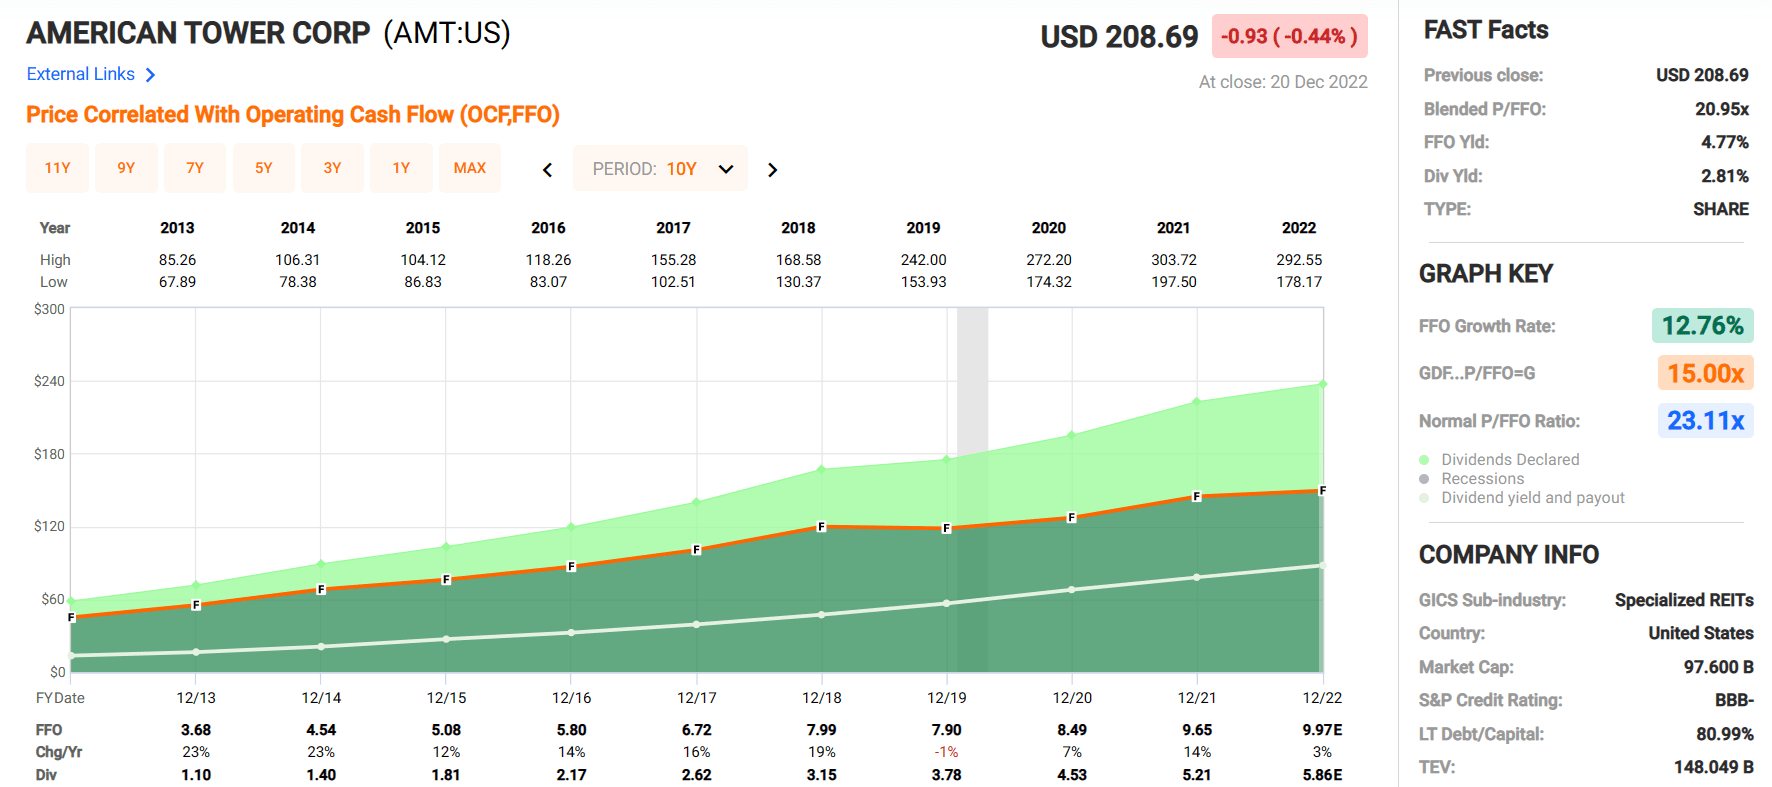
American Tower Corp ( AMT )
American Tower is a REIT that owns and develops cell towers. It's critical infrastructure that allows everything from e-commerce to talking on the phone. As we continue further into the digital age and with the rollout of 5G there are many tailwinds to support future growth.
I removed the price and normal PE from the chart below just to emphasize the rate and consistency of earnings and dividend growth. American Tower has increased FFO at an average rate of 12.76% over the last 10 years and has increased its dividend roughly 20% over that same time. It looks like a smooth ramp, barely phased by the pandemic.
FAST Graphs
The dividend yield is currently 2.81% and is exceptionally well covered with an AFFO payout ratio of just 53.99% in 2021 and an expected AFFO payout of just 58.65% in 2022. This low payout should provide more than enough room for future dividend growth.
FAST Graphs
American Tower’s credit metrics have improved across several categories since 2021 with their leverage improving to 5.5x from 6.8x, their liquidity improving by about a billion and a larger percent of their debt is now at a fixed rate. This should set them up well coming into 2023.
American Tower 3Q Investor Presentation
American Tower currently trades at an FFO multiple of 20.95x which is a discount compared to their 10-year average FFO multiple of 23.25. While this discount is not as pronounced as some of the others in this list, buying at the current multiples could provide a total annualized return of 15.52% if the stock trades back up to its historic FFO multiples. We rate American Tower a buy.
FAST Graphs
Medical Properties Trust ( MPW )
MPW is a healthcare REIT and one of the largest owners of healthcare real estate assets, and they own more than 400 hospitals and 46,000 licensed beds. The well-diversified portfolio spans across 32 different states in the U.S., as well as countries across Europe, Australia, and South America.
Hospitals account for a majority of operator income, and MPW’s target is to focus on things like Rehab Centers, Imaging Centers, FSEDs, ASCs, Labs, Managed care networks, MD offices and outpatient clinics, all strategically placed to hospital real estate.
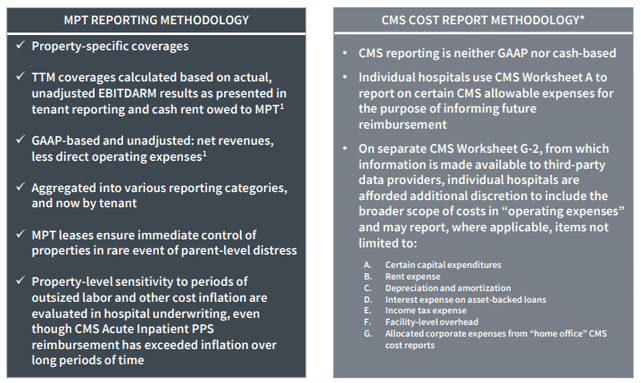
Underwriting is core to MPW. The company needs to be able to identify and purchase attractive assets at good prices in a way that means they can lease it to operators at a good profit. They do this in a variety of ways and by measurements.
MPW Investor Presentation
Hospital real estate is usually stays leased for extensive periods of time, and they’re considered inflation-protected cash flows, due to permanently increased cash lease rates in any year when the inflation escalation exceeds the minimum contractual increase.
At the end of Q3-22 MPW had cash and revolver capacity of around $1.5 billion and recently the company restated and amended its $2 billion revolving credit facility and extended its term to mature with extension options to June of 2026.
In addition to the $1.5 billion, MPW previously announced it expected proceeds in 2023’s first half from pending transactions that is Springstone and Yale, of up to another $650 million.
MPW generated normalized FFO of $0.45 per diluted share in Q3-22 and refined its 2022 calendar year estimate to a range of $1.80 to $1.82 per share (narrowing the previous range to the higher end). While MPW has obviously slowed its recent years acquisition pace, the company should still maintain solid organic growth.
As seen below, analysts are forecasting no growth in 2023 and 2% (growth) in 2024. Shares are now trading at $10.75 with a P/AFFO multiple of 7.6x. Prior to COVID-19 shares were trading at around 12x to 13x. The dividend yield is 10.8% and the payout ratio is 82%. We forecast MPW could return “conservatively” 25% over the next 12 months.
FAST Graphs
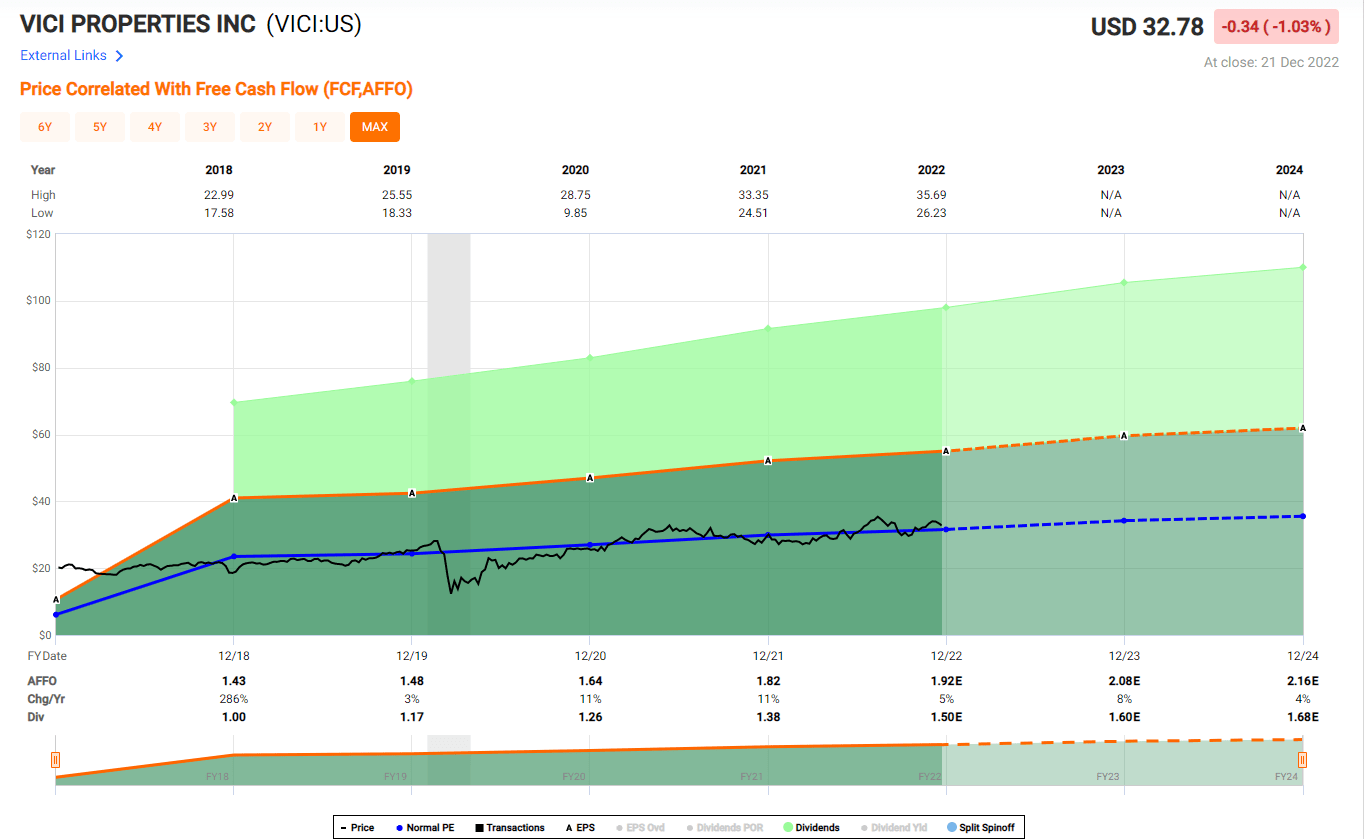
VICI Properties ( VICI )
VICI Properties is a REIT that primarily engages in the business of owning, acquiring, and managing gaming, hospitality, and entertainment destinations. Their portfolio includes impressive names like Caesar Palace Las Vegas, Harrah’s Las Vegas, and Venetian Resort.
The weighted average remaining lease term is a whopping 43.7 years.
Not only that, but VICI owns about 34 acres of undeveloped or underdeveloped land near the Las Vegas Strip, which can be monetized when the time is appropriate.
VICI Investor Relations
VICI has a strong capital structure and ample liquidity to further improve their already impressive portfolio. Their LQA net leverage ratio is 5.8x. They have revolving credit facility capacity of $2.5 B, and delayed draw term loan capacity of $1.0 B. Their total liquidity capacity is an impressive $4.7 B.
With this strong capital structure and great liquidity, they won’t have any trouble supporting their acquisition and development plans in the future. I expect them to maintain their leadership position in the gaming and hospitality industry.
Management described the 3Q 2022 results as demonstrating “realization and continuing activation.” By realization, they mean growth since 2021, and by activation, they mean continuing investment in the non-gaming segment.
Revenue grew by 100% compared to the same quarter in 2021, and the impact from the acquisition of the Venetian and MGP was a large part of the growth. AFFO grew by 83% YoY, and AFFO per share grew by 8.5% YoY.
The growth in AFFO was followed by a dividend increase of 8.3%, which has resulted in a dividend growth rate of 8.2% CAGR since 2017 for VICI.
Also, VICI’s 4.7% dividend yield is safe at this point, shown by cash dividend payout ratio of 61.47% and AFFO payout ratio of 79.46%.
VICI is currently undervalued. P/AFFO of 18.02x and P/FFO of 15.73x is about 10% lower than their historical average. The iREIT ratings tracker shows that the margin of safety for VICI is at 7%.
FAST Graphs
In Closing…
As per Cohen & Steers ,
Investors have priced in a negative, forward-looking view of listed real estate. Slowing growth and higher inflation have created a stagflationary backdrop that has been especially challenging for REITs.
The result is that there has been a dramatic performance difference between listed and private real estate in 2022.
While REITs, as measured by the FTSE Nareit All Equity REITs Index, are down -27.9% through September and down -21% through November, the NCREIF ODCE index, a measure of private real estate that is calculated quarterly, is up 13% through September on a total return basis.
Based on history, we believe that gap in performance will not persist.”
Cohen & Steers
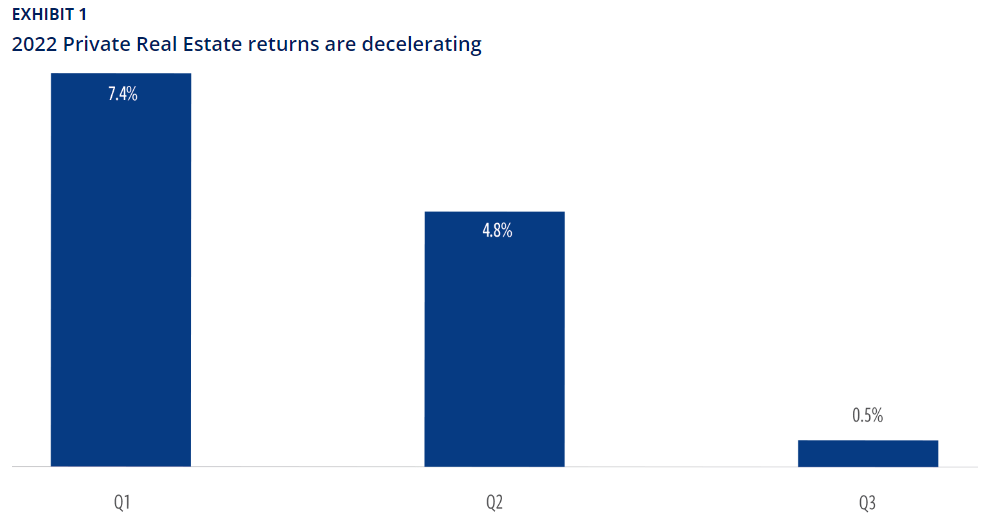
As shown above, private real estate returns are just beginning to slow as expected, and private real estate typically lags listed real estate due to its slower-moving price discovery and transactions.
The NCREIF ODCE Index returned just 0.5% in the third quarter, representing a substantial and sequential deceleration from its 7.4% return in Q1 and a 4.8% return in Q2. That’s the second-greatest deceleration since 1978 (Exhibit 1 above).
Now is the time to become overweight listed REITs compared to private. Once again citing Cohen & Steers,
“First, real estate fundamentals are historically strong . Real estate supply vs. demand is tight, as indicated by data such as high occupancy rates. We anticipate a deceleration in REIT earnings to reflect a possible recession, but we expect REIT cash flows to be resilient, particularly compared to other asset classes.
Second, listed real estate has historically outperformed in the type of more supportive inflationary backdrop we can now see on the horizon. That is when the end of the rate-hiking cycle occurs and also when both real yields and growth are down.
While the best returns have been earned during the early cycle, the market still generated 10.8% forward average 12-month returns following a recession (see chart below). And for this cycle we have likely already experienced a majority of this recessionary decline .”
Cohen & Steers
The point here is that REITs have performed remarkably well after periods of downturns .
Cohen & Steers has analyzed recessionary periods dating back to 1990 and this analysis shows that the best returns for REITs have been generated investing during the early cycle.
However investing during the recession has generated forward returns on average of 10.8% which is above long term averages (see above chart).
The forward REIT return of 10.8% outperforms the returns of the equity market of 4.5%. This outperformance continues as we move into the early cycle.
By understanding the leading and lagging behaviors of listed and private markets, real estate investors can tactically allocate at different times.
I wish you all a safe, happy, and prosperous new year.
Remember, the safest dividend is the one that’s just been raised!
Happy SWAN Investing!
iREIT
iREIT
For further details see:
My Top REIT Picks For 2023