VXF - My View Of The S&P 500 November 2023 Edition (Technical Analysis)
2023-11-01 12:56:51 ET
Summary
- I share my plans to reduce allocation in the SPDR S&P 500 ETF to 75% and hold a cash position of 25%.
- My investment performance in October slightly outperformed the S&P 500 index but did not meet my capital preservation objective.
- I cover my moving average crossover system to determine allocation of my pension plan assets and how I'm reducing exposure to SPY due to bearish signals.
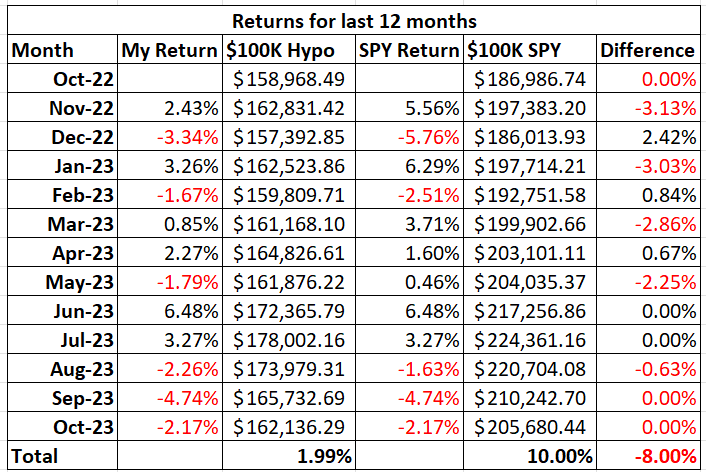
In this month's article, I outline why I will reduce the allocation of my pension plan assets invested in the SPDR S&P 500 ETF ( SPY ) to 75%. I will have a cash position of 25%. First, let me review my pension plan performance in October. The market, as measured by the S&P 500 index, lost 2.20% for the month as can be seen in Chart 1 below. As for my pension plan assets, I outperformed the index as my investment allocation lost 2.17%. My investment objective of preserving my capital was not met as I did not make money. I did meet my second investment objective which is beating the S&P 500 index. Table 1 below shows my returns and allocations for the month of October and Table 2 below shows my returns for the past 12 months.
I have made changes to Table 2 below after I received a comment from a reader. Table 2 shows new columns to better (more accurately) reflect my investment results. The third column, $100K Hypo, is what my returns would be if I started my account with $100,000 in my first article of this series and followed the allocation recommendations from my articles. The fifth column, $100K SPY, shows the returns of just investing $100,000 and keeping it all allocated to SPY. The percentage returns in the last row show that my strategy returned 1.99% for the last 12 months and simply investing in SPY would have returned an even 10% for the last 12 months. Therefore, I have underperformed SPY for the last 12 months by 8.01%. As I've stated before, beating the market is harder than it seems.
Table 1 - Investment Returns for October
Author
Table 2 - Investment Returns Last 12 Months
To review the purpose of this series of articles, my retirement account only allows me to buy the following four ETFs: iShares Core U.S. Aggregate Bond ETF ( AGG ), SPDR® S&P 500 ETF Trust ( SPY ), Vanguard Extended Market Index Fund ETF Shares ( VXF ), and iShares MSCI EAFE ETF ( EFA ). I can also have my money in cash. The question is how to decide where and when to allocate money to these various ETFs.
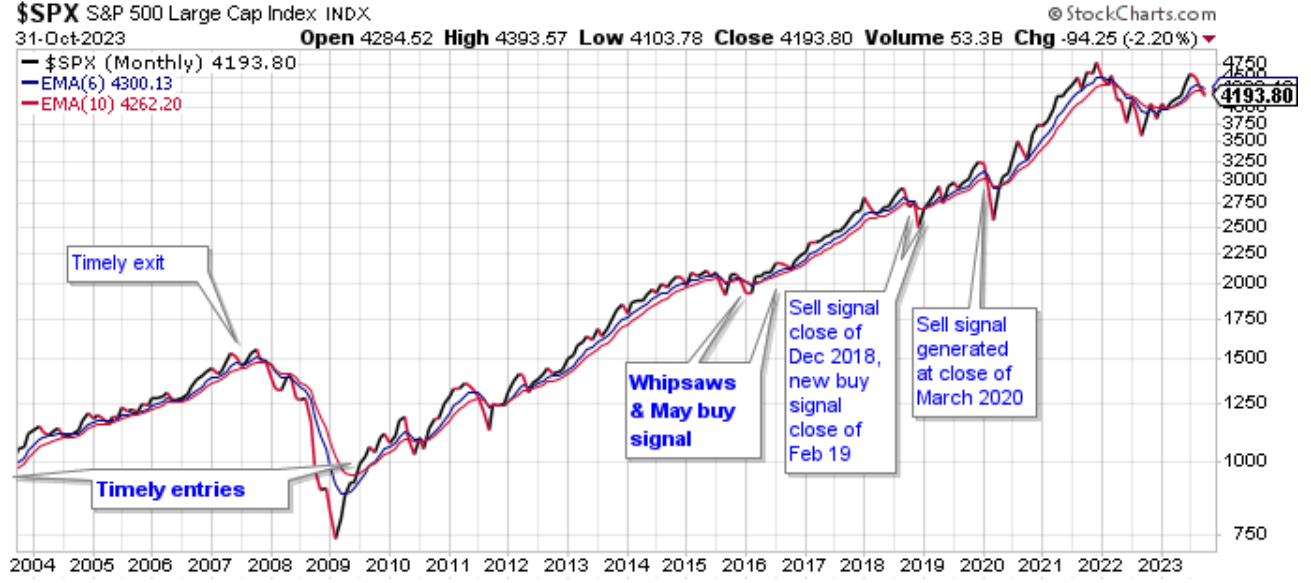
I use my moving average crossover system combined with relative strength charts to determine how to allocate my pension plan assets. My moving average crossover system uses the 6-month and the 10-month exponential moving averages to identify which of the four ETFs are in position to be bought. If the 6-month moving average is above the 10-month moving average, then the ETF is a buy. I call this setup being in bullish alignment. When the 6-month moving average is below the 10-month moving average the setup is referred to as a bearish alignment. When a bearish alignment happens, I don't want to hold that asset. See Chart 1 below for a long-term look at the S&P 500 index using my moving average crossover system.
Chart 1 - Monthly SP 500 Index with 6/10 Moving Averages
You can see that the moving average crossover system provided some excellent long-term buy and sell signals that would have allowed investors to capture long-duration moves in the index; while avoiding costly drawdowns. Avoiding these costly drawdowns allows me to meet the objective of capital preservation.
I employ this strategy because I do not want to experience a large drawdown with my pension assets. During the 2008 - 2009 market crash many people didn't even look at their retirement statements because they were afraid of what they would find. I submit that if those people would have used a market strategy like what I outline in this series of articles, they would have been able to avoid much of the decline during the bear market and consequently would have had less emotional stress during that time.
The following charts show the status of the ETFs that I am allowed to buy in my retirement account.
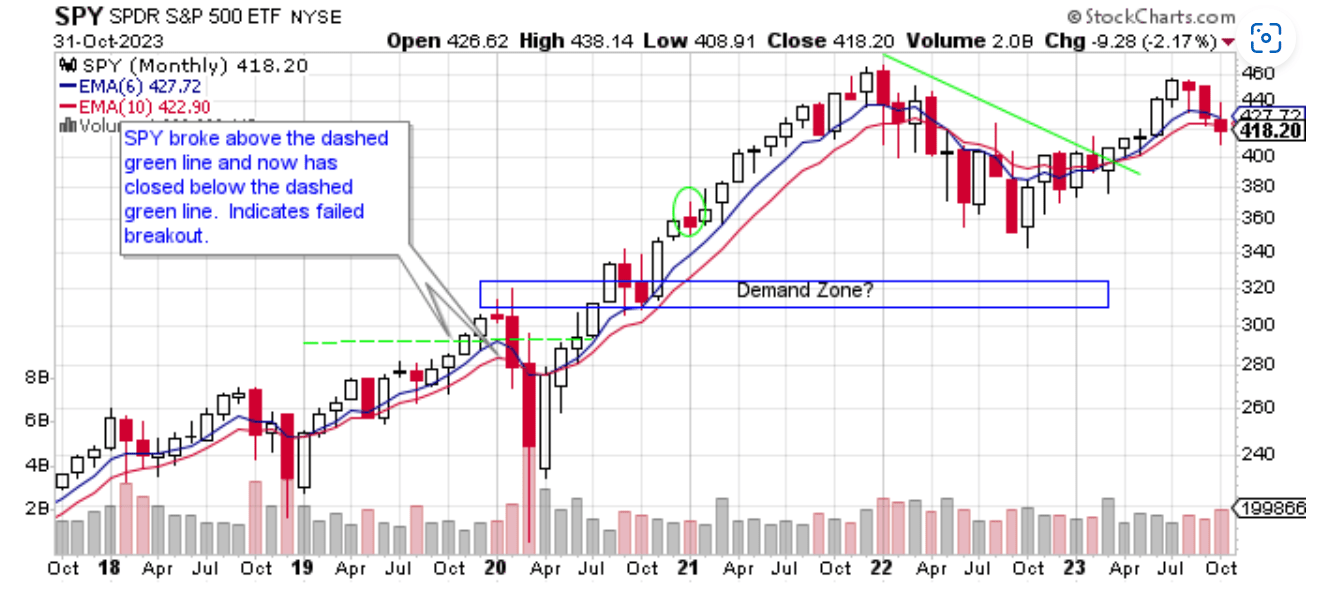
Chart 2 - Monthly SPY with 6/10 Moving Averages
Chart 2 shows that SPY lost 2.17% in October. SPY closed October below both moving averages. It is not in bearish alignment as the blue 6-month moving average is still above the red 10-month moving average, yet the chart does look bearish. SPY tried to make a run at new highs starting in October of last year but failed to get back to the $460 level. Now SPY looks like it is rolling over. That is why I am reducing my exposure to SPY this month to 75%. I will keep 25% in cash and see how the market does in November. After all, November does start the seasonally bullish period for stocks. Maybe things will get better but for now I am respecting the close below the red 10-month moving average.
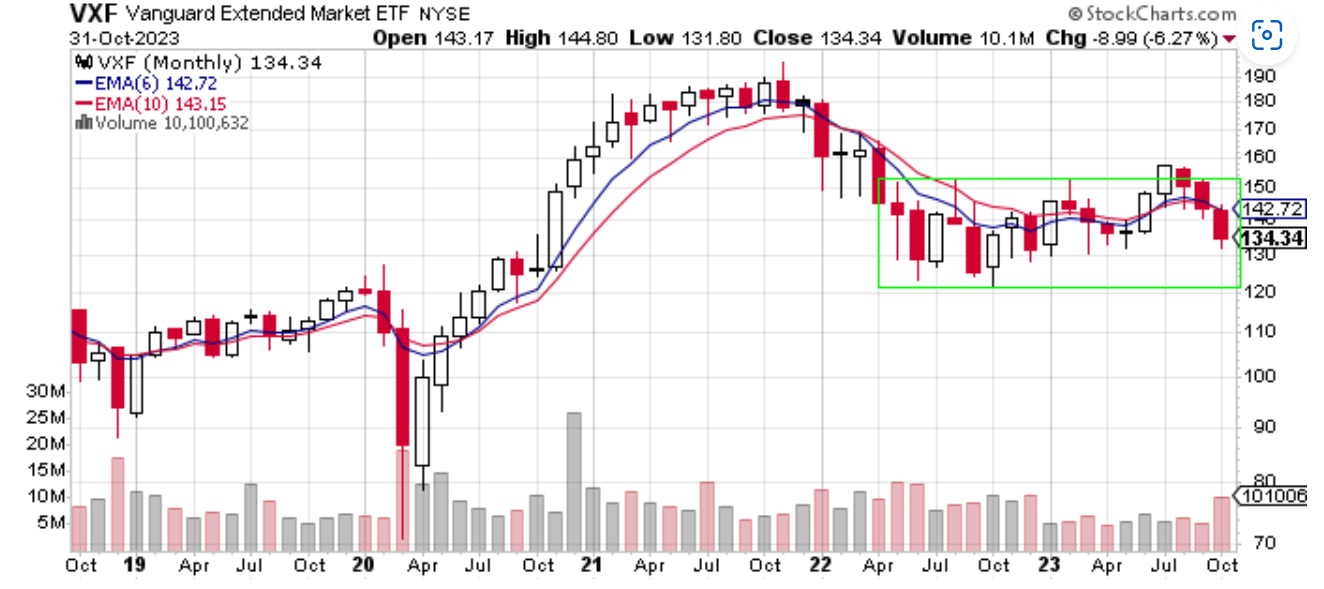
Chart 3 - Monthly VXF with 6/10 Moving Averages
Chart 3 shows that VXF fared poorly in October closing down 6.27%. VXF is now in bearish alignment. It is below both moving averages while the blue 6-month moving average is below the red 10-month moving average. VXF remains in that green box of consolidation. The question is will VXF resolve itself by breaking higher or lower out of this area of consolidation? It would not surprise me to see VXF get to the bottom of the green box and at least touch the $120 price level.
Chart 4 - Monthly VXF:SPY Relative Strength
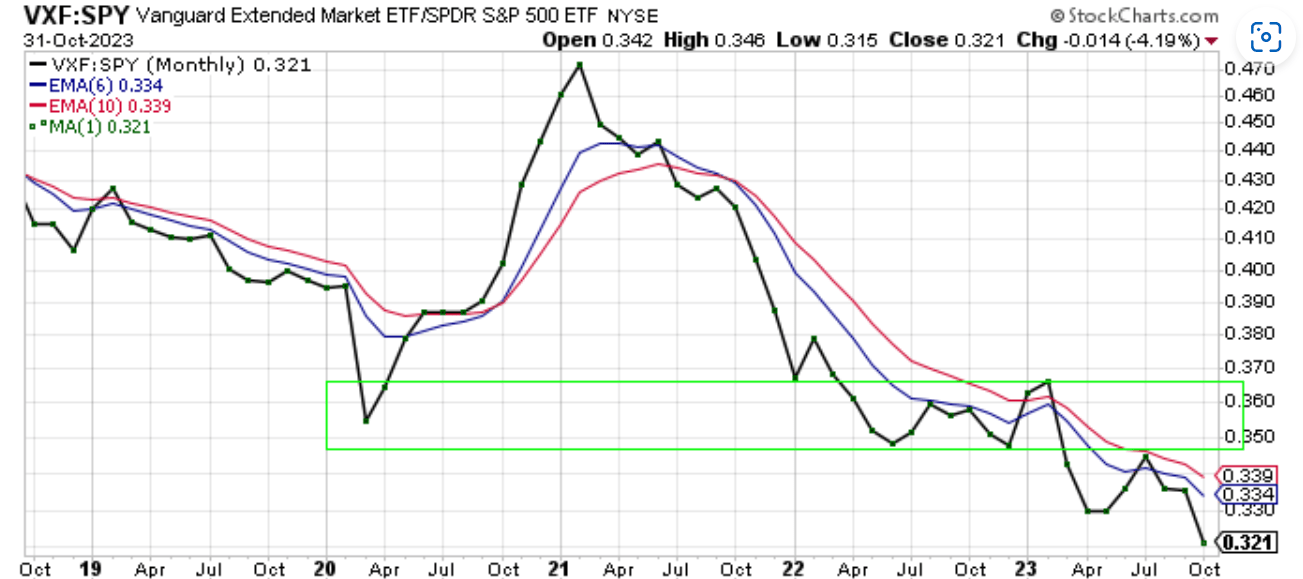
The VXF:SPY ratio lost 4.19% in October as shown in Chart 4. The ratio is in bearish alignment telling me that there is no need to allocate money to VXF over SPY currently.
Chart 5 - Monthly EFA with 6/10 Moving Averages
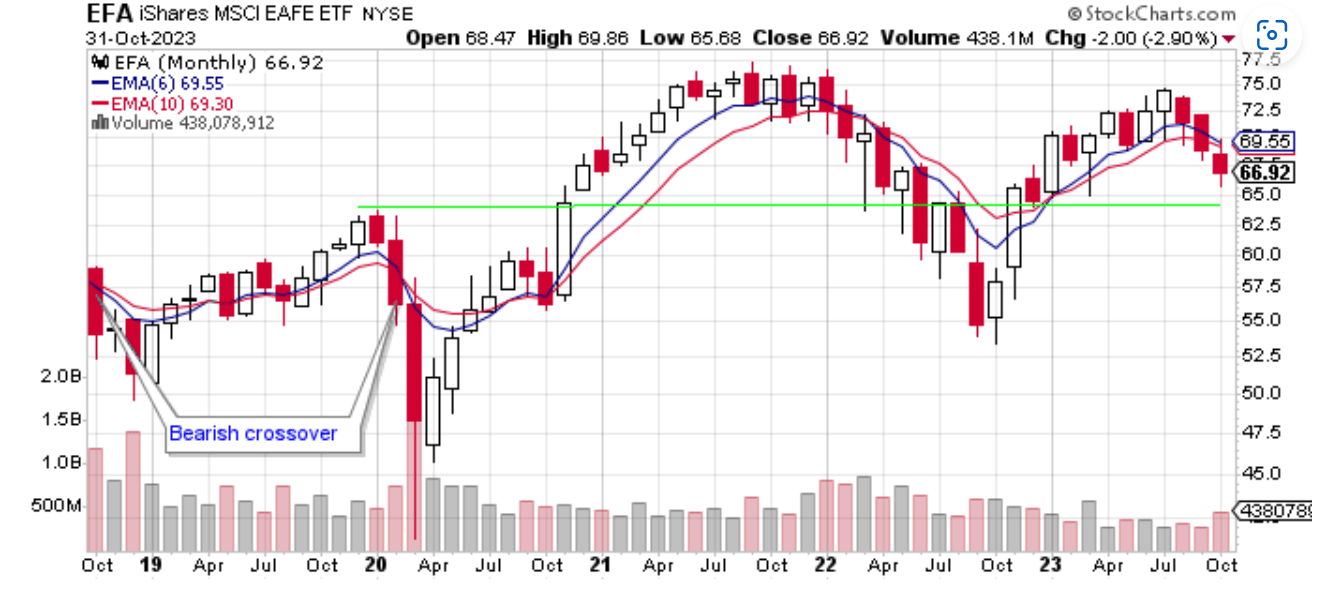
Chart 5 shows EFA lost 2.90% in October. EFA's chart looks like SPY's chart. Both closed below their red 10-month moving average, which is bearish. Also, both are not yet in bearish alignment. Lastly, both tried to make a run at new highs but now appear to be rolling over. The green line represents a level of support around $64. Only time will tell if this level gets tested and if it will hold.
Chart 6 - Monthly EFA:SPY Relative Strength
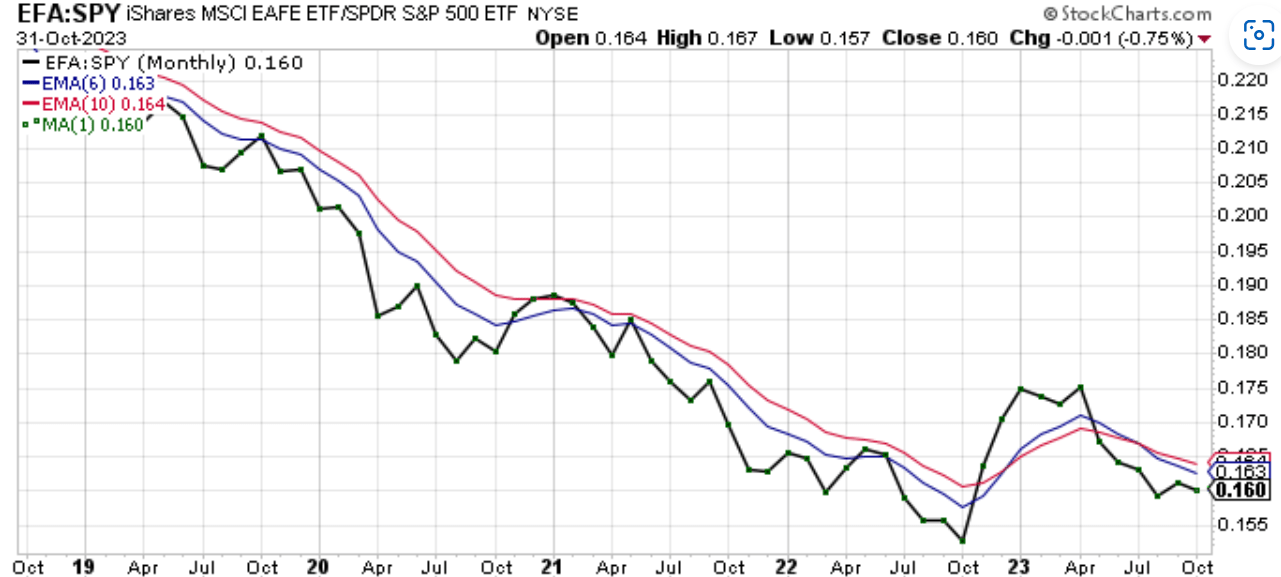
Chart 6 shows that the EFA:SPY ratio lost 0.75% in October. The ratio trades below both moving averages and is not in a position of strength. The ratio is in bearish alignment. On the positive side of things, the ratio may be putting in a higher low. Still, there is no reason to be in EFA versus SPY.
Chart 7 - Monthly EFA:VXF Relative Strength
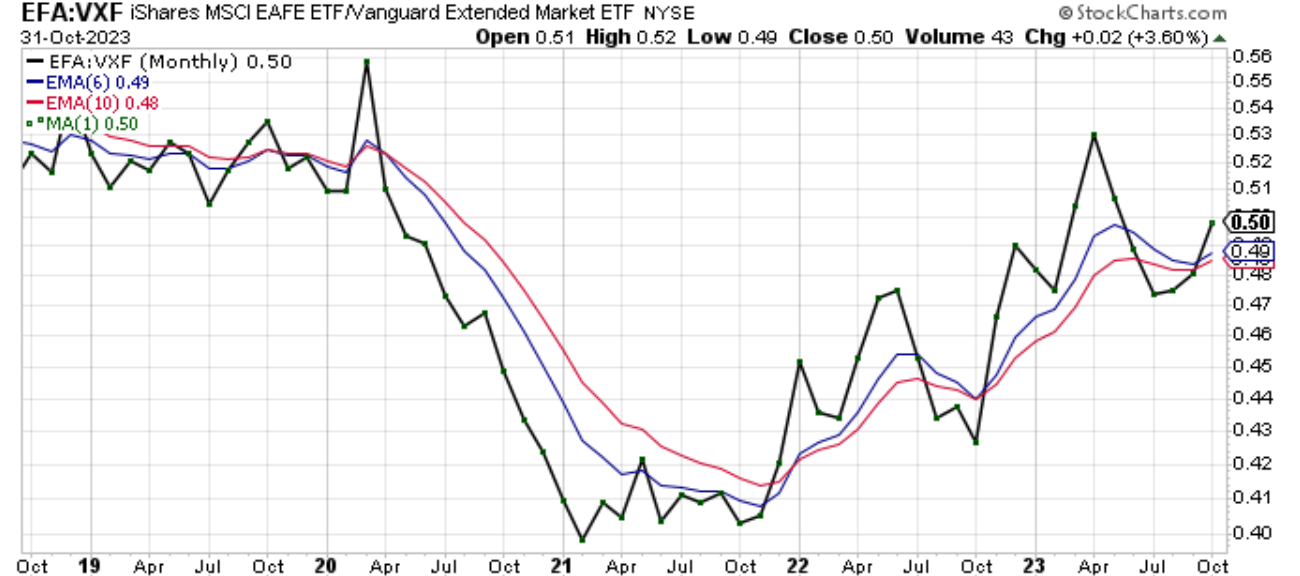
Chart 7 shows that EFA outperformed VXF in October by 3.60%. The ratio is now in bullish alignment. The ratio is above both moving averages and the blue 6-month moving average is above the red 10-month moving average. The ratio is in a clear uptrend yet there is no compelling reason to be invested in EFA as shown in Charts 5 and 6.
Chart 8 - Monthly AGG with 6/10 Moving Averages
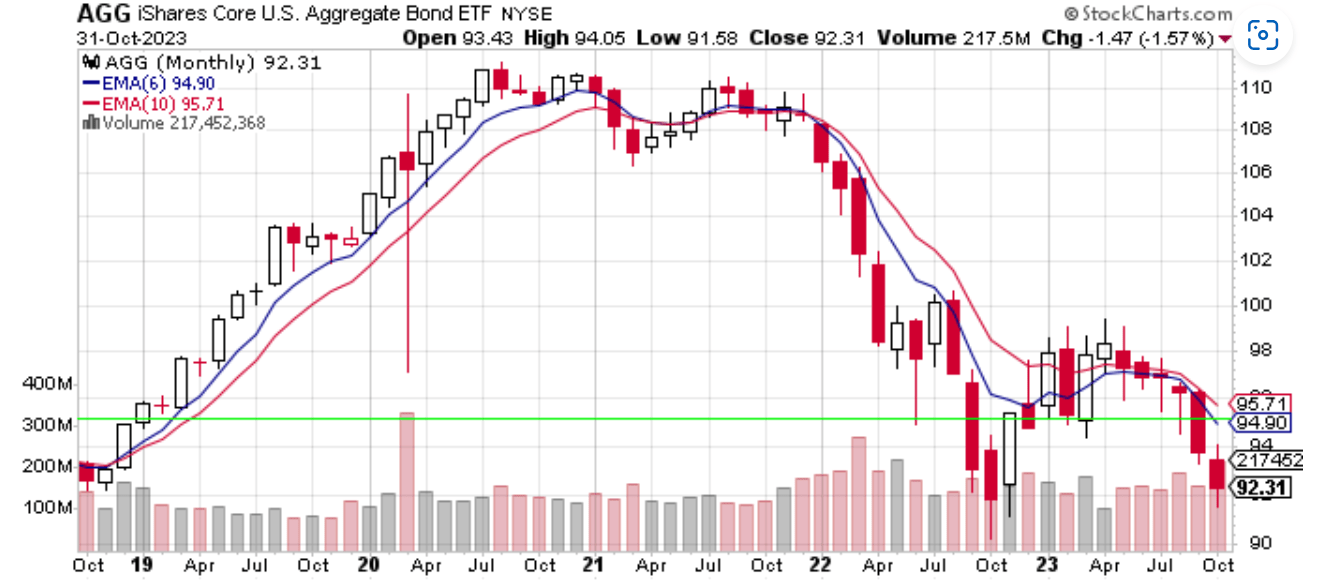
Chart 8 shows that AGG lost 1.47% in October. Every ETF in this article lost money in October. AGG remains below the area of consolidation going back to May 2022. AGG trades below both moving averages and is in bearish alignment. That does not bode well for AGG moving forward. Perhaps AGG will test the October 2022 lows of $91.50 level. I will have no exposure to AGG in November.
Chart 9 - Monthly AGG:SPY Relative Strength
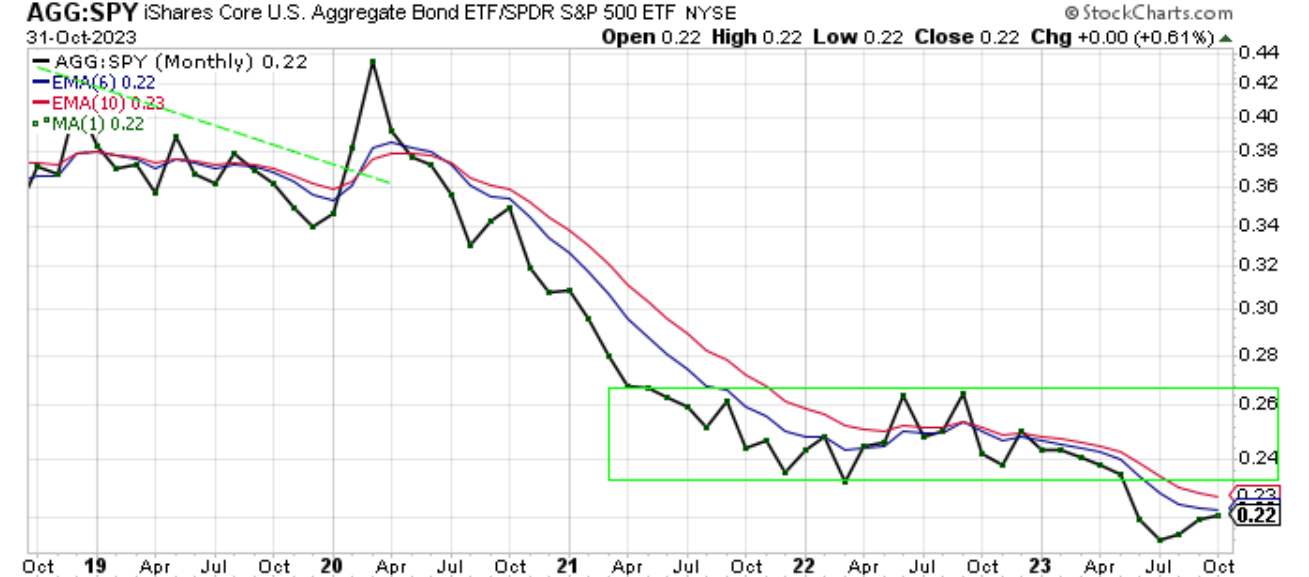
The AGG:SPY ratio in Chart 9 gained 0.61% as AGG outperformed SPY in October. The ratio is in bearish alignment and is trading below the area of consolidation as shown by the green box.
In summary, October was a bad month for me and equity investors in general. Bond investors didn't fare well either. I lost money for the month, yet I outperformed the major index. Every ETF that I follow for this article lost money in October and every ETF is below their red 10-month moving average. The market looks weak right now. The charts aren't shown in this article, but SPY is below its 10-day, 20-day, 50-day, 200-day, and 30-week moving averages. It's a bearish trend no doubt. The question is how long it will last. Right now, I will respect the close below the red 10-month moving average and take some money off the table. That is what my system tells me to do. As I mentioned previously, November is the beginning of the seasonally bullish period for stocks. Will this season be an exception, or will November bring us back to positive gains? I will continue to monitor these charts and trade accordingly.
For further details see:
My View Of The S&P 500 November 2023 Edition (Technical Analysis)