MYRG - MYR Group: Classic Low-Margin High Capital Turnover Business With Production Advantages
2023-09-20 23:55:20 ET
Summary
- MYR Group is a low-margin, high-capital turnover business operating in the electric utility infrastructure and construction markets.
- The company had record sales and backlog in H1 FY'23, indicating strong demand and growth potential.
- MYRG's economic value is demonstrated by its high returns on capital and capital efficiency, allowing for potential future growth and shareholder returns.
- Net-net, rate buy.
Investment Briefing
MYR Group ( MYRG ) presents with the economic value machine that can throw off piles of cash to shareholders going forward in my view. MYRG operates through its subsidiaries in the electric utility infrastructure, commercial and industrial construction markets, being one of the largest contractors in the U.S. transmission and distribution business.
Critically, MYRG is a classic low-margin/high capital turnover business. It enjoys production advantages that enable it to price its offerings below industry averages, seeing each $1 of invested capital pull in plenty of new revenues each period and enjoy a robust competitive position. Additionally, H1 FY'23 saw (i) record sales towards the end of the half, and (ii) record backlog to work through into the coming periods. Net-net, I rate MYRG a buy, eyeing a valuation band of $161-$184/share based off 7% sales growth into the coming 12-24 months.
Figure 1.
Key risks to investment thesis:
Investors must know these risks in full before proceeding:
- Macroeconomic headwinds cannot be ignored as further economic tightening could limit MYRG's propensity to work through its backlog.
- Commercial real estate markets have taken a blow the last 12 months, which could slow demand for electric utilities.
- Energy prices are still at the helm of points (1) and (2) above, and there's no saying what this could mean for contractors of electric utilities going forward. The uncertainty is a potential risk.
These risks must be understood in full before proceeding any further.
Critical investment facts pattern underlining buy thesis
1. Q2 FY'23 insights-record revenues and record backlog
- Top-line and divisional breakdown
MYRG put up Q2 revenues of ~$889mm, up 25% YoY, on core EBITDA of $47mm. For H1 '23 it booked revenues of $1.7Bn, which is a 26.4% increase compared to the previous year on gross of ~$175mm. This came on a margin compression of ~170bps, secondary to a hike in labour rates and certain weather events that impacted costs during the first half. It pulled this to Q2 earnings of $1.33/share. The Q2 FY'22-'23 walk through along with the H1 FY'23 breakdown is observed in Figure 2.
As to the divisional breakdown:
- Its transmission & distribution ("T&D") arm did $504mm of business in Q2, up 21% YoY. Of this, $322mm came from transmission, and $181mm came from its distribution projects. H1 T&D revenue amounted to $949.1mm, also up ~21% YoY. Growth was underscored by demand in renewables-a trend which MYRG is surfing nicely as we coast through the remainder of '23.
- Commercial and industrial ("C&I") revenues were at $385mm for the quarter and $751.2mm for the half, growing 31% and 33% respectively. Again, growth was underscored by revenue generated from its clean energy projects. MYRG had seen a number of headwinds in its C&I business given the supply chain fiasco of '22. Management is confident these will be resolved in full by yearend, early next year at the latest.
- Backlog and gross margin
By the end of Q2, MYRG's total backlog hit a new high of $2.73Bn, increasing 12% compared to last year. This backlog was divided into $1.18Bn for the T&D segment and $1.55Bn for the C&I segment (43% and 57%, respectively). To me this is good evidence of the demand across its entire portfolio. Regarding the workflow downstream, the COO mentioned on the call that "on the T&D front, our MSA work continues to be about 50% of the revenue that we produce each quarter. And we like that growth we're seeing on that side...[o]n the C&I side, there was no huge projects in any one area. I would say it was a steady flow of projects in kind of all our core markets...". It would thus appear that management envisions it will mine the backlog pipeline at a reasonable pace given the demand in both of operating segments.
BIG Insights
2. Economic value clearly on show
MYRG's gross-to-net profit margins are thin as a function of revenues. But as a percentage of the resources required to produce its profits/cash flows, the picture is far more attractive. In investment terms, I'd argue this is a cleaner way to understand the economic value in MYRG's arsenal.
Figure 4 depicts this at the gross level, outlining the gross profit earned per $1 of assets employed in the business. All core and non-core assets are included here. Critically, MYRG is returning $0.24 on the dollar for each unit of assets, having slimmed this number from FY'21 highs of $0.30. A range of $0.25-$0.30 is considered high. Alas, whilst asset density has increased ~$470mm these past 2.5 years, gross productivity has stayed within a tight range.
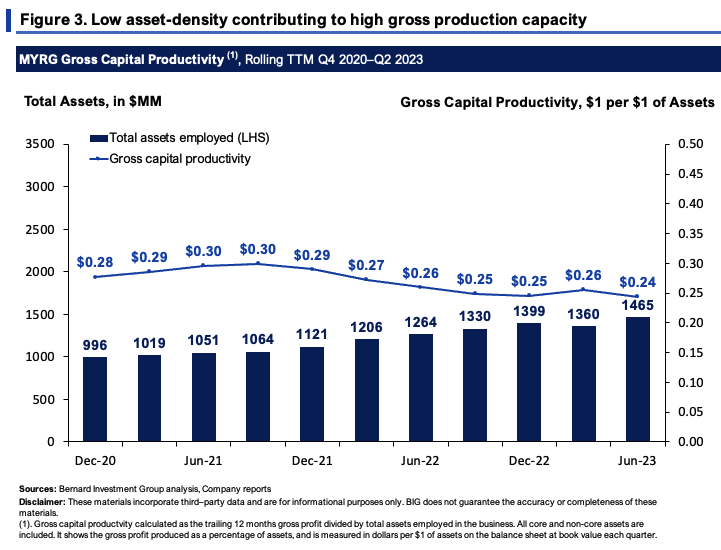
Perhaps the reason for this is its working capital efficiency. MYRG holds no inventories, and most of its NWC is in receivables. As such, the cash conversion cycle ("CCC") is less than 2 months, meaning each $1 invested into the day-to-day operations of the business is cycled back to cash in ~55-60 days [Figure 4]. That equals less cash tied up in NWC, freeing up capital to deploy in other growth initiatives.
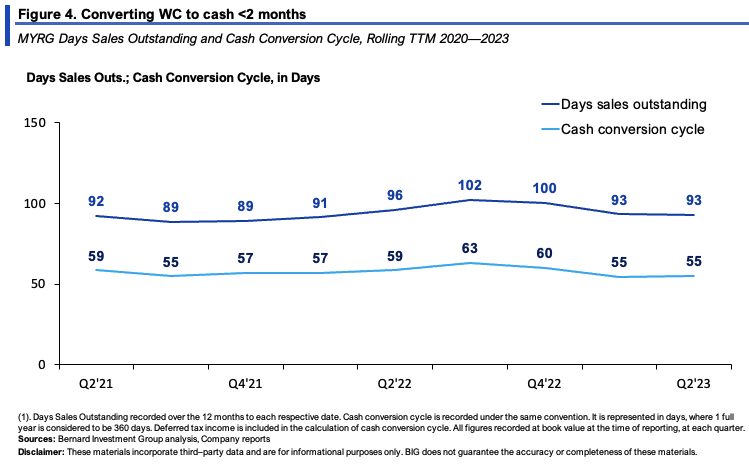
There's a tight relationship between lower CCCs and higher returns on capital deployed. MYRG excels in this domain and here is where I see the most economic value within the company:
- Looking at Q2, it had $693mm in capital at risk in the business, equating to $41.50/share. This threw off $5.37/share in trailing NOPAT, ~13% return on investment. Including buybacks, shareholders saw trailing $7.90/share in cash off $87mm in FCF for the quarter. The value is all in MYRG's capital turnover-4.6x in Q2, up from 3.8x in '22, and 4.3x in '21.
- So despite the low margins, MYRG enjoys production advantages that see each $1 of capital at risk circle bat $4.60 in sales. Given the capital efficiency, it is likely the company employs a cost leadership strategy, where it can price its offerings below industry averages.
- This is a tailwind in my view, because when the credit and business cycles tighten up, simple economics says consumers etc. gravitate towards the low-cost suppliers in respective industry.
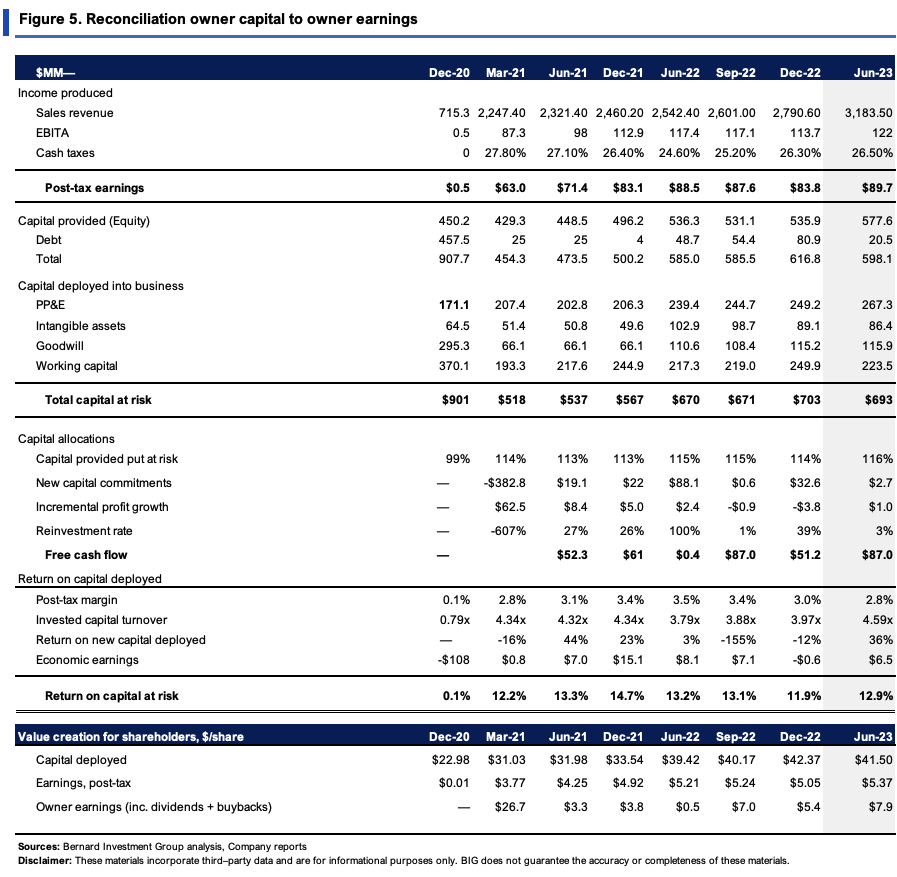
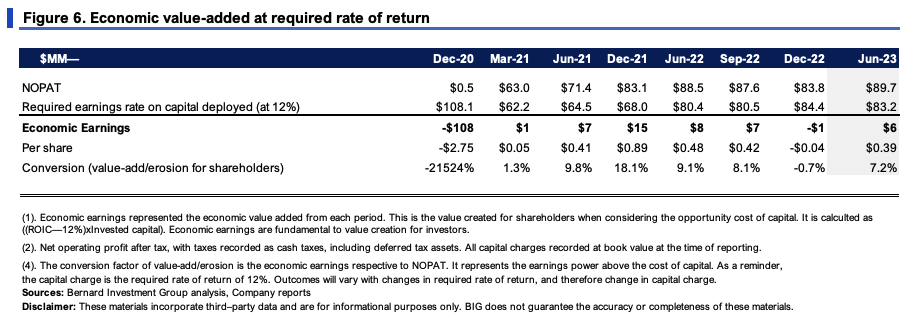
Figure 6 outlines the above points in economic terms to shareholders, incorporating our 12% required rate of return. As you can see, in owning MYGR, you've realized positive economic earnings per share of $0.40 last period, in line with prior periods. This is clear indication of the economic value MYRG has produced off the incremental spending since 2020.
Meanwhile Figure 7 outlines the incremental value drivers in more granular detail. What's clear is the following:
- The company has grown sales at a 16% compounding rate these past 3 years, all with ~4% operating margin.
- The sales growth has required absolute minimal additional capital requirements. Each new $1 in sales required just $0.04 investment in fixed capital and ~$0.01 in intangibles. Meanwhile, with each dollar of sales growth, the firm has managed to reduce its NWC requirements by $0.06 on the dollar.
These are the kind of economics I like to position against. As the firm does more business, the new capital requirements are low, and this is a testament to the capital efficiency outlined earlier. Each $1 of investment has a high revenue function, giving MYRG its competitive position.
BIG Insights
The question is, what does this kind of growth require going forward. Figure 8 depicts this albeit with a 7% revenue growth rate. Critically, if it were to grow at 7% and maintain the same rates of investment, it could spin off $122mm in FCF by FY'24 off a quarterly investment of $7.5-$10mm in my view.
To me, these are exceptional economic characteristics. Growing sales at a reasonable clip off such thin reinvestment leaves the majority of cash flow left over for shareholders or to plough back into its growth initiatives. In that vein, I'd see MYRG compounding its intrinsic value at an average 7% over the coming 5 quarters, 35-42% cumulatively.
BIG Insights
3. Technical considerations
Market technicals are equally as supportive, as noted in Charts 1 to 4.
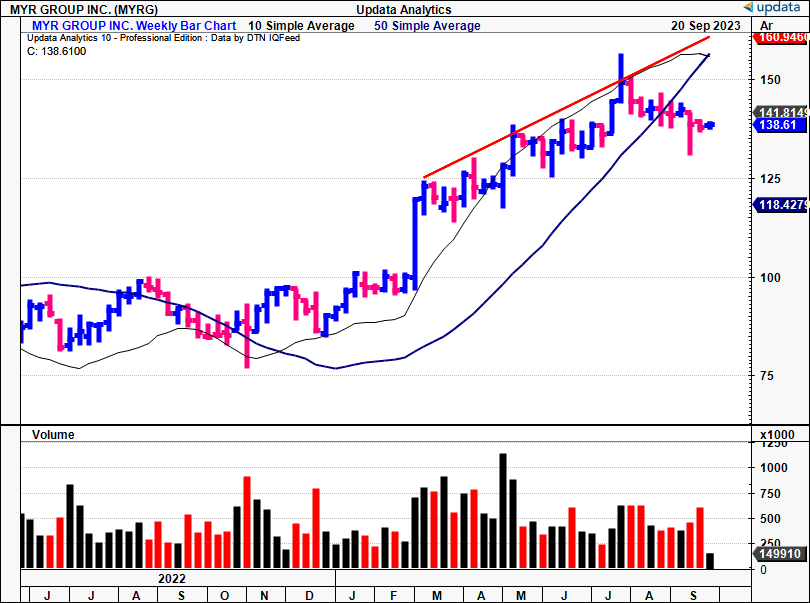
Chart 1 is also shown at the start of this report. What's critical to know is the price line broke the upper line of the ascending channel in August, so the consolidation we've seen since then was expected on this basis.
Chart 1.
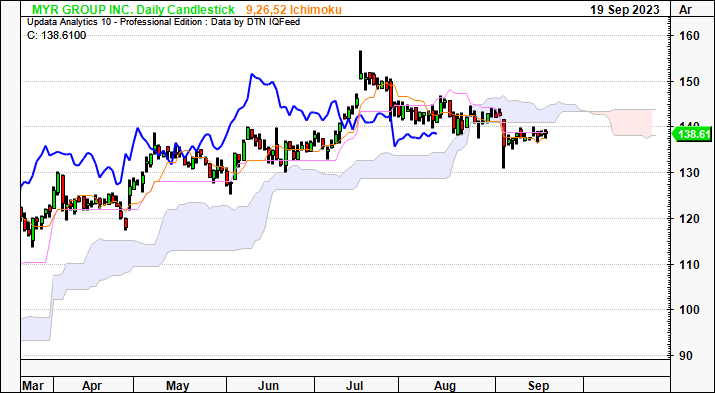
The stock is pushing into some congestion and the price line has crossed beneath the cloud base on the daily chart below. The lagging line hasn't got there, but without a reversal could very well do this by October. This could support a neutral view over the coming weeks.
Chart 2.
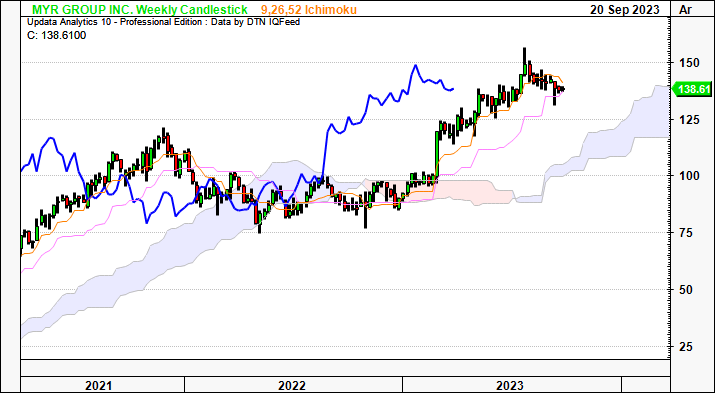
The weekly chart, looking to the coming months, tells a different story, however. It is positioned firmly bullish above the cloud, with both price and lagging lines in situ. Support is at $119 up until November here, but I'd stress a spike higher would be needed by Q1 next year. Still, this reminds us why to keep a long-term view.
Chart 3.
Chart 4 provides a more granular look at the recent price action and eyes price targets to $141 with the point and figure study shown. This looks to be a key level for MYRG to find buyers, as shown. A move to the $141 mark would be remarkable in my view, and should be looked at as the next upside target.
Chart 4.
Data: Updata
Valuation and conclusion
The stock sells at 24x forward earnings and 17.6x forward EBIT as I write. It has created $3.50 in market value for every $1 in net asset value, and the market has priced MYRG at 3.4x its invested capital. This is clear indication of the expected earnings power these assets can produce moving forward.
More critically, Figure 9 depicts the implied intrinsic value at the function of MYRG's ROIC and reinvestment rates. What shows is the company has been potentially undervalued since '21, more so when extending the calculus out to FY'28 using the steady-state assumptions in Figure 8. Based on this calculus, I get to $161.5/share in implied intrinsic value today, up to $222/share looking out to '24.
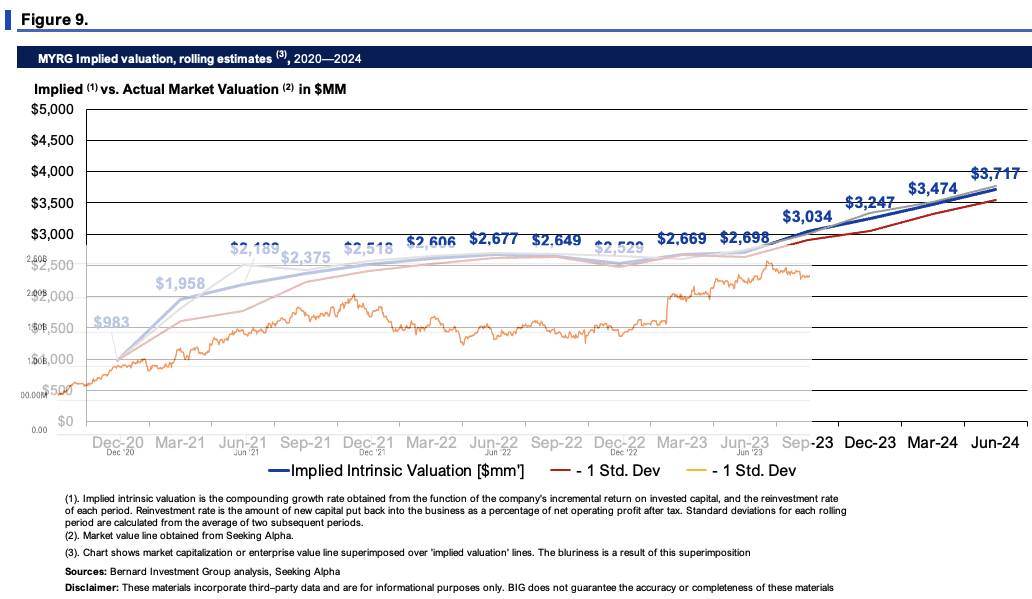
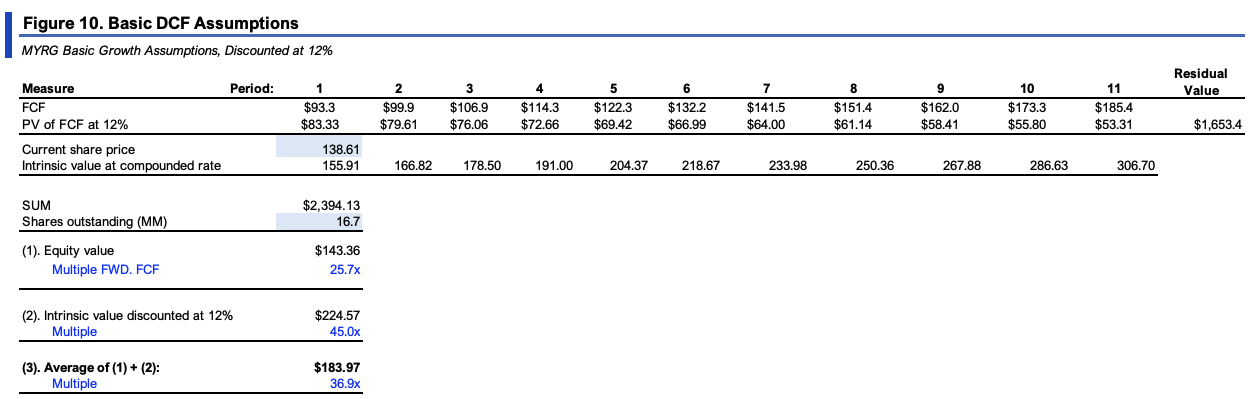
Rounding the valuation out, Figure 10 projects the FCFs assumed in Figure 8 out to FY'28 and discounts these back at the 12% hurdle rate used here. As a reminder, this assumes a 7% sales growth the next 3 years, fading to long-term GDP of ~3% thereafter. This gets me to $184/share when averaging with the calculus from above. In both cases, a buy rating is well supported in my opinion.
In short, MYRG comes with the economic characteristics I like to put us in. The major levers forming the buy thesis are:
- Record sales growth into the back end of '23 off a high base in '22;
- Record backlog as well, split evenly across both portfolio segments;
- Growth earned off minimal new capital requirements, creating tremendous economic leverage on capital deployed;
- Supportive valuations backed by high FCF potential should the firm continue at a steady rate of growth. I've baked in 7% the coming 12 months.
Net-net, the investment case is well supported by these 4 factors, prompting me to rate MYRG a buy at a valuation band of $161-$184/share.
For further details see:
MYR Group: Classic Low-Margin, High Capital Turnover Business With Production Advantages