ARKK - Nasdaq Bottomed In Early January Has Formed A Golden Cross (Technical Analysis)
2023-03-21 08:00:00 ET
Summary
- The Nasdaq bottomed in early January.
- It started looking beyond the current rate hike cycle.
- Tech stocks started breaking out shortly thereafter.
- Is the Nasdaq the place to be in 2023?
A golden cross is formed when the 50-day moving average crosses above the 50-day moving average. This is looked at by stock-chart technicians as an intermediate to a long-term buy signal. Conversely, a death cross is the crossing of the 50-day moving average below the 200-day moving average. This is considered to be a sell signal by market technicians.
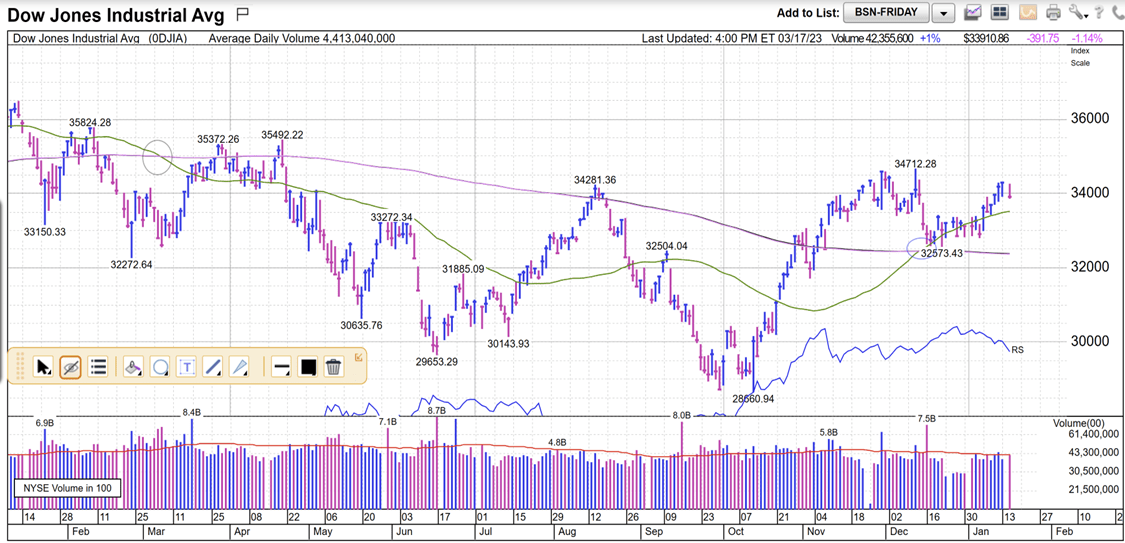
The Dow Jones Industrial Average, or DJIA, was recently the first of the three major indexes to form a golden cross after the big selloff in the market in 2022. We have been reminding our followers of this major occurrence for the DJIA since it happened.
As you can see from the chart of the Dow Jones Industrial Average above, the DJIA formed a death cross back in early March of 2022 at around 33,500. After this death cross, the DJIA finally bottomed at 28,660 in early October of that same year. A drop in the DJIA of 14.5% occurred from the March death cross to the October bottom.
One could have avoided this drop if they used the death cross as a sell indicator. We will look at this more closely in a bit.
During this period of time, the Fed was hiking interest rates by 75 basis points at a time. There is an obvious correlation between rising interest rates and the drop in stocks. Rising rates shrink multiples on stocks and the indexes that are made up of those individual stocks. The higher the P/E ratio of a stock or index, the more vulnerable it is in a rising interest rate environment.
For this reason, the DJIA actually fared better than the S&P 500 (SP500) and the Nasdaq in 2022 because it had a much lower overall P/E ratio than the other two indexes. The long-duration, high P/E stocks fared the worst by far in 2022 due to this inverse relationship between rising interest rates and shrinking P/E multiples.
We warned investors to get out of the way of long-duration stocks and bonds clear back on January 11 th of last year with an article titled, “The Real Reason That ARKK Continues to Sink.” That article had over 70,000-page reads, and I hope many of them heeded our advice. Cathie Wood’s Ark Innovation ETF (ARKK) was down 67% in 2022, as it was in the eye-wall of the rising interest rate hurricane.
Now, let’s go back to 2020 for a reminder of where and why this whole mess began.
The year 2020 was a year of extreme speculation in the markets which saw huge bubbles in everything from long-duration (speculative) stocks, to bitcoin, to long-duration bonds, and beyond. These bubbles formed mainly due to ultra-low interest rates for way too long. They were also caused by a lot of money being injected by the Fed to help stave off a shock to the economy from COVID-19.
The Fed started stating its intentions to begin hiking interest rates early last year and that was the signal to get off the railroad tracks, especially the speculative and long-duration areas of those tracks. We recommended raising a lot of cash and hedging with some inverse ETFs like Tuttle Capital Short Innovation ETF (SARK), which goes in the opposite direction of ARKK as we were seeing parallels between 2021 and the “dot.com” bubble burst of 2000.
Now, let’s return to the chart of the DJIA above. It started forming a bottom in mid-September of last year. This bottoming process took about four weeks, and the Dow finally reversed its #4 downtrend and began a new #2 uptrend in early October. This new uptrend was finally confirmed in mid-December, when the DJIA formed a golden cross at around 33,200. Obviously, a lot of pain could have been avoided by just following the 50 and 200-day moving average signals.
The golden cross was only a few hundred points lower than where the death cross occurred, however. One could have also ridden through the almost 15% dip in the DJIA and came out about the same as selling the death-cross in the DJIA and buying back in at the golden cross.
That golden cross for the DJIA is still in place and so far 2023 is a much better year for the market than 2022. We have been saying on our daily radio show and podcast that this was because the market started looking to an ending of the rate hikes sometime in spring and moving up way in advance of that. While most investors are looking at yesterday, today, and tomorrow, the market is looking 1-2 years ahead.
We used this same reasoning back on March 6, 2020 to call the bottom in the market right when COVID was at its worst. There may have been some other writers here on this sight also calling a bottom at that time, but I am not aware of any others than us.
Let’s now look at the S&P 500.
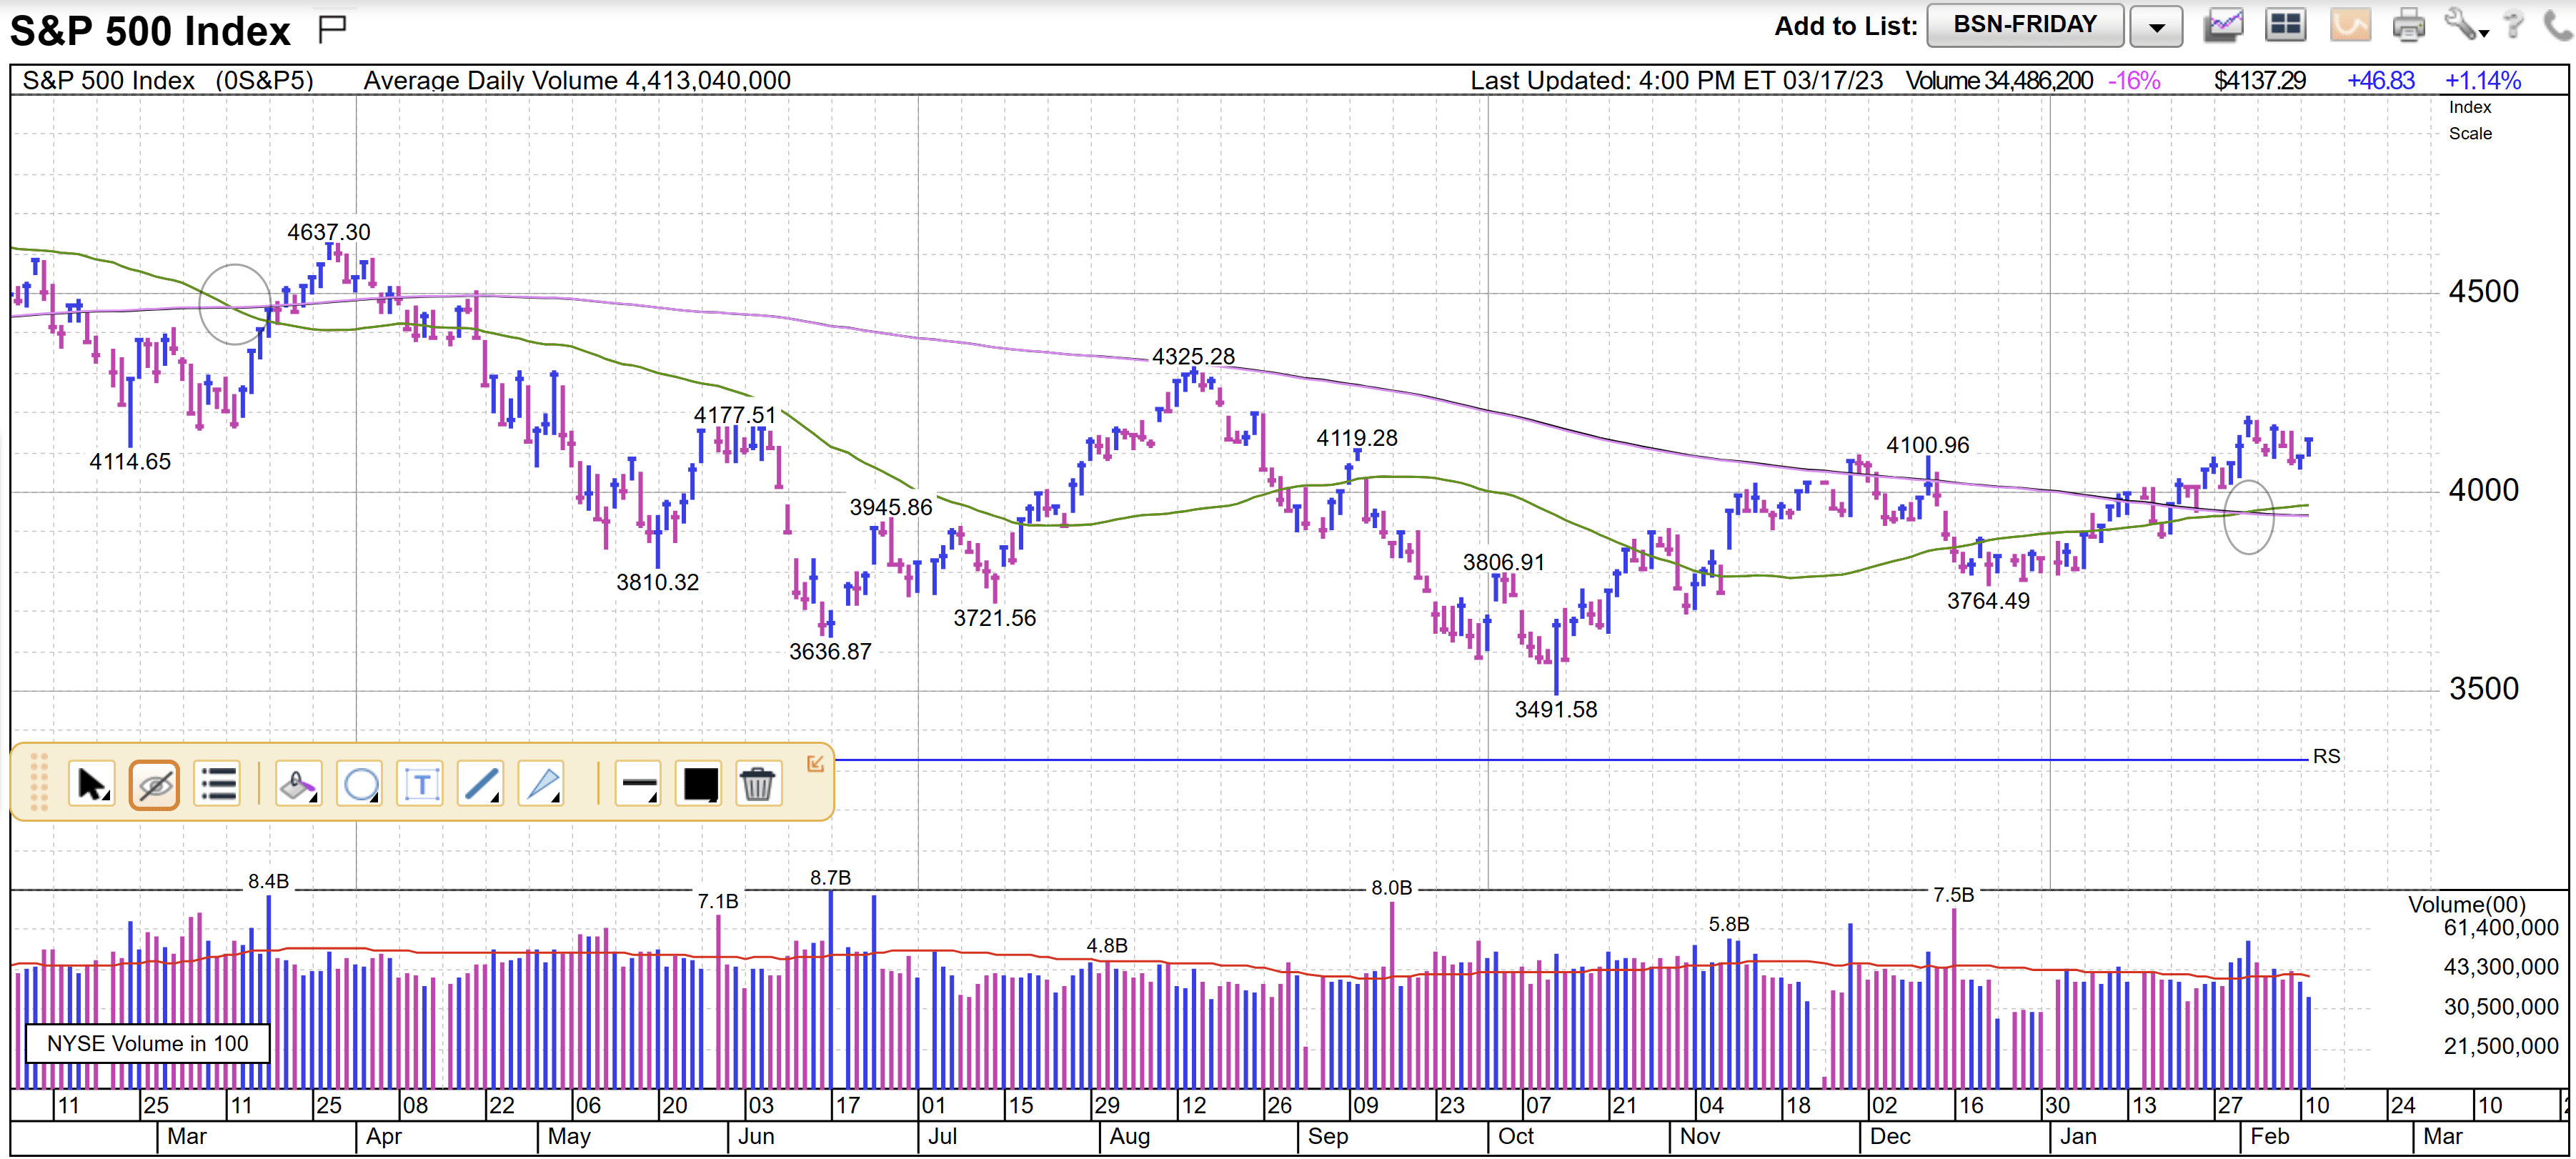
The S&P 500 formed a death cross in early March of 2022 at around 4,300. The index peaked at 4,637 a few weeks later and then descended all the way down to 3,491 by mid-October. This is a drop of 24.7% or almost 1/4 th of one’s stock portfolio. A $250,000 portfolio of equities would have dropped down to $187,500 or a drop of $63,500.
Selling at the death cross would have avoided the majority of this drop. The S&P 500 is still not back to that 4,300 level, but it has recently formed a golden cross at about 4,100, however. The drop in the S&P 500 also correlates to the hikes by the Fed which shrink market and stock multiples (P/E ratios).
The forward P/E ratio of the S&P 500 peaked at 23.5X at the beginning of 2022. The five-year average is 18.5X and the ten-year average is 17.3X. We closed Friday at a forward P/E ratio in the SPY of 17.1X. It got as low as 15.5X about the same time that the DJIA and S&P 500 were bottoming back in October of last year. It is interesting to note that interest rates were also peaking about this same time.
At a forward P/E multiple of 23.5X, the market was way overpriced as we began 2022. Once again, this bloated multiple was caused mostly by the Fed keeping interest rates so low for so long and the massive injections of capital into the markets during the COVID-19 year of 2020.
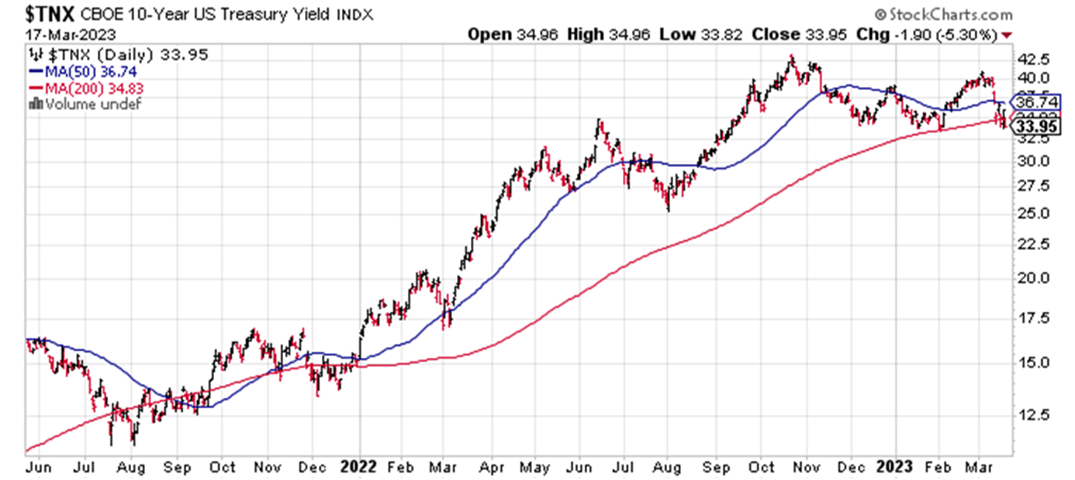
Now let’s look at interest rates on the ten-year treasury and the inverse relationship that they have with equities, especially high P/E and long-term ones.
As you can see from the chart above, rates finally peaked at around 4.30% just 16 months after hitting a low of 1.3% back in August of 2021. As I have stated before, high P/E stocks and long-duration bonds were crushed during this long bout of rising rates. Bitcoin crashed from a high of $68,000 to a low of $16,000, and Cathie Wood went from being a stock-picking guru to the face of the great collapse in long-duration, high P/E stocks.
Now, let’s take a look at the Nasdaq, the highest P/E of the three major indices.
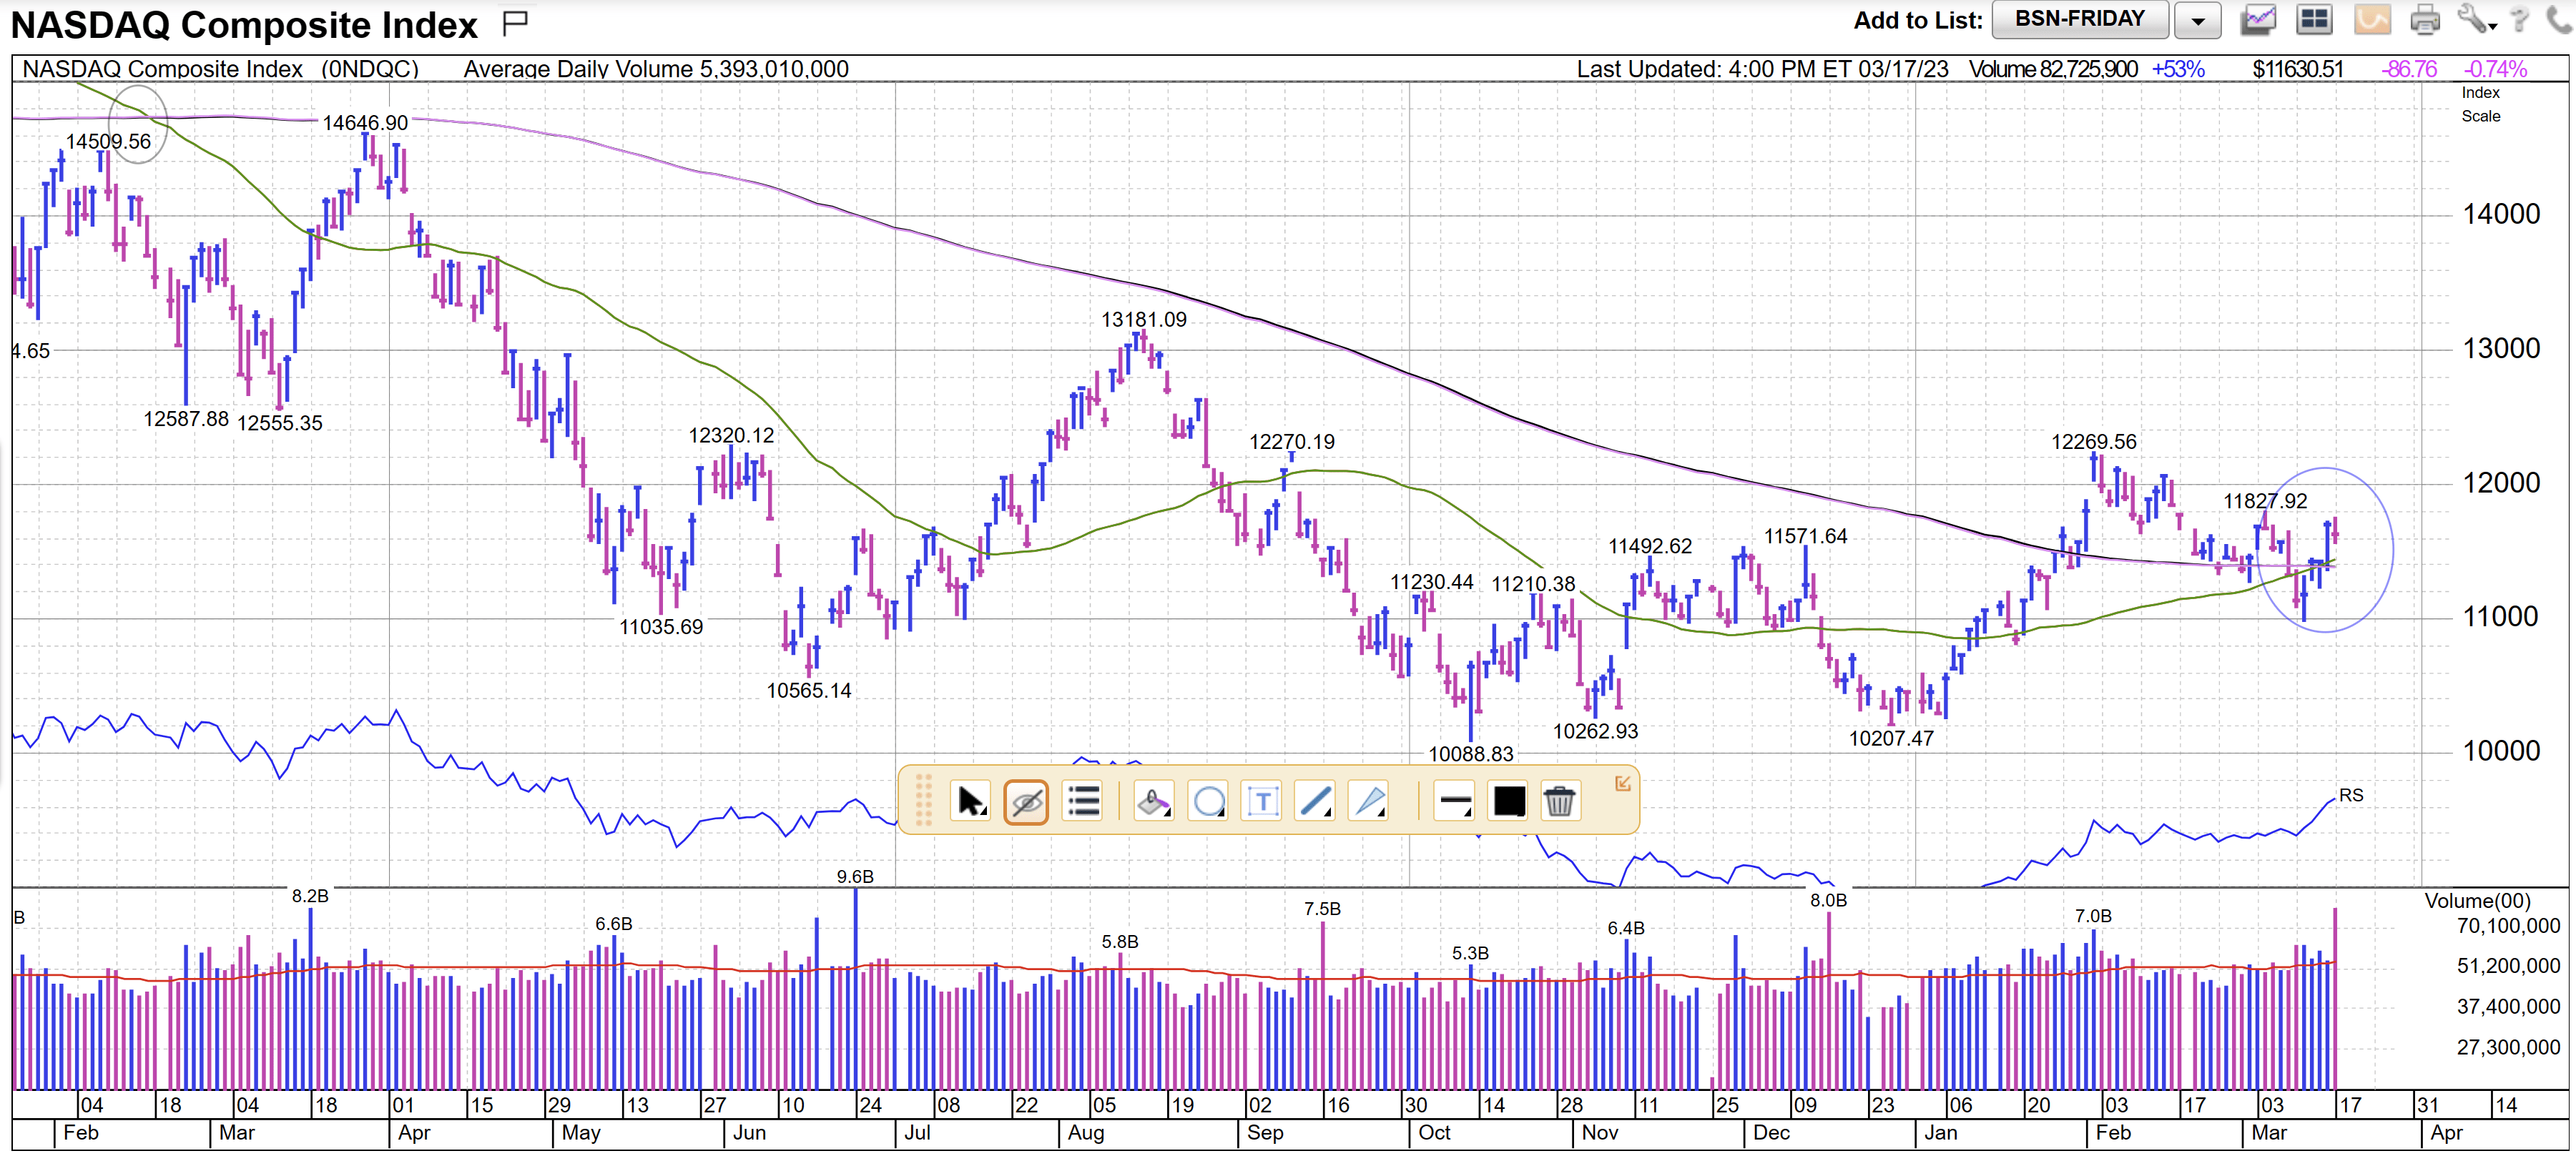
The Nasdaq formed a death cross in the middle of February of 2022 at around 14,000. It then plunged to a low of 10,089 by mid-October of 2022 at about the same time that interest rates were peaking. Nowhere (except for Cathie Wood’s ARKK fund) can the impact of rising interest be seen more than on the high P/E Nasdaq.
The Nasdaq went down a gut-wrenching 31.1% from its peak to trough as the Fed was implementing its plan to cool off an overheated economy and massive bubbles in the markets. Now, look at what happened to the Nasdaq this past week.
A new golden cross has formed in the 11,400 area. Selling the death cross and buying back in at the golden cross would have worked best in this index. We saw a bottom finally forming in the Nasdaq in late December when the index went back to its old low in the 10,200 area and held. In addition to this, the market was now looking beyond the Fed rate hikes and to a more favorable interest rate environment for tech stocks in the near future.
We were even so bold as to call a bottom in the Nasdaq on January 6 th of this year with an article simply titled: “ The Nasdaq has Bottomed .” We then followed up with another article titled: Tech Stocks are Breaking Out a little over two weeks later.
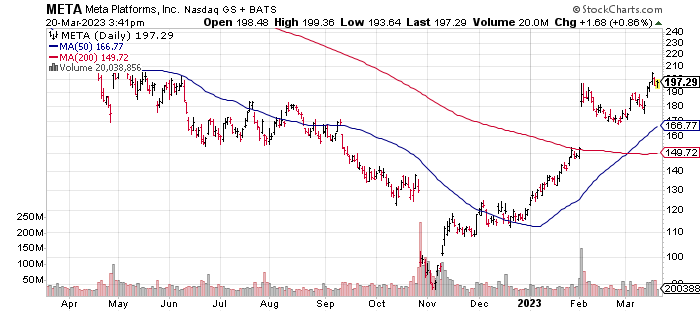
So far, the Nasdaq has been the place to be in 2023. What a difference one year makes. Those shrinking multiples finally hit bottom in October of 2022 and have now stabilized more in the area of their long-term averages. Believe it or not, Meta Platforms, Inc. ( META ) was one of the first tech stocks to bottom. It has gone on a torrid run since then.
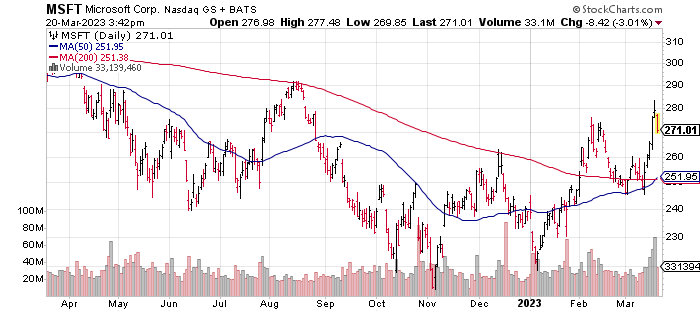
Microsoft Corporation ( MSFT ) has recently broken out and now formed a golden cross helped by its ChatGPT and Bing connection.
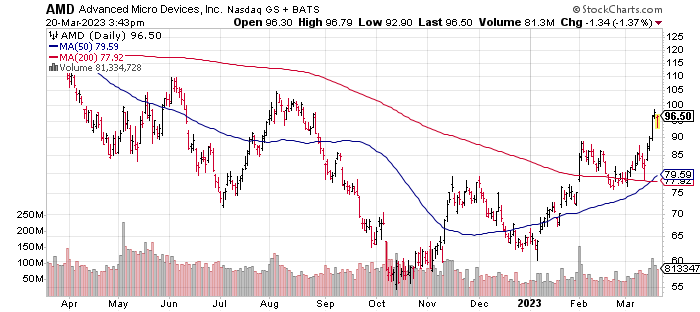
Advanced Micro Devices, Inc. (AMD) has taken off and is now forming a golden cross.
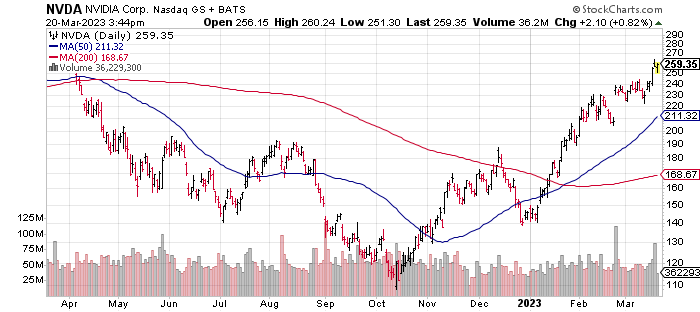
| Nvidia Corporation ( NVDA ) is also following the same path and is a big player in the AI space with their high-speed chips. |
The aforementioned tech stocks were names that we avoided for the most part in 2022, but have gotten back into in early 2023.
The market is now looking beyond this current rate hike cycle and to a much more favorable environment (dropping interest rates) for growth stocks going forward. This whole move in growth stocks has only been helped by the recent drama in the banking sector, as it has caused interest rates to plunge and more than likely has slowed down the Fed from hiking too much for too long.
The biggest risks that we see in the market right now are the slight chance of an earnings recession (we are still looking at record earnings for the S&P 500 this year and next) and or geopolitical events in Ukraine or the Middle East.
We called the bottom of the DJIA in 2020 and the bottom of the Nasdaq in 2023. Now the Nasdaq has formed a golden cross. What are you going to do about it?
For further details see:
Nasdaq Bottomed In Early January, Has Formed A Golden Cross (Technical Analysis)