NRC - National Research: Economics Well Priced In Future Value May Be Crimped (Rating Downgrade)
2023-08-15 07:28:12 ET
Summary
- National Research Corporation's stock has been trading into congestion for most of 2023.
- Q2 FY'23 numbers show a decline in recurring revenue, operating income and operating cash flows.
- The company's capital allocation and recycling strategies are favorable, but its ability to compound intrinsic value and shareholder value is diminishing in my view.
- Net-net, revise to hold.
Investment briefing
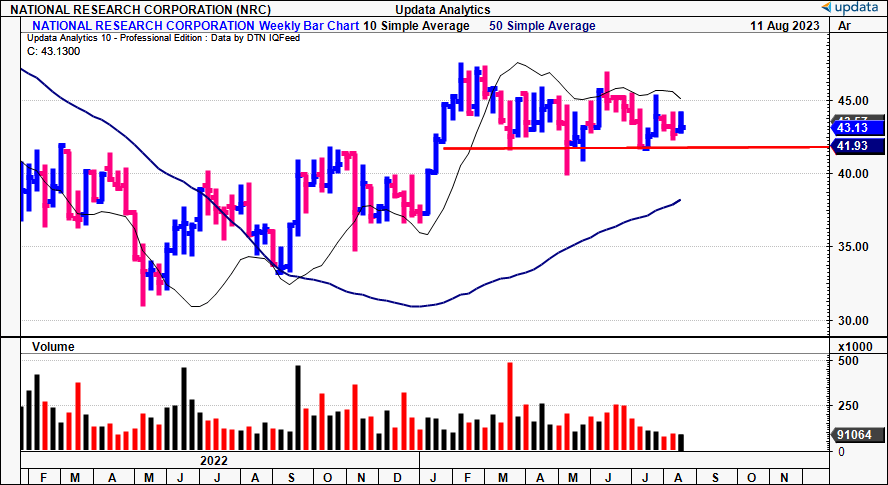
Following my May publication on National Research Corporation ( NRC ) the company's equity stock has pushed sideways into congestion, backing and filling around the range it has sold for the most of FY'23. The company's Q2 numbers were also posted last week with numerous points for discussion. Net-net, I revise my rating on NRC to a hold based on the critical facts raised here today, closing the position after a 9% total shareholder return after holding it long since September last year.
Figure 1. NRC price evolution, weekly bars
Critical facts to investment debate
NRC"s latest numbers are integral to digest to extrapolate the investment value. Here I'll run through the quarterly insights and reconcile the movement of shareholder's capital tied up in the business to the cash NRC is throwing off tot its equity holders.
1. Q2 FY'23 insights
As a reminder, NRC books revenues from its subscription services that are renewed annually. There are 4 arrangements under these contracts: subscription-based service agreements; one-time specified services performed at a single point in time; fixed, non-subscription service agreements; and unit-priced service agreements.
For the quarter, it booked $146.6mm in total recurring contract value ("TCRV") under these agreements, flat YoY and down ~$1mm sequentially. For the YTD, it had booked $72.6mm in sales driven by a $0.874mm decrease in recurring revenue from its domestic base and eliminated $0.44mm from its core customer base. The closure of its Canadian office [outlined in the previous 2x NRC publications] is also a critical factor in the sales decline.
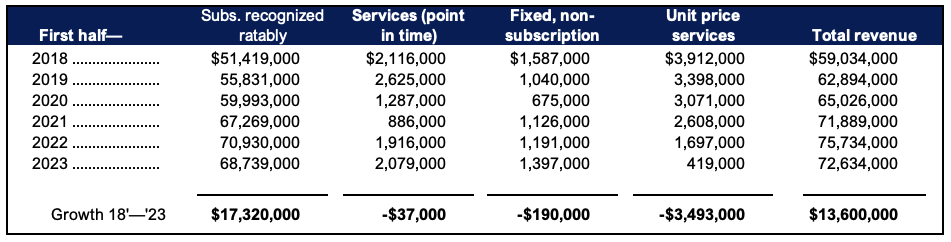
Looking at H1 top-line numbers since FY'18, subscription revenue, recognized ratably, was down ~300bps YoY to $68.7mm, whereas sales were weaker across all other contract revenue sources [Figure 2]. Since 2018, service and unit price services are down $37K and $3.5mm respectively. Hence, over this time, the $13.6mm gain in turnover is all driven by the $17.3mm upside in pro rata subscription revenues.
Figure 2.
Sources: BFO Insights, Company reports
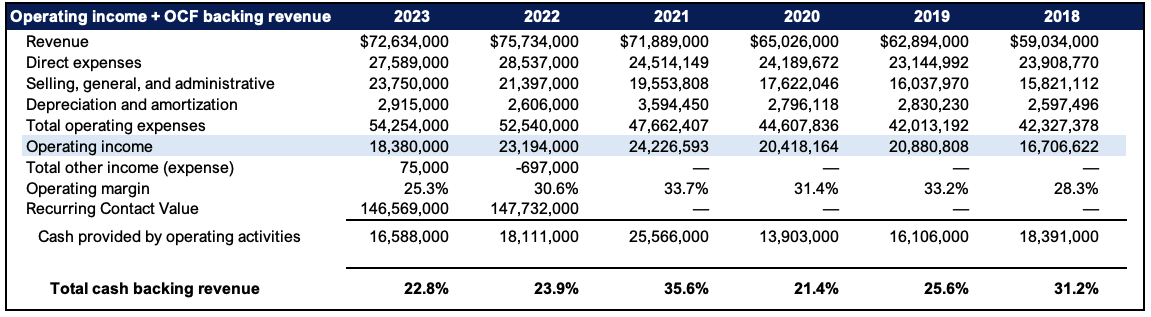
Given the subscription–dominant sources of income for NRC, critical analysis of the cash flows backing income is essential. Note the following:
- NRC brought the $72.6mm in H1 sales down to $18.3mm in operating income at a 25.3% margin, This is down off highs of 33.7% in FY'21 and ~31% last year.
- Operating cash flows came to $16.6mm vs. $18.1mm last year and $25.5mm in FY'21. The pullback was expected with the closure of its Canadian footprint, thus not alarming.
- The issue I have is that when adjusting for the Canadian closure at the top and bottom lines, as I have done in Figure 3, the percentage of OCF backing revenues is down to 22.8% from 35% in 2021. It is off FY'18—'19 H1 numbers as well.
- Alas, OCF's are behind operating profit, despite the thinner NWC requirements and ongoing CapEx investment. NRC is also pulling in less cash from operations on aggregate. That NRC has sold within such a tight range this year starts to make sense when looking at its economic factors through this lens.
Figure 3.
Sources: BFO Insights, Company reports
2. Capital allocation and recycling
Several points on capital deployment are relevant to NRC's ability to create future shareholder value.
One, net working capital ("NWC") density has pared back tremendously since 2018 with the company's shift towards subscription–based revenue. It now requires $7.3mm in NWC to maintain its steady-state of operations from $22.5mm 5 years ago. The key point is that, of the $41mm in the current asset account, ~55% is tied up in cash on hand, with the remaining 45% as operating capital.
Subsequently, NRC enjoys a negative NWC cycle, meaning its purveyors provide a 'free' source of financing to fund the company's operations. This makes sense given the company's business model (subscriptions) where all the money is received 'up front' before outflows are made, similar to an insurance float. This is an attractive feature in my view.
Figure 4.
Sources: BFO Insights, Company reports
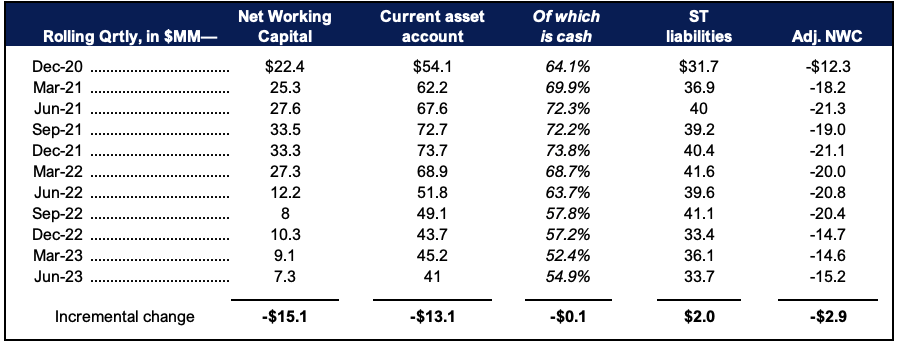
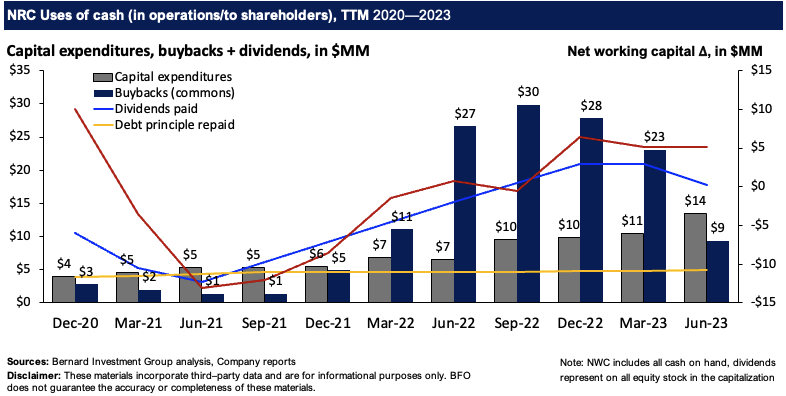
Two, the company is on the side of shareholders in returning capital to its owners. Buybacks and dividends outpaced CapEx over the entirety of FY'22 on a TTM basis [Figure 6], and it paid $3mm in dividends and $1.8mm in buybacks in Q2. On inspection, 24.5mm of commons make up the capitalization on $15.4mm of long-term debt, throwing off $0.48 in annual dividends per share. The entire scope of NRC's uses of cash since 2020 is observed in Figure 6.
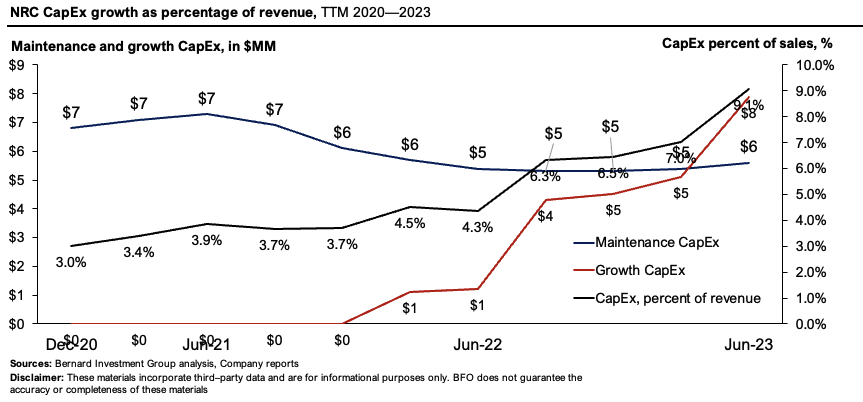
Three, related to the point above, is that the company's CapEx requirements are tremendously low at ~$14mm in the TTM after ~$4mm of reinvestment in Q2. Since 2022, the company has recycled $4–$5mm into the business as growth investment, seeing CapEx as a percent of revenue inflect from ~4% to 9.5% in the TTM. This is positive and suggests NRC could be ramping up investment into its growth initiatives, which stem around pulling more customers onto its subscription services. This is critical to its intrinsic value, as outlined later.
Figure 5.
Figure 6.
Four, the economics on points (1), (2) and (3) are reasonably attractive in my opinion. For starters, you're getting ~21% return on the firm's existing capital at risk, as the reinvestment rate is marginally ramped up. For seconds, the company's capital strengths come from post-tax margins rather than capital intensity benefits, in keeping with findings thus far. Further, NRC has put 158% of the capital it's been provided (debt, equity) at risk and deployed into operations. Hence, ~58% of the asset growth has stemmed from internal uses of capital.
Balancing the debate is the incremental profitability gains since 2021. This, and the thin reinvestment on such tidy returns on capital deployed. Whilst the profits generated on its existing assets are high, incrementally (from quarter-to-quarter, on a TTM basis), they have been a drag on profitability [Figure 7]. Further, whilst reinvestments are creeping up—you're still at just c.5% of earnings recycled into growth capital. This could mean either:
- The firm has a lack of profitable ventures to deploy surplus capital;
- Current growth initiatives are a major drag on profitability growth and therefore capital budgeting.
- A combination of points (1) and (2).
This may explain the outsized return of capital to shareholders outlined earlier, and the thin growth CapEx on absolute terms each period.
Additionally, the clip on trailing ROIC has tightened substantially with the tighter capital base. There's good research to suggest that shareholder returns for companies whose returns on capital deployed are decreasing are equally likely to decline. Further, companies with high ROICs in one period (2 years, say) are likely to revert to the mean over time.
Is this happening for NRC? Consider the following:
- The outsized profits generated on its capital base from FY'20 and '21 have pulled in drastically along with the incremental returns.
- The cash it has spun off to shareholders has tightened from $37mm last year to $27mm this year despite just a 5% reinvestment of earnings.
- Post-tax margins—the key driver for the profits in the first place—have also compressed by ~6 percentage points from 2021.
Consequently, my views on the company's ability to compound 1) intrinsic value and, thus, 2) shareholder value are beginning to diminish, supporting the hold rating.
Figure 7.
Sources: BFO Insights, Company reports
The technical take
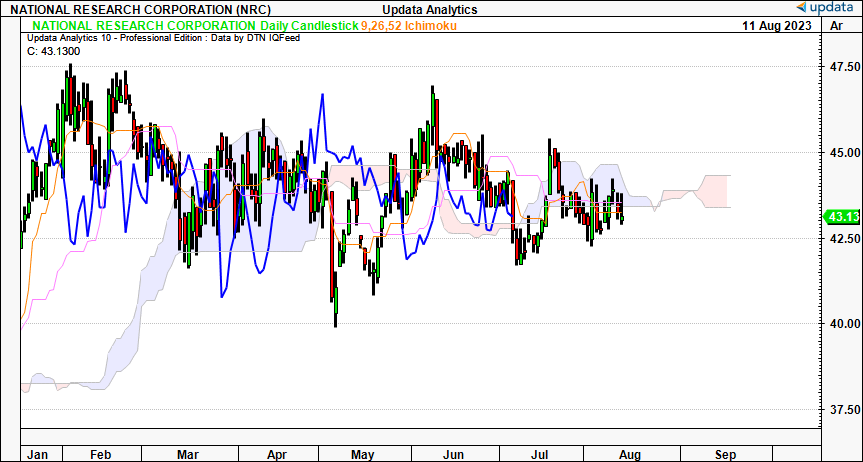
Detailed trend and pricing analysis further corroborates a re-rating to hold. Looking to the near-term via the daily cloud chart below—that looks to the coming weeks—the price and lagging line (in blue) have breached the cloud top. Both the price and lagging line now test the cloud after backing and filling for the last week or so. Critically, the lagging line's position on the daily chart suggests a move to $44.60 by mid-September is needed in order to turn bullish again on the daily frame.
Figure 8.
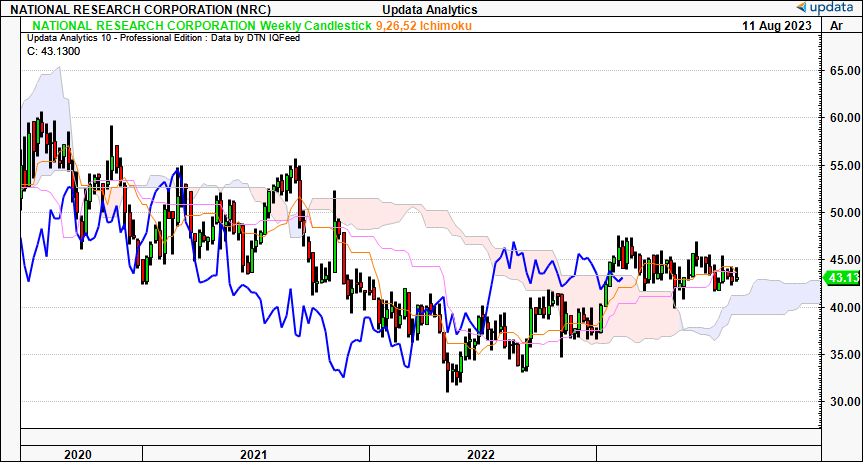
The weekly chart also shows the lagging line pushing through the cloud after the equity stock has moved through congestion since March this year. It tested the cloud top 2 weeks ago where it was rejected to the downside. If the current sideways trend continues we're looking at a move into a $38—$43 performance band (shown by the blue cloud) by October. This chart setup is neutral in my opinion.
Figure 8.
It is unsurprising to see downside targets activated to $37.5 on the point and figure studies below. The break below the 45 degree resistance in June set this target and further downside could see us push to this level. This broadly aligns with the support level outlined on the cloud charts above. P&F charts have several benefits; first, to remove the noise of time and look at price action alone; second, to remove the intra-trend volatilities and get a more accurate view of price action; and use mathematical formulae to establish objective price targets. It has eyed the moves from $29.50 to $57 and the subsequent pullbacks. Hence, there is a degree of confidence in these targets to guide price visibility moving forward.
Figure 9.
Data: Updata
Valuation and conclusion
NRC is being sold at 36.5x trailing earnings and ~13x book value, on 22x trailing EBITDA. This tells me a few things.
One is that the market seems to value NRC's net assets at a substantial premium. But this is on mediocre earnings growth. It made sense to price NRC's book value at a large premium back when it was returning 27%+ on the capital it had put at risk in the business. But this is declining, along with the absolute growth produced incrementally.
Another is that investors who paid these prices aren't parting with their NRC stock easily, asking 36.5x forward but unable to catch a bid at these prices.
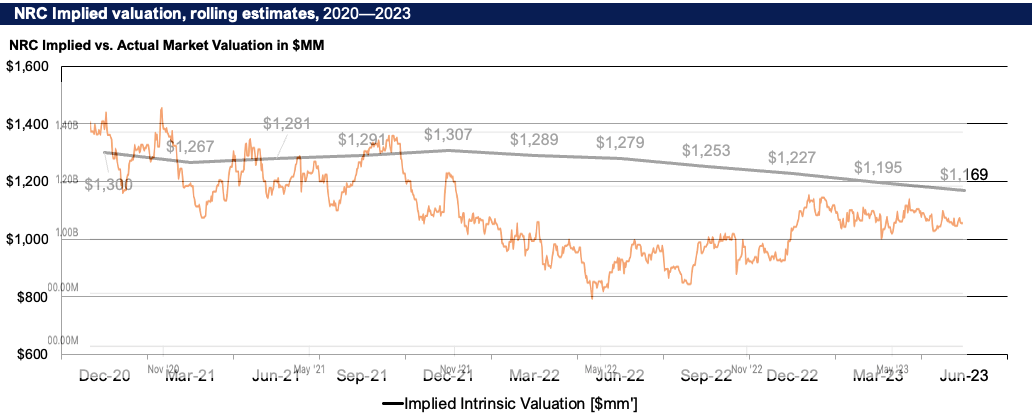
A firm can compound its intrinsic value at the function of its ROIC multiplied by the amount it reinvests at these rates of return. Applying this calculus to NRC's implied market value spits out the figures shown in Figure 10. I've got it priced at $1.17Bn, within one standard deviation from the current market value, further supporting the hold thesis.
Based on this the company has deserved a lower market value over the last 2 years in my view. The selloff in '22 was exacerbated by last year's bear market, and thus the glimmer of upside seen in the backend of '22 appears to be a reversion to the mean intrinsic value. Hence, despite the attractive returns on capital employed, the fact that 1) it is creating no additional growth, and 2) free cash flows are tightening, is being well recognized by the market in my view. This supports a neutral position.
Figure 10.
Note: The image is blurred as the market cap line is superimposed over the implied value line. The market cap line was retrieved from Seeking Alpha. (Data: Author, Seeking Alpha)
In short, NRC's propensity to unlock future risk capital for shareholders is crimped in my opinion. The critical facts are best summed up as thus:
- NRC requires less capital at risk to maintain its current level of operations than it did 3 years ago.
- Theoretically, this should free up the cash it can spin off to shareholders, but this isn't the case on inspection.
- Incremental gains on profitability have slowed and the firm is slowing up its growth percentages.
- Coupled with this, it is only recycling small amounts of earnings back into the business, and, despite growing its payout to shareholders, these don't offset the lack of reinvestment to growth.
Consequently, I am paring back my rating on NRC to a hold, closing the position after a 9% total shareholder return since September last year. Revise to hold.
For further details see:
National Research: Economics Well Priced In, Future Value May Be Crimped (Rating Downgrade)