RJN - Natural Gas Hits $10: BOIL And KOLD Are Short-Term Trading Tools
Summary
- Natural gas probes above $10 and retreats - the highest price since 2008.
- European prices say that a challenge of the 2005 and 2008 US highs could be on the horizon.
- The fundamentals for the natural gas market have changed.
- The peak season is on the horizon, with US inventories below last year’s level and the five-year average.
- The natural gas futures market will remain volatile. The BOIL and KOLD products are short-term trading tools.
In a July 28 article on Seeking Alpha , I wrote: " I believe natural gas is heading above the $10 level over the coming months, and a move to a new all-time high above $15.78 is possible. However, the route higher will be treacherous as the higher the energy commodity rises, the more the odds of periodic price implosions. " In that piece, I highlighted the unleveraged natural gas ETF, the United States Natural Gas Fund, LP ( UNG ), that tracks the price of the NYMEX futures market on the up and downside.
As we enter September and the fall season, it will not be long until natural gas inventories begin to decline during the annual withdrawal season. Stockpiles tend to rise from March through November and fall during the late autumn and winter as heating demand increases. Natural gas is heading into its peak season, with the price at the highest level in 14 years and US stockpiles below the same time in 2021 and the five-year average. Moreover, the war in Ukraine means there will be supply shortages in Europe. Fasten your seatbelts for a wild ride in the natural gas arena over the coming weeks and months.
Meanwhile, the UNG ETF will continue to track the natural gas price, but the swings could get violent, leading to trading opportunities. The ProShares Ultra Bloomberg Natural Gas ( BOIL ) product and its bearish counterpart ( KOLD ) provide leverage to the futures price on a short-term basis.
Natural gas probes above $10 and retreats
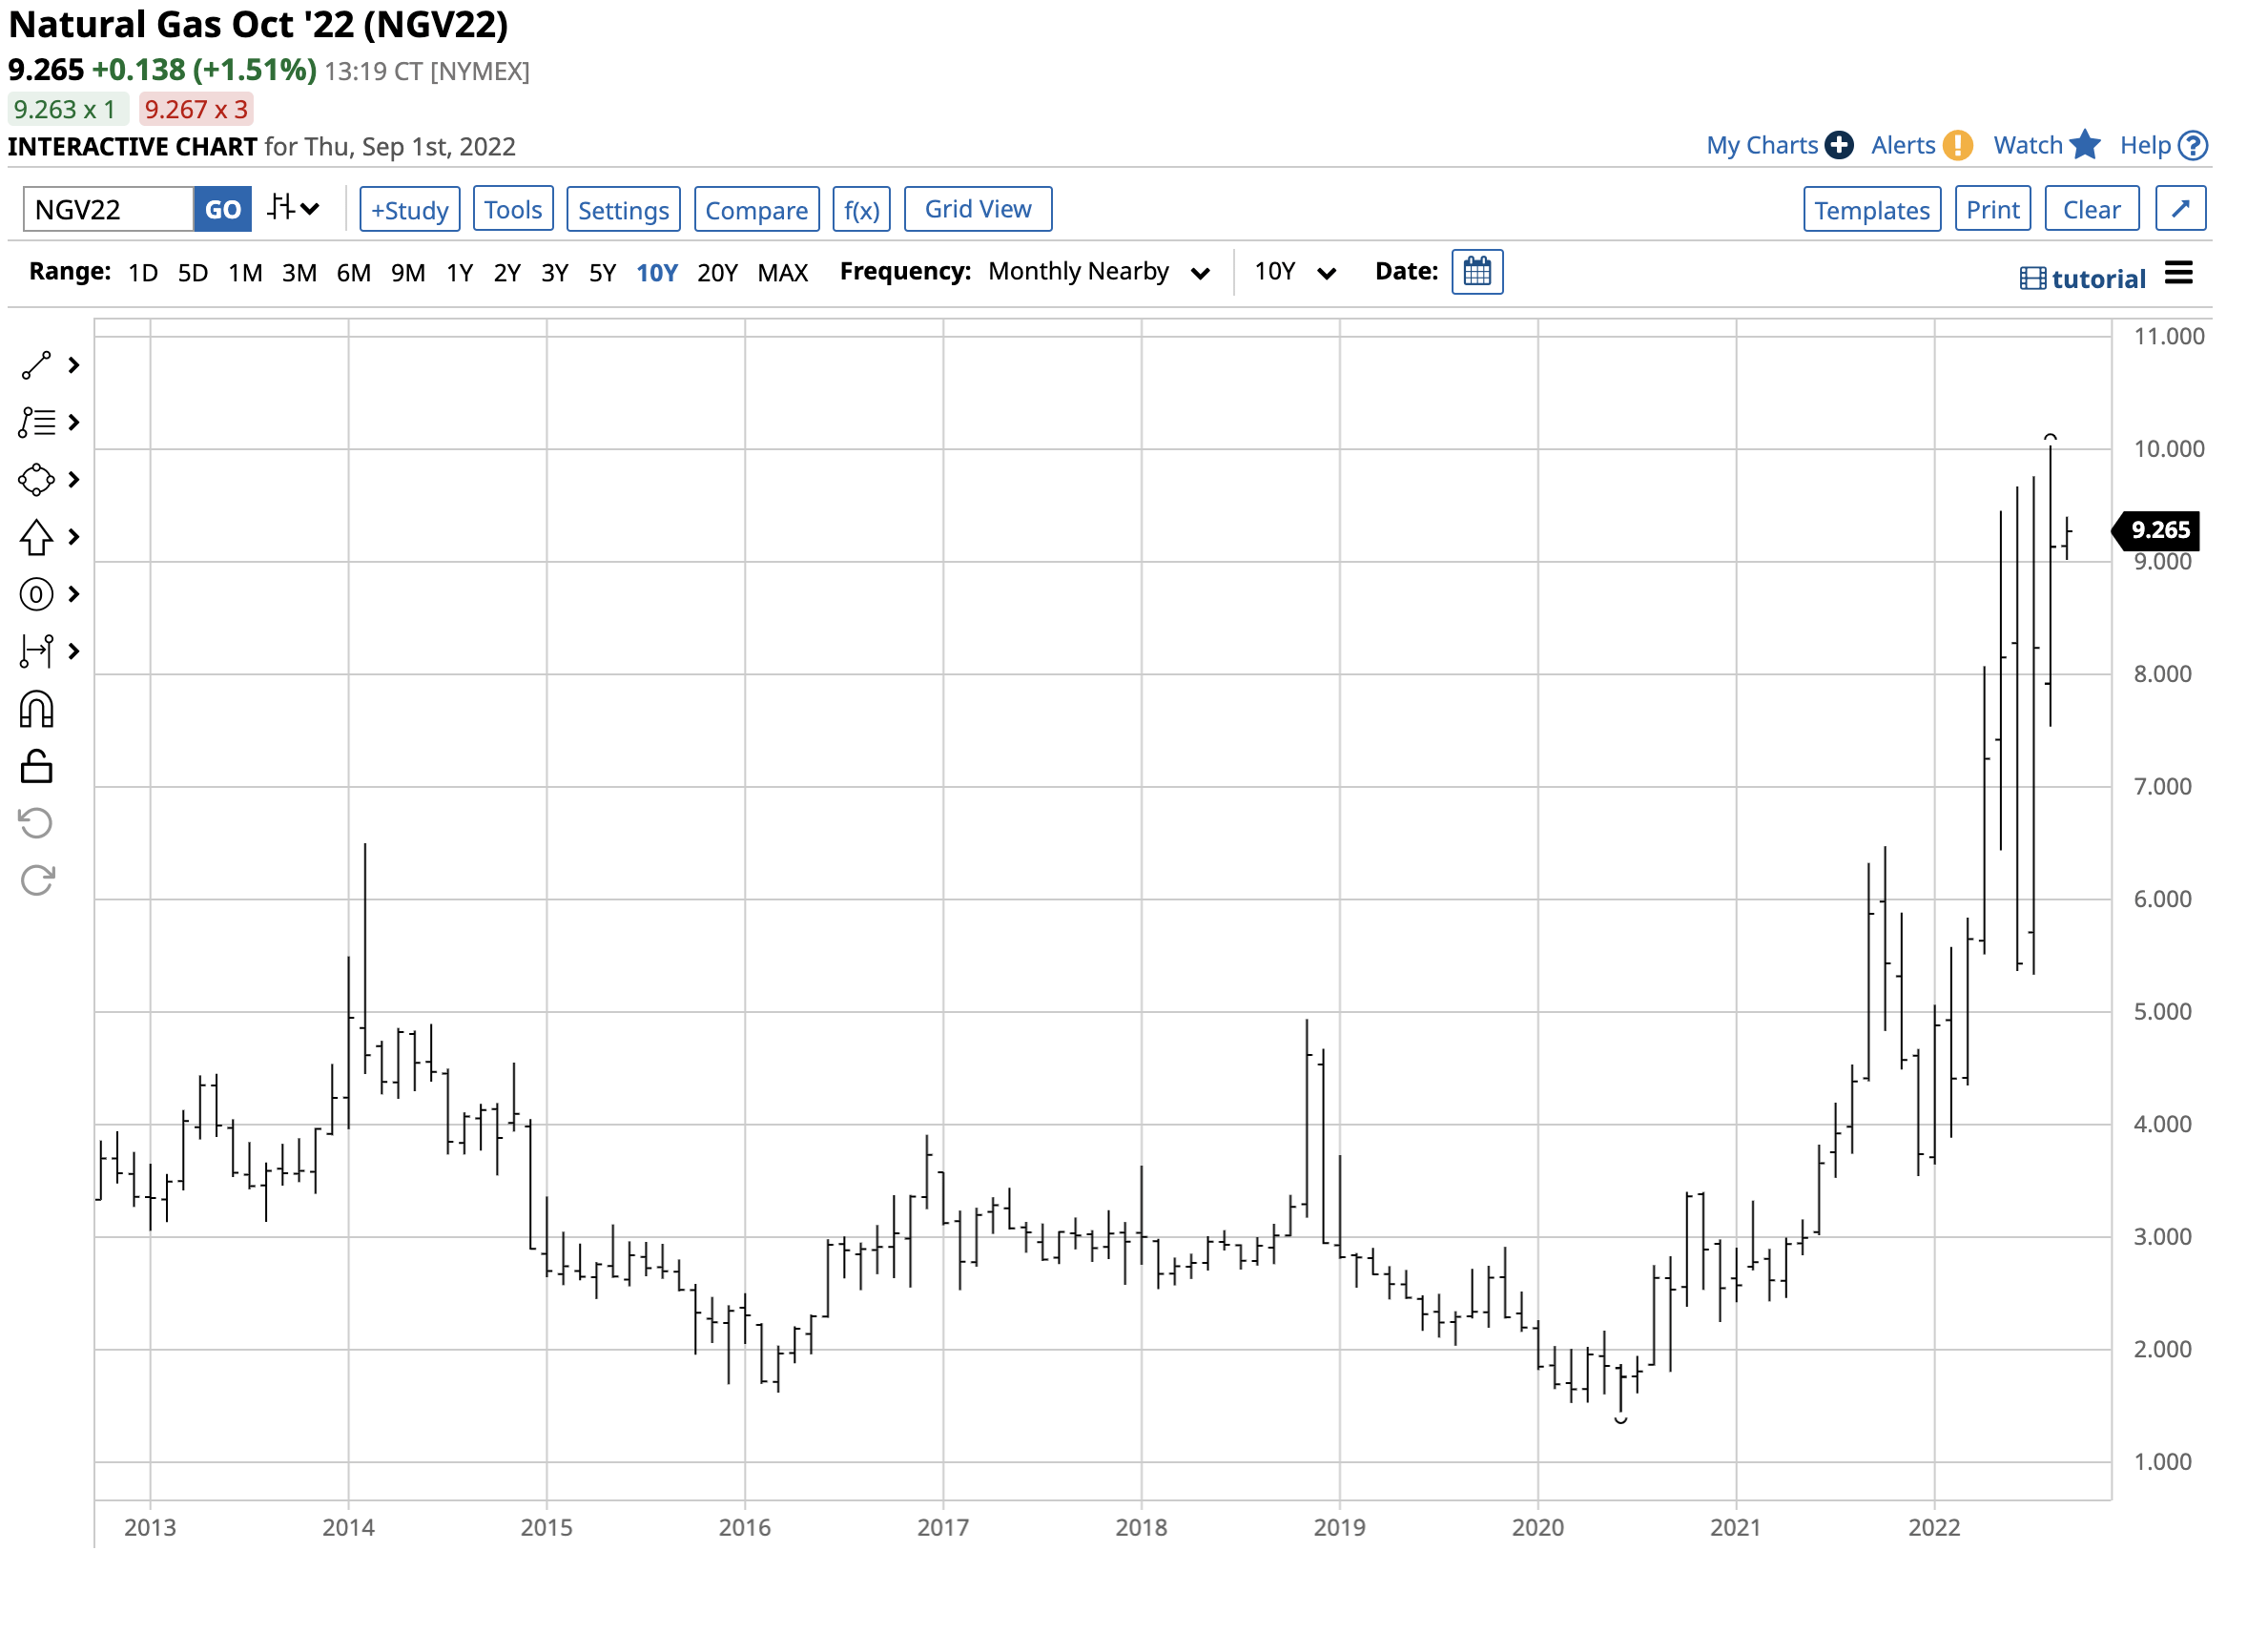
After reaching a 25-year low in June 2020, natural gas prices have been on a tear, rising to the highest price since early 2014 in October 2021. Meanwhile, the war in Ukraine, sanctions on Russia, and Russian retaliation caused natural gas futures to explode higher in 2022.
The chart highlights the rally that took nearby NYMEX natural gas futures to $10.028 per MMBtu in August, the highest price in 14 years since 2008. After briefly probing above the $10 level, the price of October futures retreated and was above the $9.25 level on Sept. 1.
European natural gas prices point higher
Russia is the supply side of European natural gas demand as the energy commodity travels from Russia to Western Europe via pipelines. The war in Ukraine caused concerns that Russia will use natural gas as a weapon against the NATO countries supporting Ukraine, pushing prices to all-time highs earlier this year.
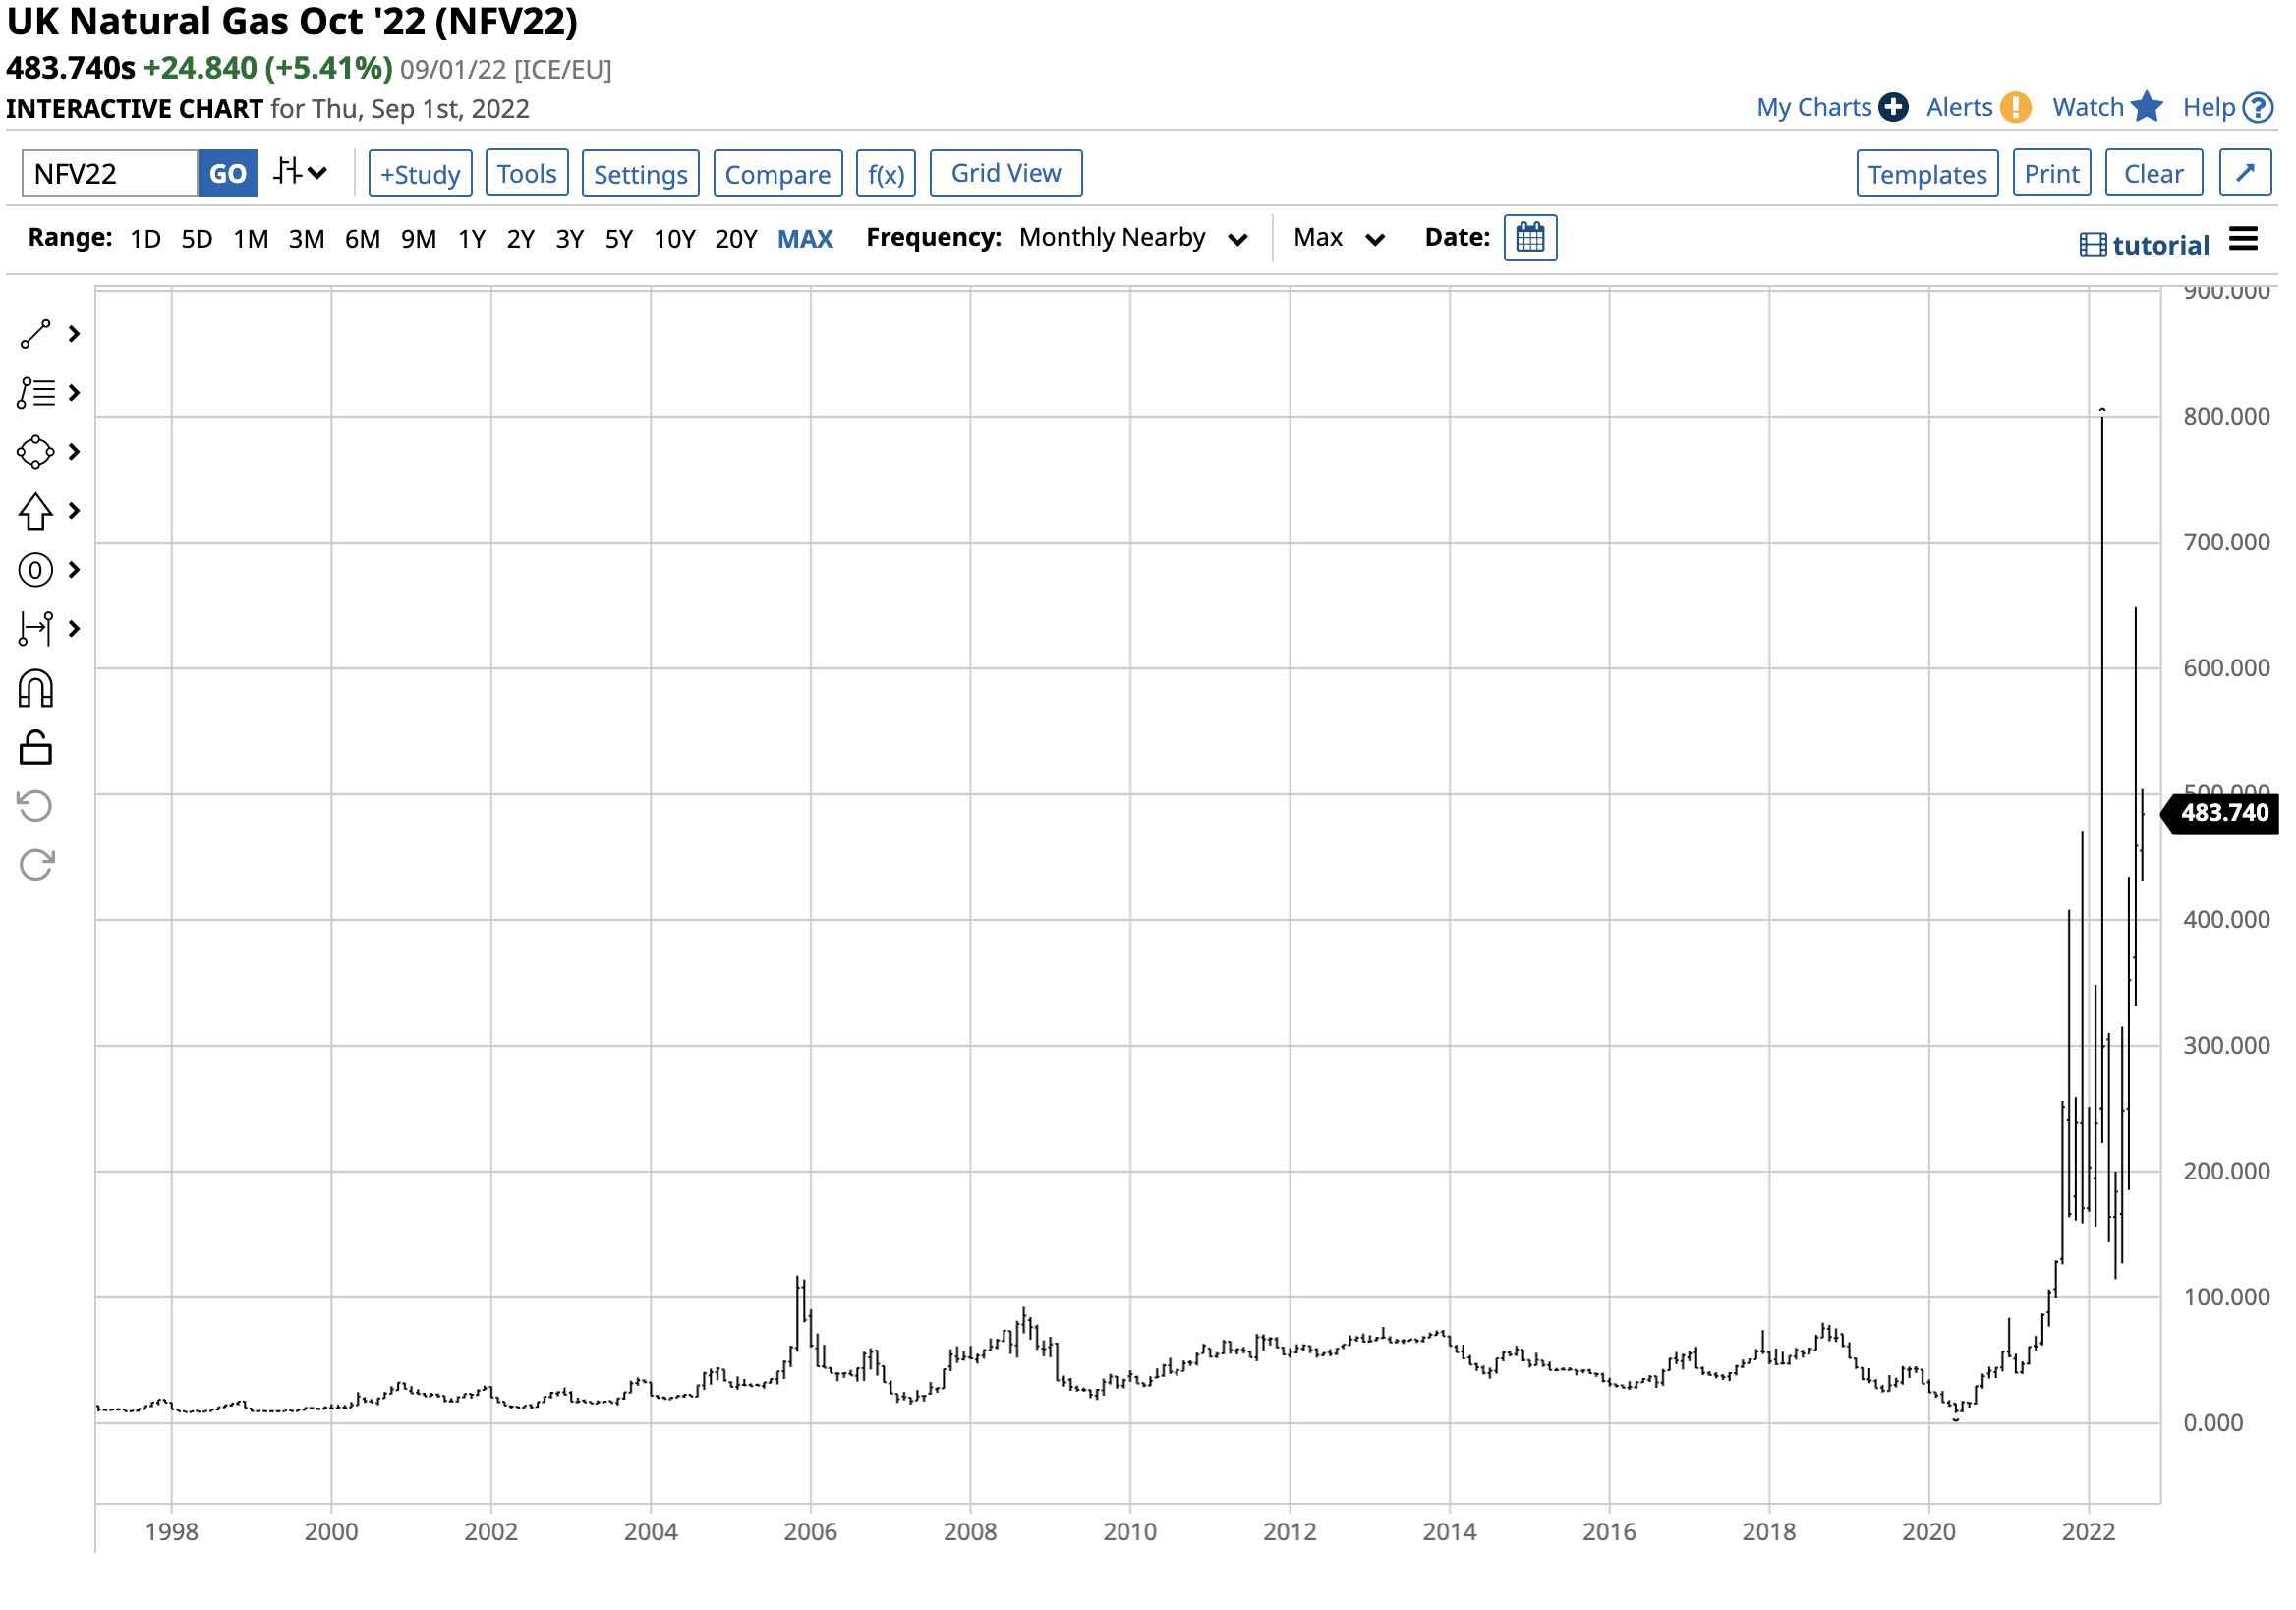
UK natural gas prices rose to a record high in March 2022 and remain far above the previous all-time high from 2005 in early September 2022.
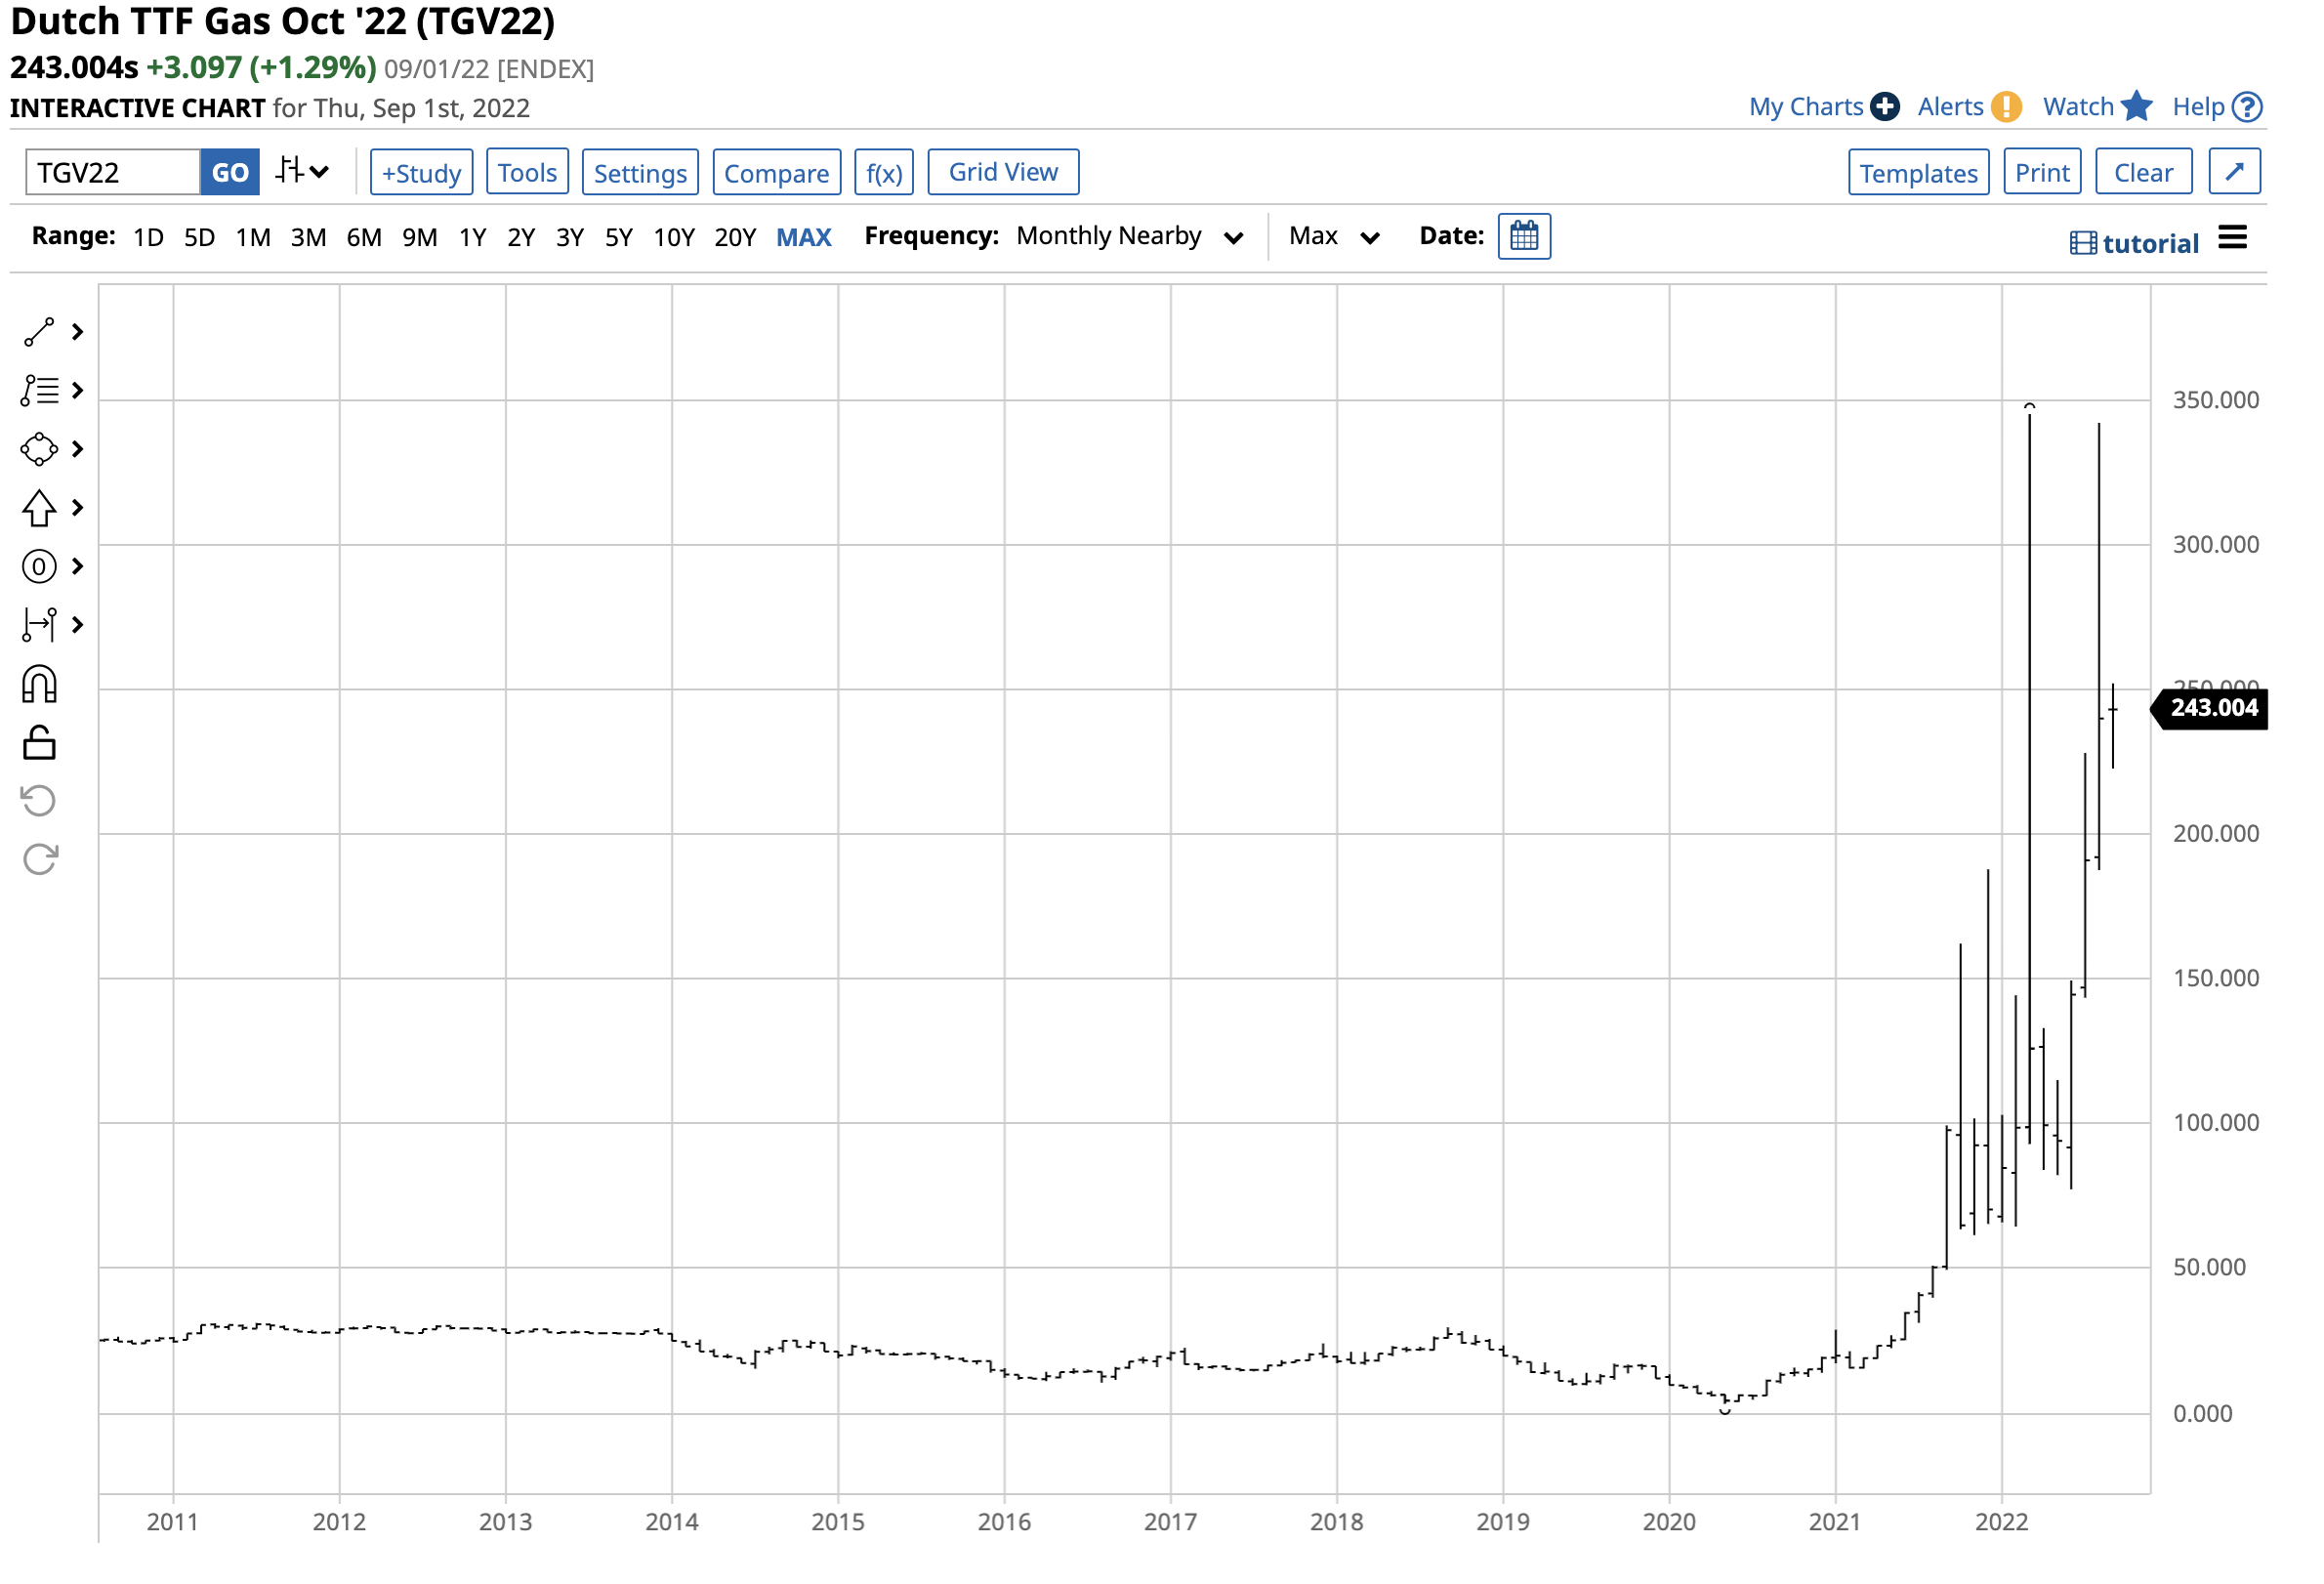
Natural gas in The Netherlands also rose to a record peak in March 2022 after Russia's invasion and is trading at levels closer to the March high than the pre-2021 peak.
As the peak winter demand season approaches, European prices that have already reached record highs could soar. As the war in Ukraine continues to rage with Europe and the US supplying the Ukrainian forces with weapons, Russia will likely take revenge by slowing or halting gas supplies to Europe.
Changing natural gas fundamentals
US natural gas futures prices had been in a decade and a half bear market from the 2005 record high to the June 2020 low. Over that period, massive discoveries of the energy commodity in the US Marcellus and Utica shale regions, and technological advancements in fracking, extracting gas from the earth's crust, pushed the price lower as supplies rose faster than demand.
Since necessity is the mother of inventions, the demand side of natural gas' fundamental equation began to increase. Gas replaced coal in US power generation, and liquefication allowed for transporting natural gas in liquid form, or LNG, far beyond the US and North American pipeline network. Ocean vessels now carry natural gas to Asia and Europe, where prices are far higher than in the US. The war in Ukraine has turbocharged LNG demand, and the US is struggling to keep pace as Europe seeks to replace Russian supplies.
From 2005 through 2020, US natural gas was a domestic energy commodity. Over the past few years, it has become more of a global energy source.
The peak season is on the horizon
Now that the summer has ended, natural gas futures are focused on the upcoming heating season, where US inventories decline. Prices tend to peak during the year's final months as the uncertainty of winter demand supports gains in natural gas prices. Natural gas is a highly seasonal commodity.
Meanwhile, with the price already probing above the $10 per MMBtu level for the first time since 2008, European prices at record levels with severe supply concerns, and the peak heating season approaching, the potential for higher highs is rising. US inventory levels in late August make replacing Russian natural gas deliveries to Europe a challenge.
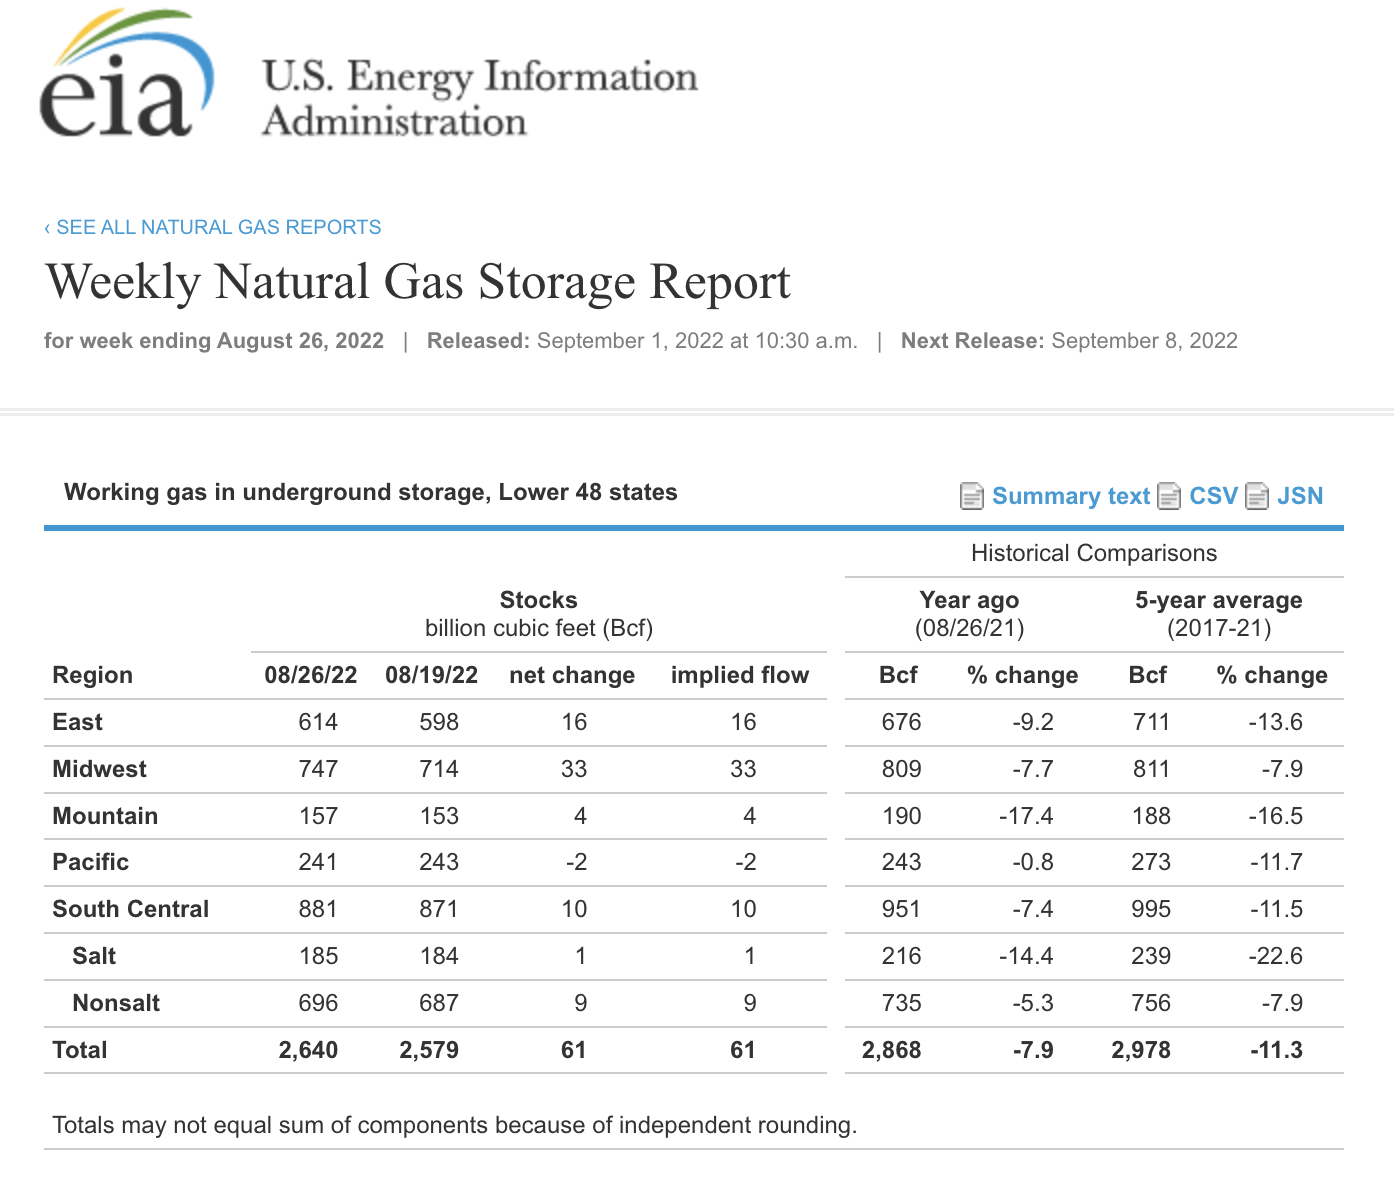
US Natural Gas Inventories as of August 26, 2022 (US Energy Information Administration)
The latest supply data from the US Energy Information Administration illustrates that natural gas in storage across the US was 7.9% below last year's level and 11.3% under the five-year average as of Aug. 26, 2022. US LNG shipments are unlikely to offset Europe's developing supply issues over the year's coldest months. Europe already has begun rationing natural gas and power in anticipation of the upcoming supply shortages.
The BOIL and KOLD products are short-term trading tools
Natural gas futures are not for the faint of heart, as prices have a long history of explosive upside rallies and implosive downside corrections. While the nearby NYMEX futures price traded to a low of $1.44 per MMBtu in June 2020, the range in 2022 has already been $6.39, reaching a low of $3.638 in January 2022 and a high of $10.028 per MMBtu in August.
We will likely see a continuation of wide price variance over the coming months, with the potential challenge of the 2008 $13.694 high and the 2005 $15.78 record peak. A cold winter in the US and Europe that causes inventories to drop to multi-year or all-time lows could cause explosive price action, as we have witnessed in the UK and Dutch natural gas market in 2022. A warm winter will likely weigh on prices as lower demand would offset the current supply concerns.
The most direct approach for a long or short risk position in the US natural gas market is the futures and futures options on the CME's NYMEX division. The ProShares Ultra Bloomberg Natural Gas product and its bearish counterpart ( KOLD ) provide an alternative for participating in the natural gas market without venturing into the highly volatile and leveraged futures arena. BOIL and KOLD are only appropriate for short-term trading as the leverage comes at a price, which is time decay. BOIL and KOLD offer market participants liquidity and ease of entry and exit as they trade on the stock market:
- At $104.35 per share, the bullish BOIL product had nearly $333 million in assets under management. The ETF trades an average of over 1.715 million shares daily and charges a 0.95% management fee.
- At $10.54 per share, the bearish KOLD ETF had over $157 million in assets under management. KOLD's average daily volume is over 13.66 million shares, and it charges the same 0.95% management fee.
BOIL and KOLD do an excellent job tracking and magnifying the price action in natural gas on a percentage basis. The latest rally in the current active month, October natural gas futures, took the price from $5.35 on June 30 to $9.987 on August 23, an 86.7% increase.
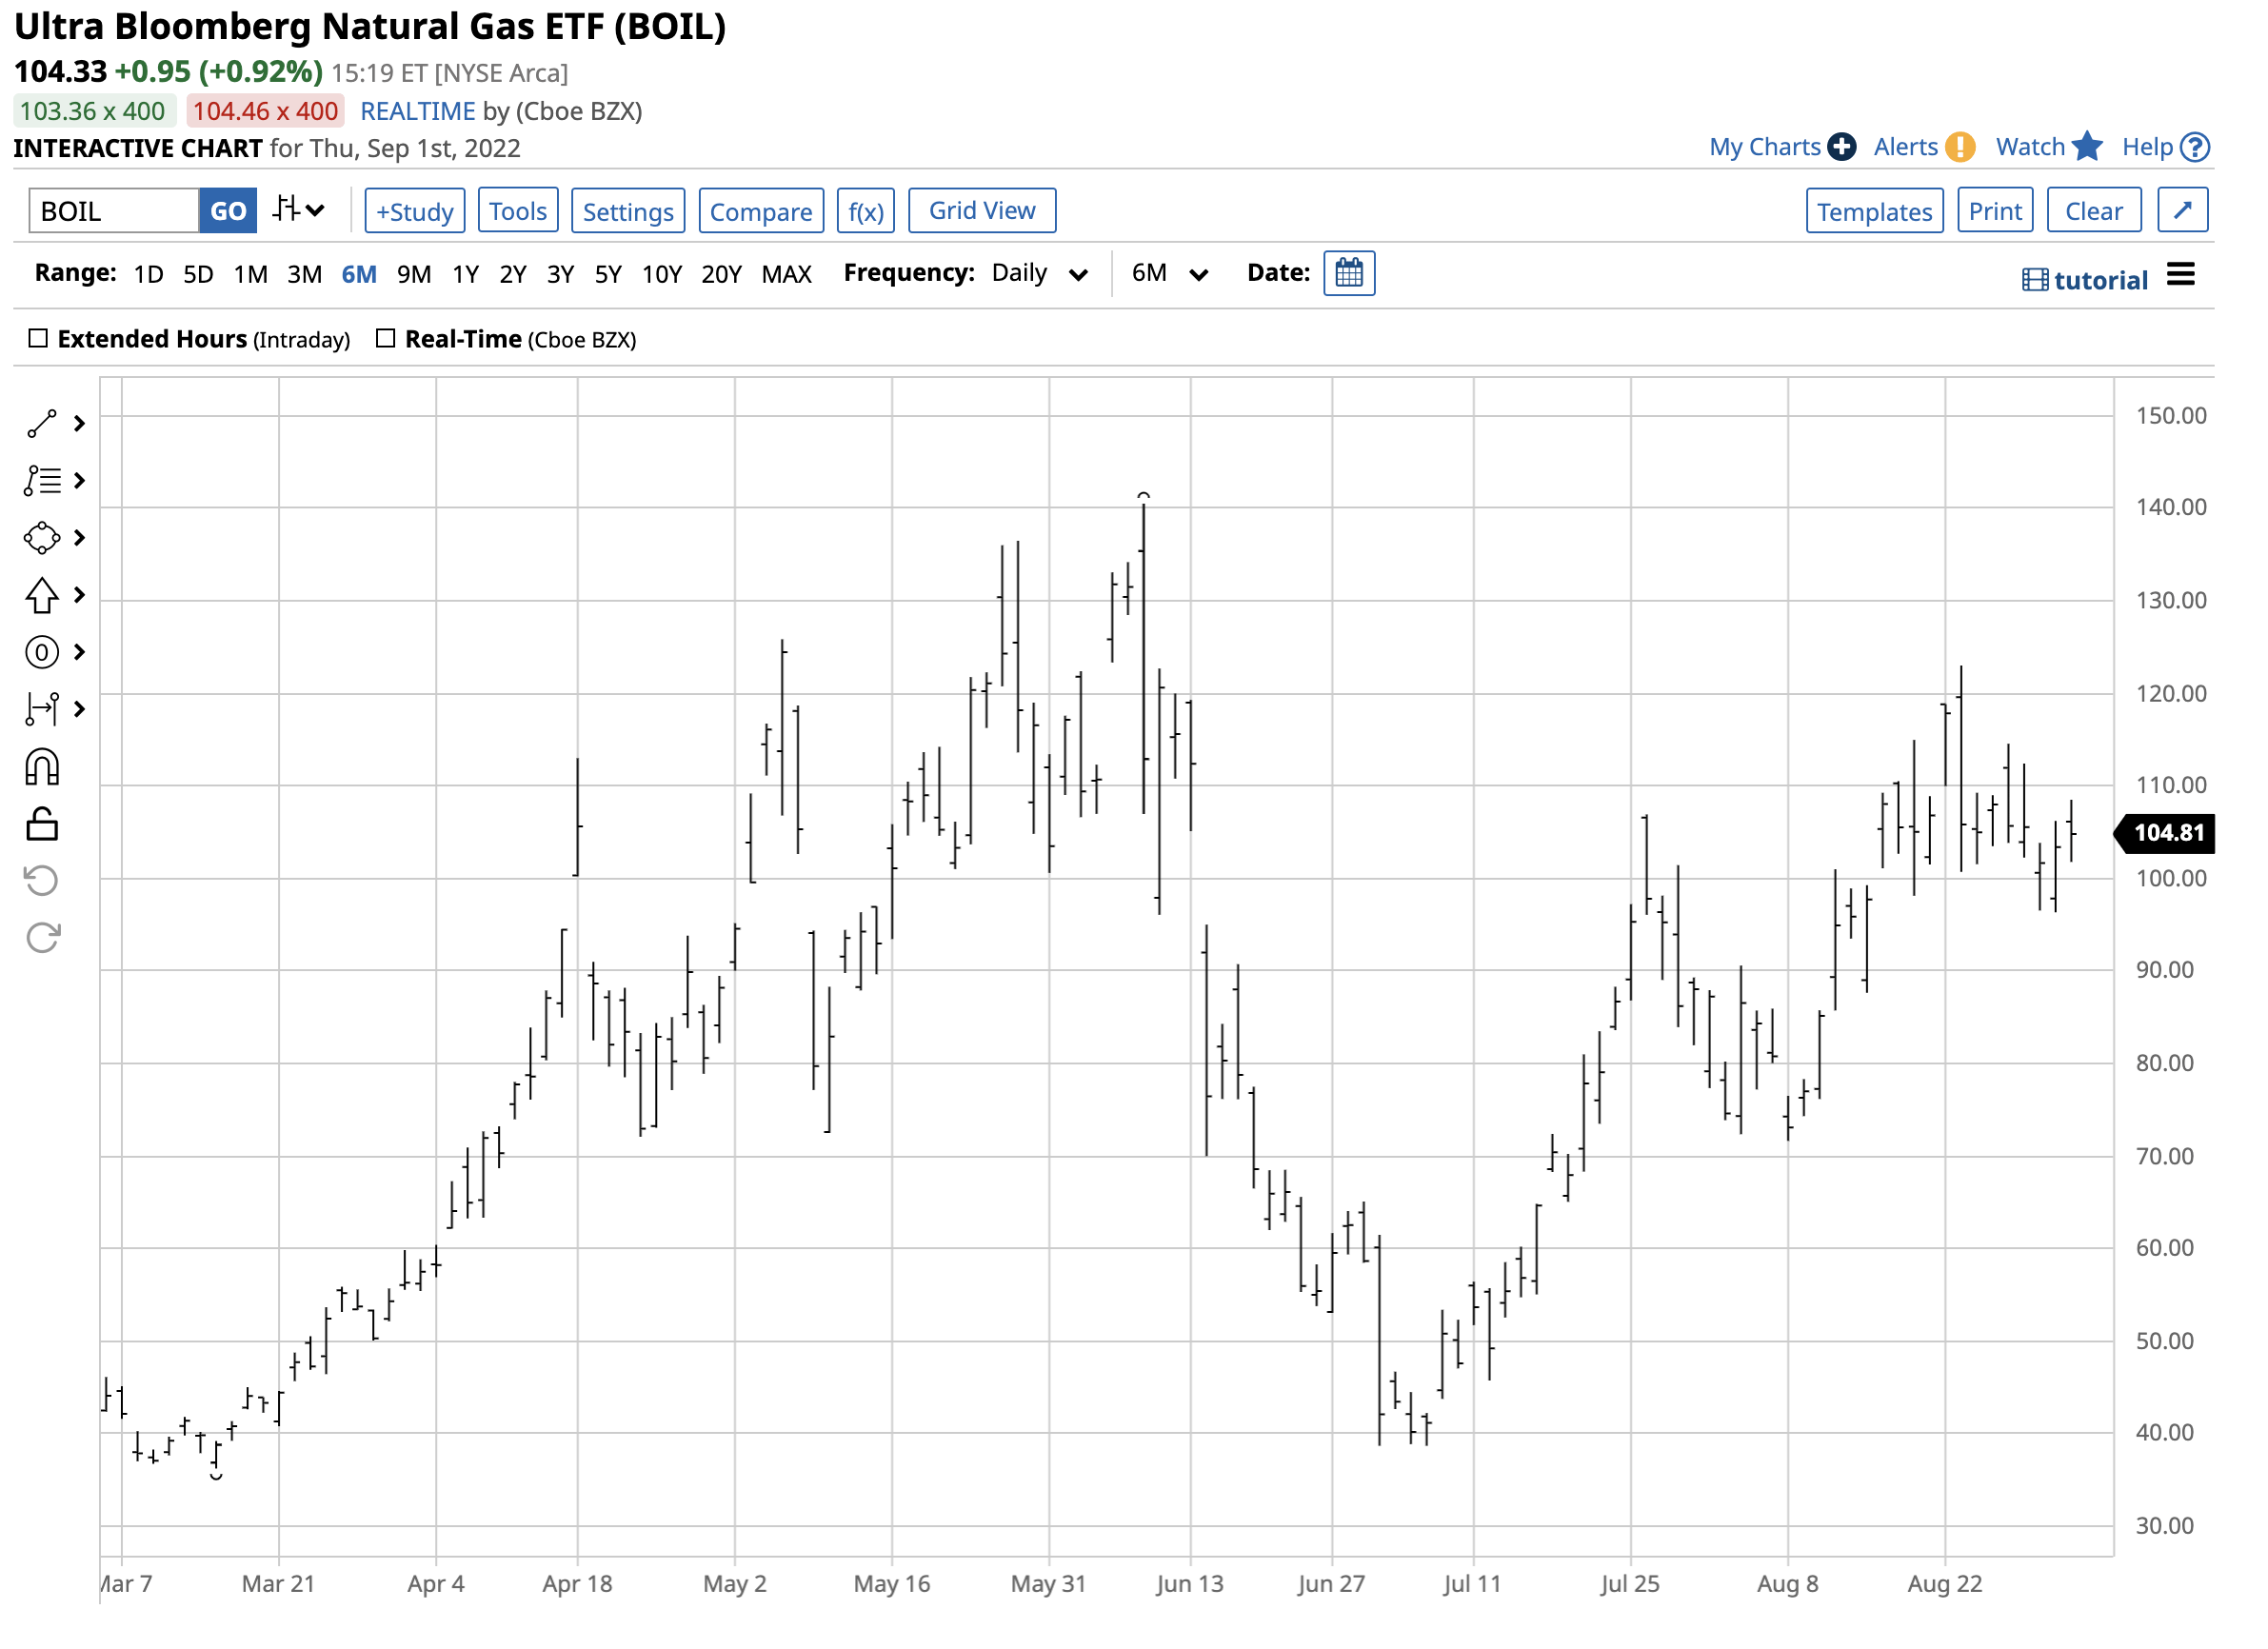
The chart shows the move from $38.71 to $123.00 per share or 217.7% during the rally. BOIL delivered an over double percentage gain than the October NYMEX futures contract. The recent correction took the October NYMEX futures price from $9.987 on Aug. 23 to a low of $8.814 per MMBtu on Aug. 31, an 11.75% drop.
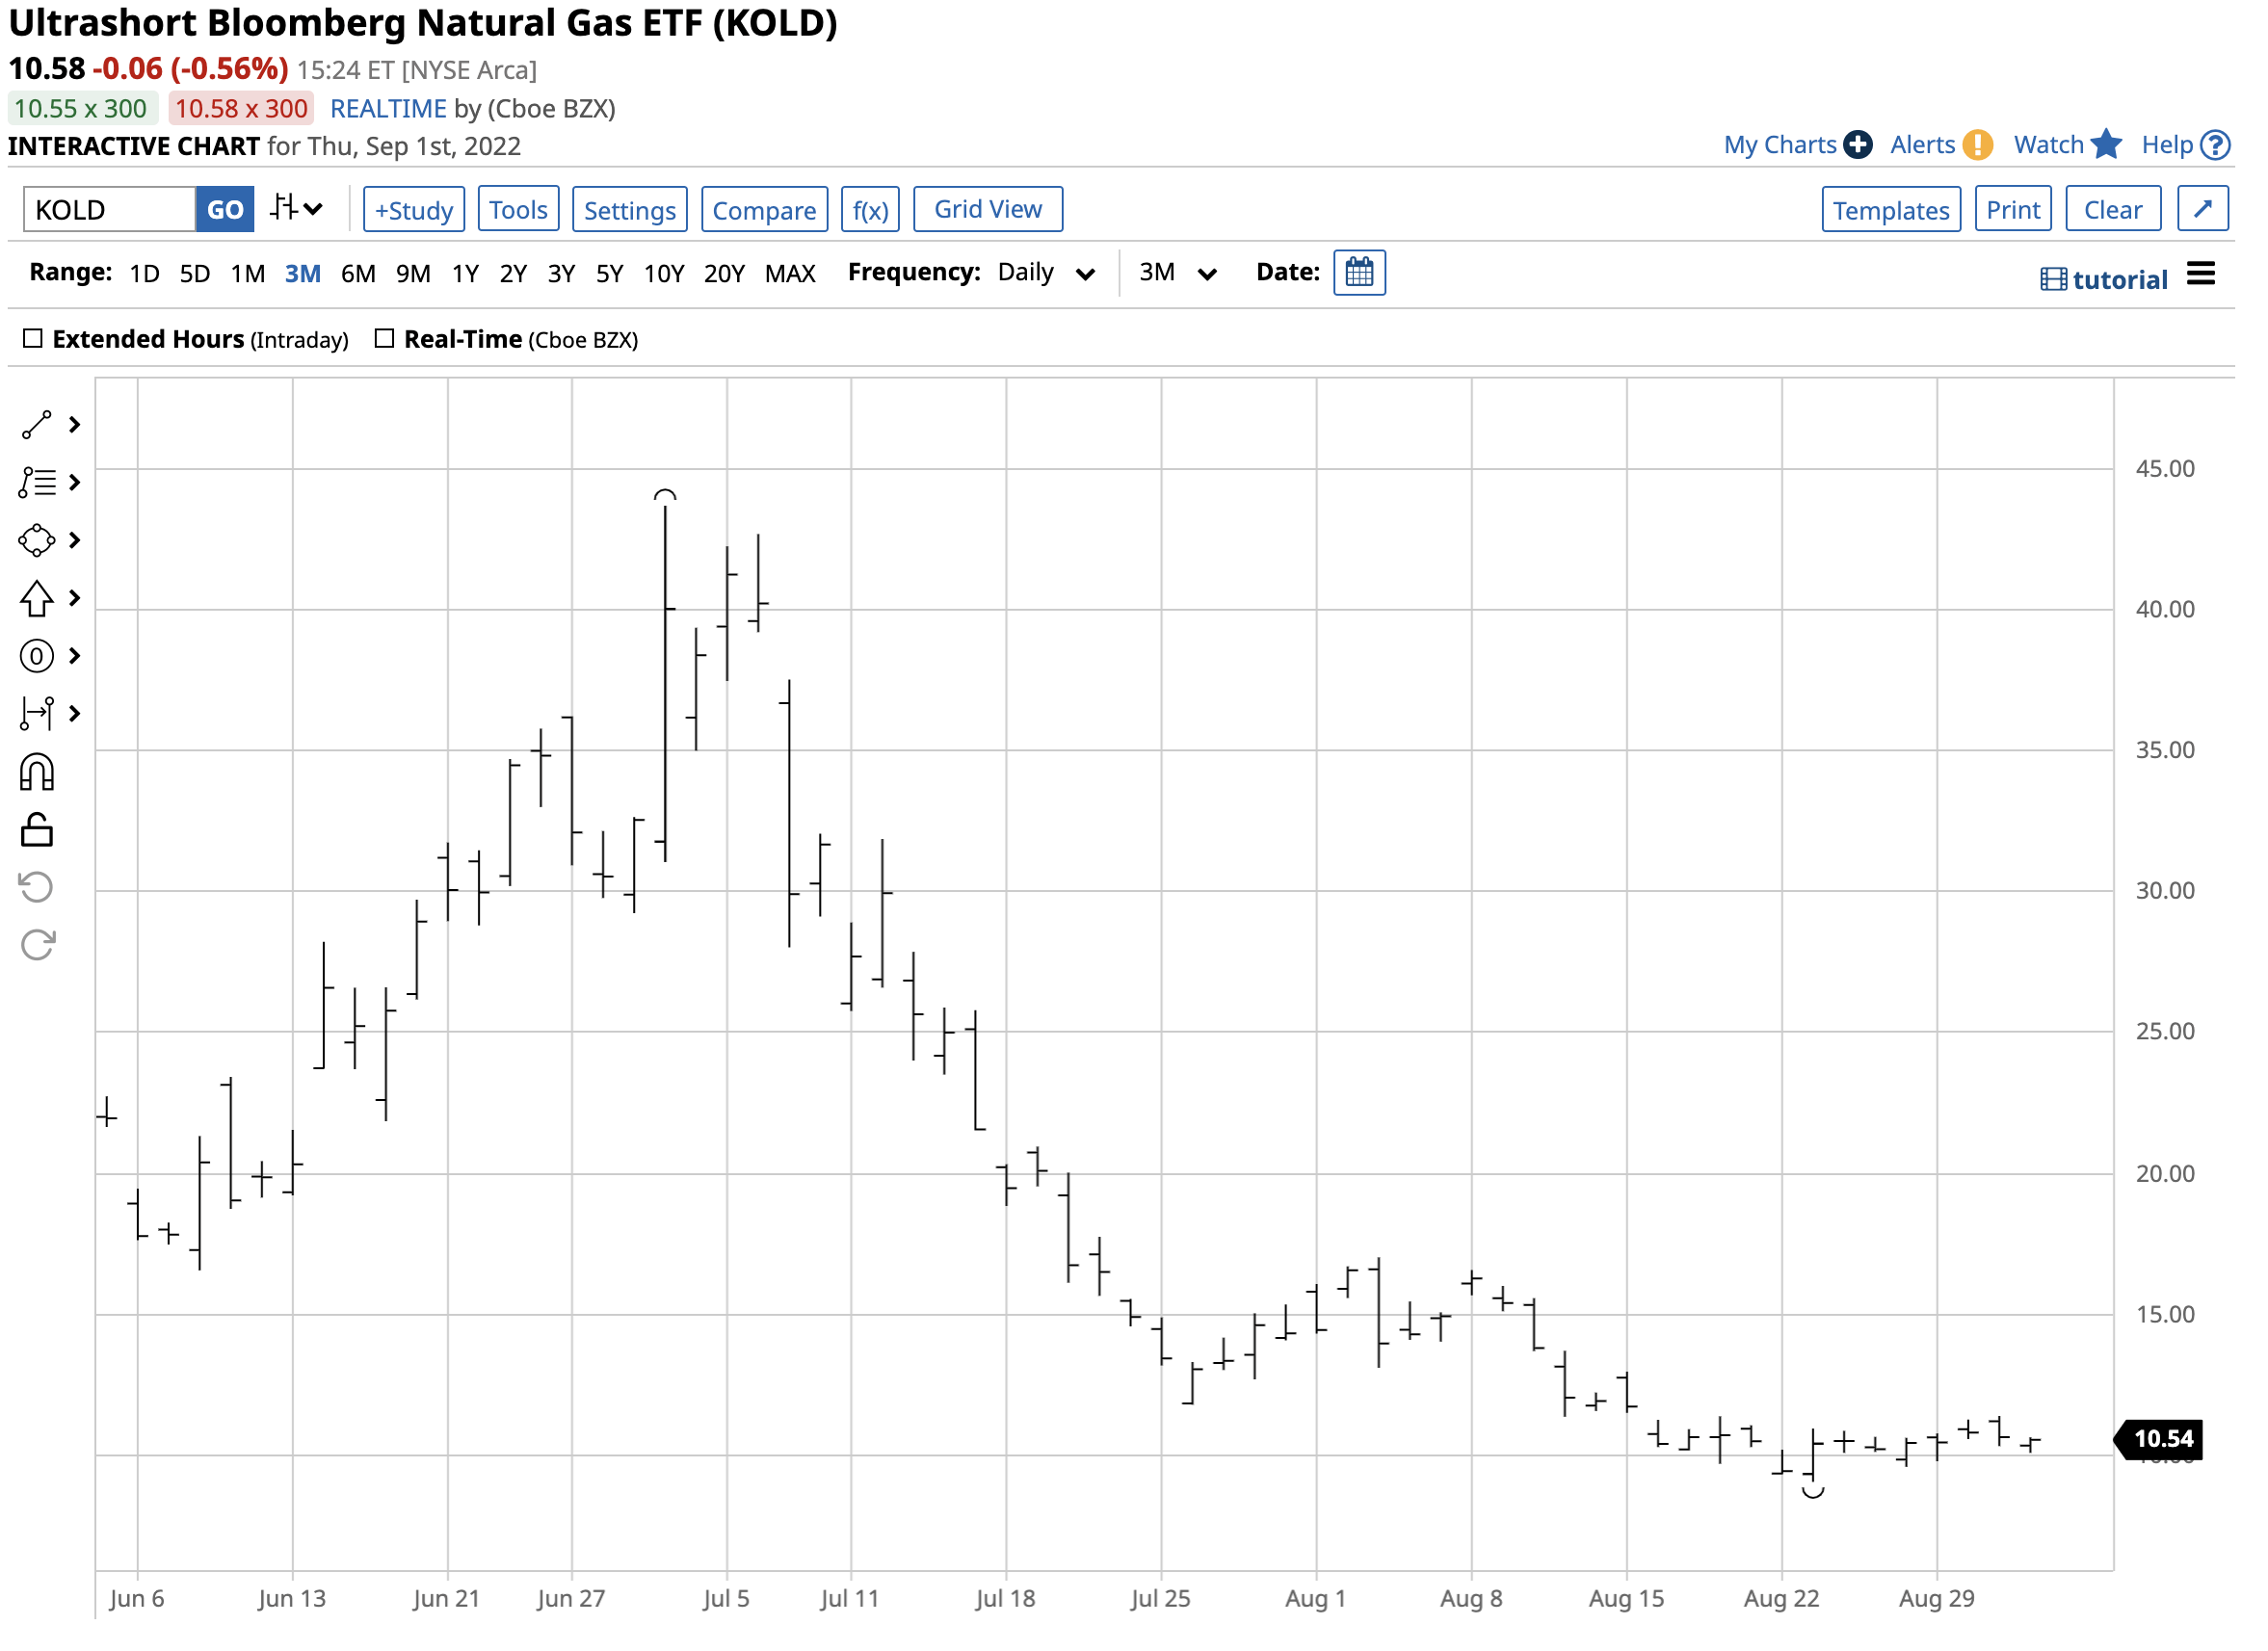
The KOLD ETF moved from $9.06 to $11.39 per share over the same period, a 25.7% gain as the price of natural gas futures declined.
BOIL and KOLD do an excellent job turbocharging the percentage gains and losses in the nearby contracts trading in the natural gas futures market. However, they are only appropriate for short-term risk positions, and only reflect pricing during the hours when the US stock market is operating. Highs or lows when the stock market is closed are not reflected in the BOIL and KOLD products.
Fasten your seatbelts for a wild ride in natural gas over the coming weeks and months. Fall and winter are typically volatile for the energy commodity, but the 2022/2023 peak season could be unusually volatile.
For further details see:
Natural Gas Hits $10: BOIL And KOLD Are Short-Term Trading Tools