TFC - Navigating M&T Bank: A Hidden Gem Or A Lost Cause?
2023-10-02 08:28:01 ET
Summary
- M&T Bank is a nuanced hold with a $155 price target, suggesting limited upside.
- Sturdy foundation: Conservative lending, robust capital, consistent dividend.
- Challenges: Increased nonperforming loans, low credit allowance, projected negative revenue growth.
- Vulnerable to inflation rebound, recession, and fintech disruptions.
- There is a potential 25% upside, but a 17% downside risk and a below-average dividend yield may not support a "buy" recommendation.
Investment Thesis
M&T Bank ( MTB ) is a nuanced hold recommendation. The current valuation with a price target of $155 suggests limited upside, offset by a stable foundation built on conservative lending practices and a strong capital position. The bank's reliable and growing dividend could be attractive to income-oriented investors.
However, challenges remain, including elevated nonperforming loans, negative revenue growth expectations, and potential economic headwinds. In particular, the low allowance for loan losses contributes to a worrisome coverage ratio that potentially exposes the bank to significant credit risk.
Existing MTB investors could prudently maintain their positions, but the bank's vulnerability to external factors such as inflation, recession or fintech disruption warrants cautious monitoring. Without a clear catalyst for rapid growth, holding MTB as part of a diversified portfolio remains a cautiously optimistic strategy.
Company Insights
We continue our series on regional banks, turning our focus to M&T Bank. We begin with a concise overview of the bank, examining its sentiment and highlighting any irregularities in MTB's financial records. Following this, we provide a forward-looking perspective on growth, dividends, and valuation, offering standalone and comparative analyses alongside its industry peers. We conclude by balancing the risks and rewards to determine our final verdict.
Overview
M&T Bank Corporation, headquartered in Buffalo, New York, is one of the larger U.S. regional banks with consolidated total assets exceeding $200 billion. Founded in 1856, it primarily operates in the Northeast and Mid-Atlantic regions and employs around 22,000 full-time and 600 part-time staff.
Below is a selection of M&T Bank's regional banking peers, ranked by total assets . The light orange area indicates the efficiency with which each bank uses its assets to generate profits, represented as a percentage on the secondary axis, providing additional colour .
Analysis: MacroDozer | Data Source: Koyfin
Insiders commend M&T for its conservative lending practices and robust risk management, particularly in commercial lending. The bank's community-focused approach is reflected in a broad range of services, from retail and business banking to wealth management. Its acquisition of People's United in 2022 significantly expanded its geographical reach.
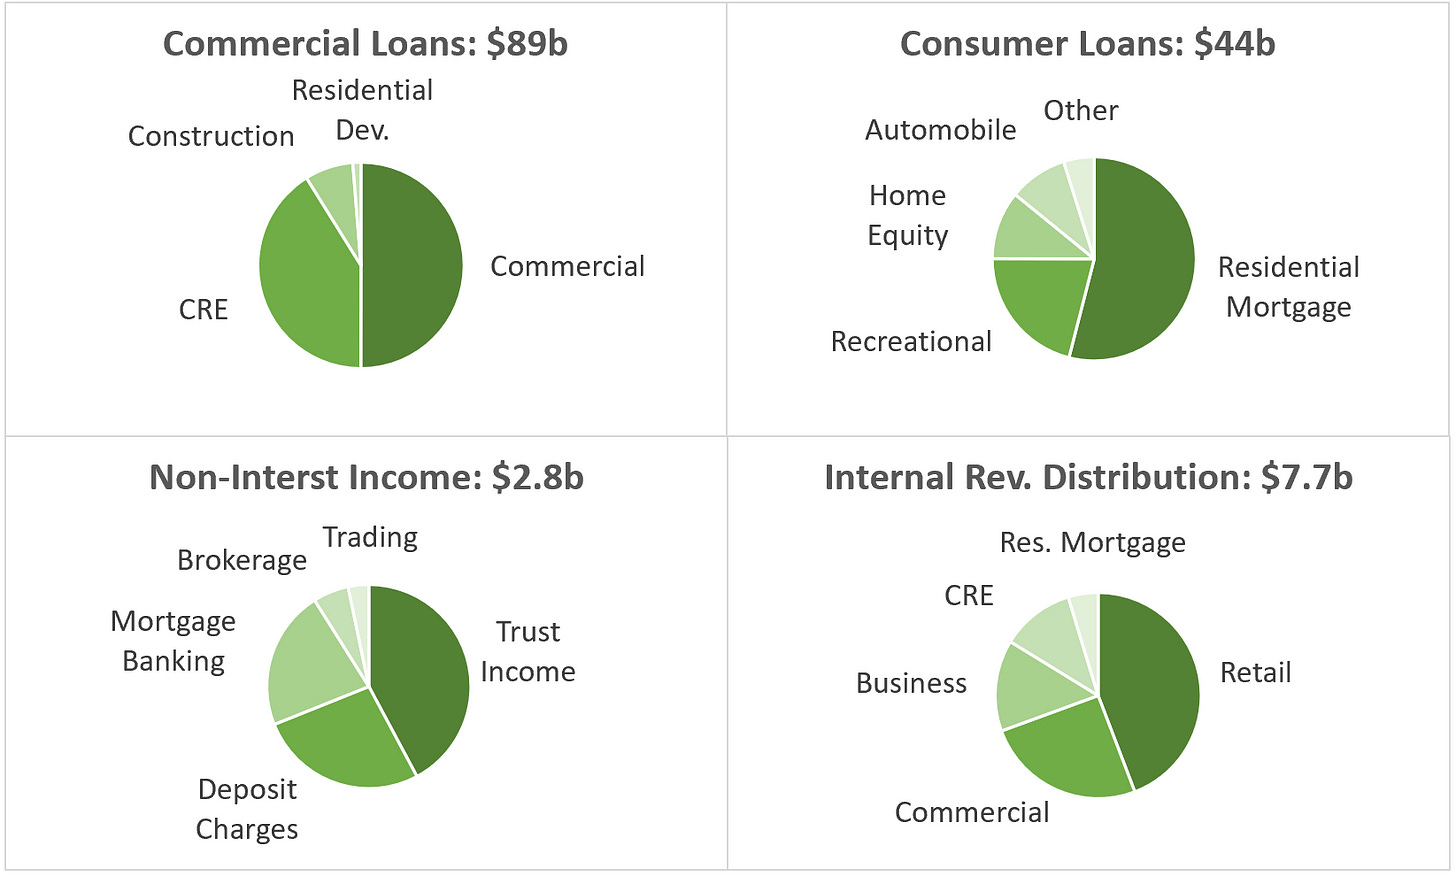
M&T Bank operates primarily through two key subsidiaries, M&T Bank and Wilmington Trust, which serve a diverse range of customer and business segments. The four pie charts below offer a breakdown of commercial and consumer loans, an overview of non-interest income, and a depiction of internal revenue allocation.
Graph by: MacroDozer | Data Source: M&T Bank (Q2 Report, 2023)
The company seeks to distinguish itself from other regional banks through its strong commitment to relationship banking and community engagement. Retail customers appreciate the personalized service and community-centric approach; however, some have raised concerns about fees and the digital platform's functionality. Business and commercial clients value the bank's prudent lending practices and localized expertise, even though they sometimes face prolonged loan approval times and a narrower range of financial products than larger banks. Those in wealth management particularly value M&T's long-term, tailored strategies.
Measuring a bank's reputation qualitatively is tricky. Glassdoor has long captured sentiment from employee feedback. While such data requires careful interpretation, it offers valuable insights, especially when benchmarked against peers.
Employee ratings for their companies include:
-
Management satisfaction: 1-5? (5 being best).
-
CEO approval: up to 100%.
-
Business outlook positivity: up to 100%.
MTB could look better on this graph, but with an 80% CEO approval, at least it's second among banks with a 3.3? rating.
Analysis: MacroDozer | Data Source: Glassdoor
Interest Income & Investments
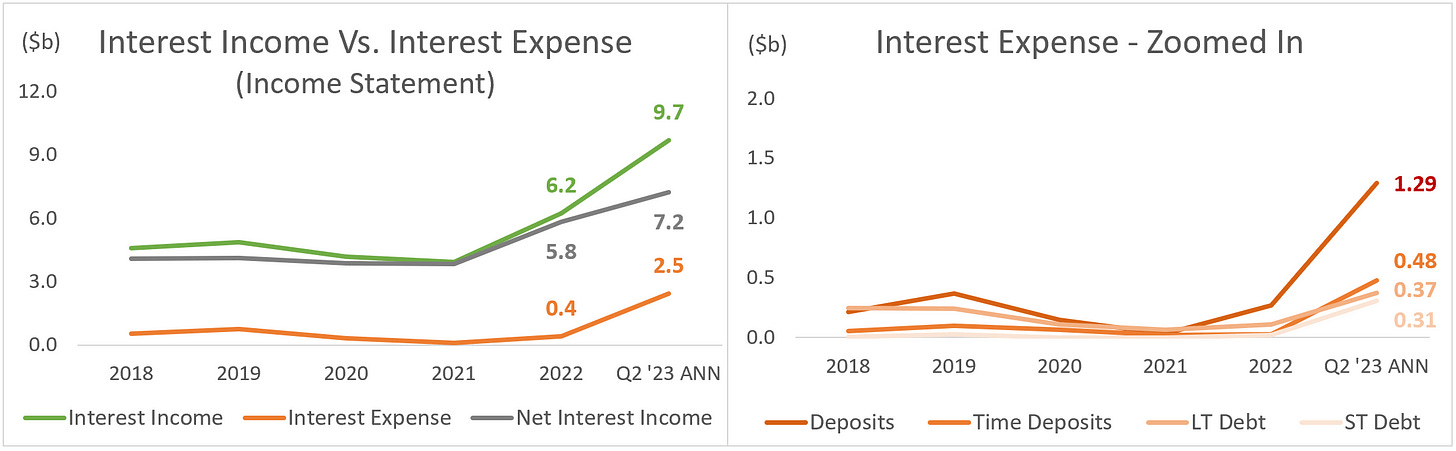
Net interest income has shown a sharp upward trend since 2021 . The significant rise in interest income has more than compensated for the corresponding increase in interest expense, which stems from pricier deposits and added costs associated with the escalation in both long- and short-term debt.
Overall, this development is quite positive. How long can this trend last? In our opinion, for quite a while yet. However, knowing that interest expense will eventually catch up is essential. This period provides an excellent opportunity for the bank to adjust its interest-earning assets and grow into a more robust portfolio.
For a visual overview, please refer to the chart on the left. For a more detailed breakdown of interest expenses, consult the chart on the right.
Graph by: MacroDozer | Data Source: M&T Bank (10K Reports, 2018-2022 & Q1-Q2 Reports, 2023)
Looking at the statement of comprehensive income, you will notice that MTB did not experience a significant decline or even a negative comprehensive income in 2022, which sets it apart from many other regional banks. However, this relative stability stems from MTB categorizing most investment securities as held-to-maturity ((HTM)). Within this category, fluctuations in fair value are not recognized in either the balance sheet or statement of comprehensive income; instead, the amortized cost method is applied. For further details, please refer to the chart below.
Analysis: MacroDozer | Data Source: M&T Bank (10K Reports, 2018-2022 & Q1-Q2 Reports, 2023)
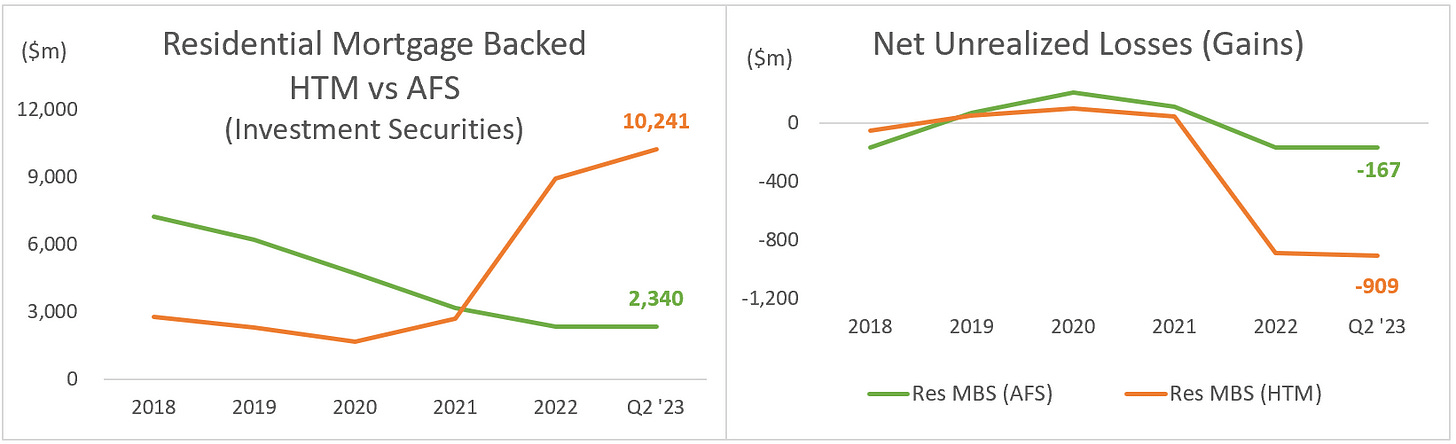
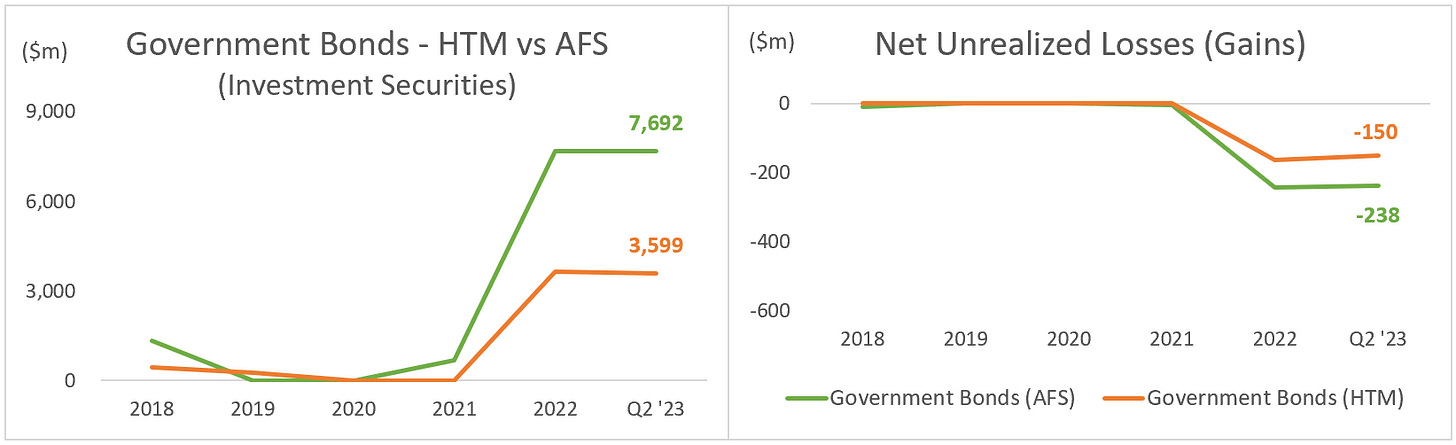
For clarity, we would like to outline the development of M&T's investment portfolio, primarily composed of residential mortgage-backed securities (Res MBS) and government bonds. The orange lines in the charts below represent the portions categorized as held-to-maturity securities. In contrast, the green lines indicate each investment type's available-for-sale (AFS) portions.
Currently, unrealized HTM losses over $1 billion (909 + 150) are effectively "masked" through the application of amortization. However, these unrealized losses are expected to decrease as the investments approach maturity. Alternatively, a reduction in the federal funds rate could also positively impact the valuation of these underlying securities and bring their market value back closer to their face value.
Graph by: MacroDozer | Data Source: M&T Bank (10K Reports, 2018-2022 & Q1-Q2 Reports, 2023) Graph by: MacroDozer | Data Source: M&T Bank (10K Reports, 2018-2022 & Q1-Q2 Reports, 2023)
Loan & Lease Portfolio
Before delving into the nuanced details of MTB's lending, we begin this section by examining the bank's key credit-related metrics against industry benchmarks.
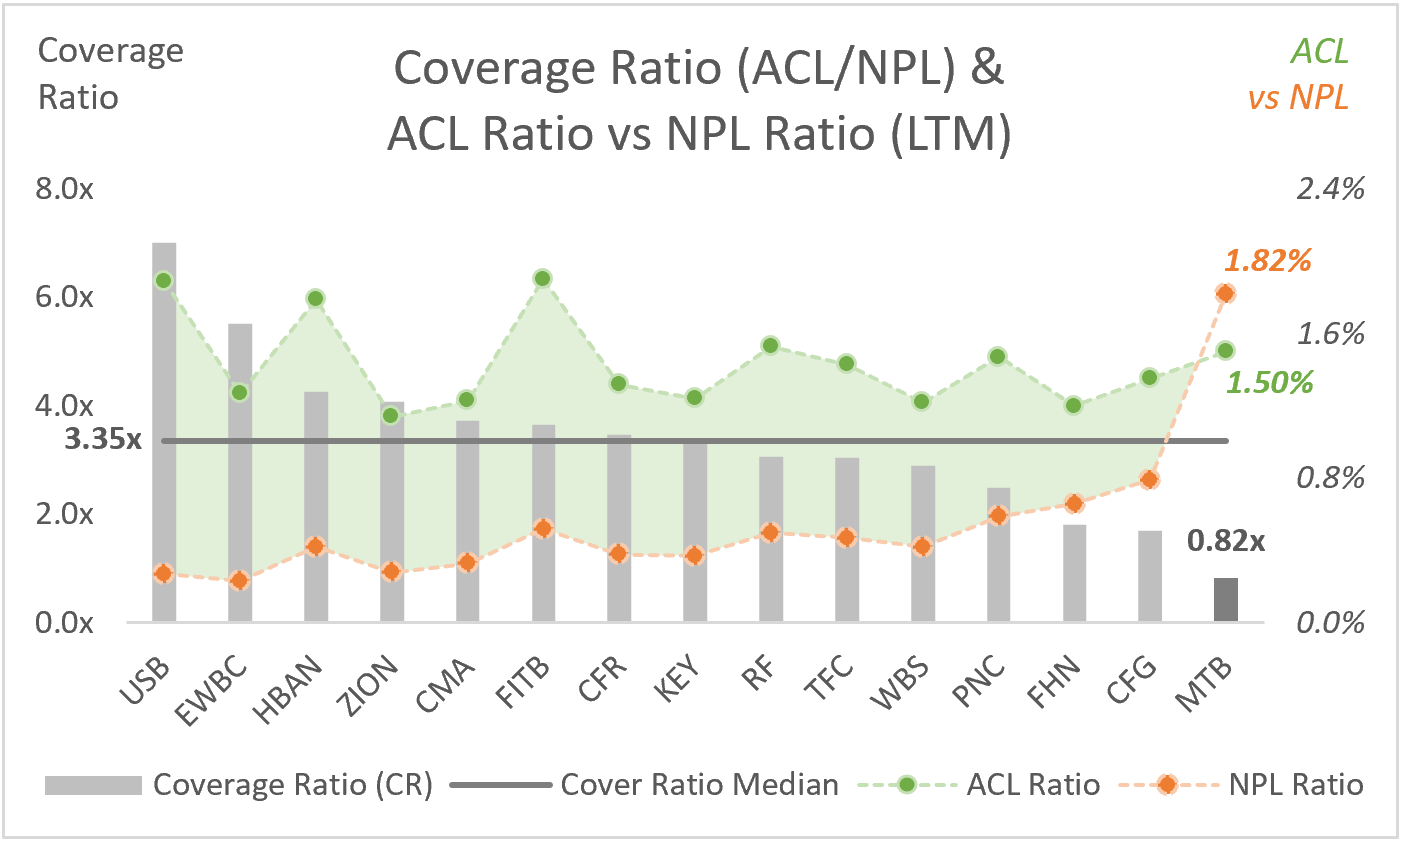
MTB is lagging behind its peers. The bank's rate of nonperforming loans (NPL Ratio) - those accounts delinquent for more than 90 days - stands at a concerning 1.82% of its overall loan portfolio. Furthermore, MTB's net charge-off ratio (NCO Ratio), which represents the total value of loans and leases deemed irrecoverable by the bank, is notably high, accounting for 0.38% of all loans and leases.
For a more detailed comparison, please refer to the accompanying chart, where the NPL Ratio is plotted on the x-axis and the NCO Ratio on the y-axis, illustrating MTB's performance relative to its selected peers.
Analysis: MacroDozer | Primary Data: Koyfin | Verified with: Latest M&T Bank & Peer Group Financial Reports
To our surprise, despite the relatively high percentage of nonperforming loans (1.82%) marked by the orange bold data point in the chart below, MTB's allowance for credit losses is only 1.50% of its total loan portfolio, highlighted by the green bold data point. This difference results in a coverage ratio of just 0.82x. Practically speaking, MTB's current allowances for credit losses would cover only 82% of its nonperforming loans, suggesting a significant potential credit risk for the bank.
Graph by: MacroDozer | Primary Data: Koyfin | Verified with: Latest M&T Bank & Peer Group Financial Reports
Further amplifying the concerns is the relative performance of MTB when placed alongside its industry peers. The median coverage ratio among MTB's peer group stands at 3.35x , as indicated by the dark grey line above, significantly higher than MTB's current 0.82x.
To put it into perspective, the bank's present allowance for credit losses totals $2 billion on its balance sheet. To align its coverage ratio with the peer group median, MTB would need to bolster its allowance for credit losses by an additional $6 billion, which would have to flow through the income statement as a loan loss provision expense. Achieving this would undoubtedly be demanding, especially considering that the bank's annual net income is only $3 billion.
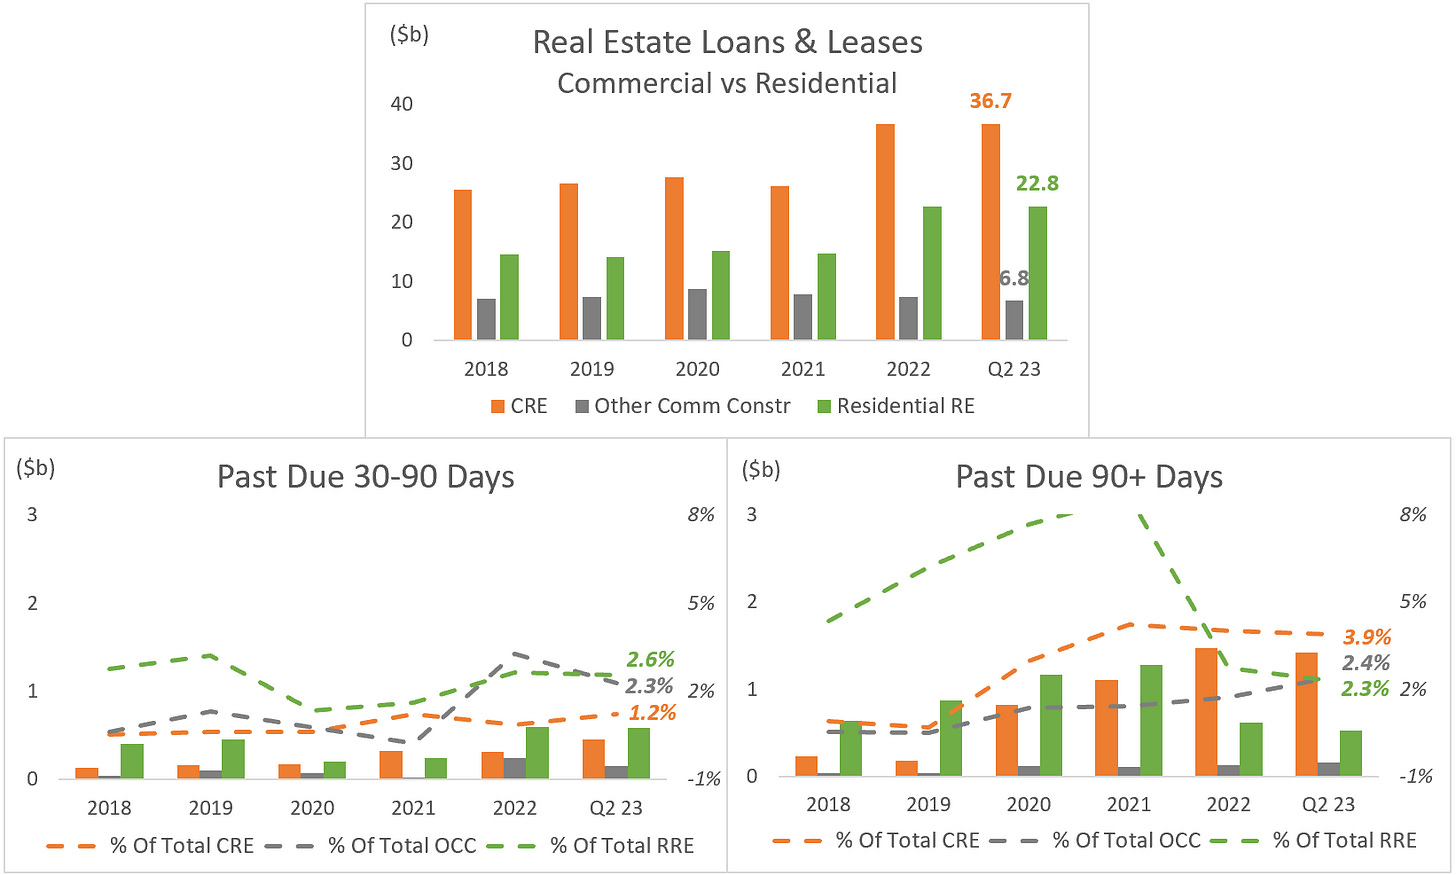
Let's focus on the bank's loan records dynamics to understand the causes behind the relatively high nonperforming loan metric. MTB's total loans & leases book stands at $133 billion. We'll analyze the real estate book, valued at $68 billion, and the consumer loan book, valued at $20 billion. We won't delve into the commercial & financial loan book, totalling $45 billion, as it has consistently displayed a relatively healthy nonperforming loan rate of around 1.0% over the years.
Below is a breakdown of MTB's $68 billion real estate portfolio, including its past-due amounts and ratios. Notably, commercial real estate ((CRE)), represented in orange, comprises the most significant portion of this portfolio. It warrants special attention due to its consistently high nonperforming loan rate of 3.9% and above over the past few years.
Graph by: MacroDozer | Data Source: M&T Bank (10K Reports, 2018-2022 & Q1-Q2 Reports, 2023)
Such an elevated level of troubled loans within this relatively large segment is undoubtedly a concern that warrants further examination. Below, you'll find a breakdown of the CRE portfolio. It's reassuring to see a healthy diversification, with the office segment constituting only 14% .
Graph by: MacroDozer | Data Source: M&T Bank (Q2 Report, 2023)
MTB highlighted in its recent investor presentation that the collateral coverage on most of its loans is robust. They noted that over 80% of their loans have an average loan-to-value (LTV) ratio of 70% or lower, offering a buffer against potential future losses in these portfolios. In previous economic downturns, such as the S&L Crisis, the 2001 Recession, or the Great Financial Crisis, the bank proved resilient despite even higher NPLs and NCOs.
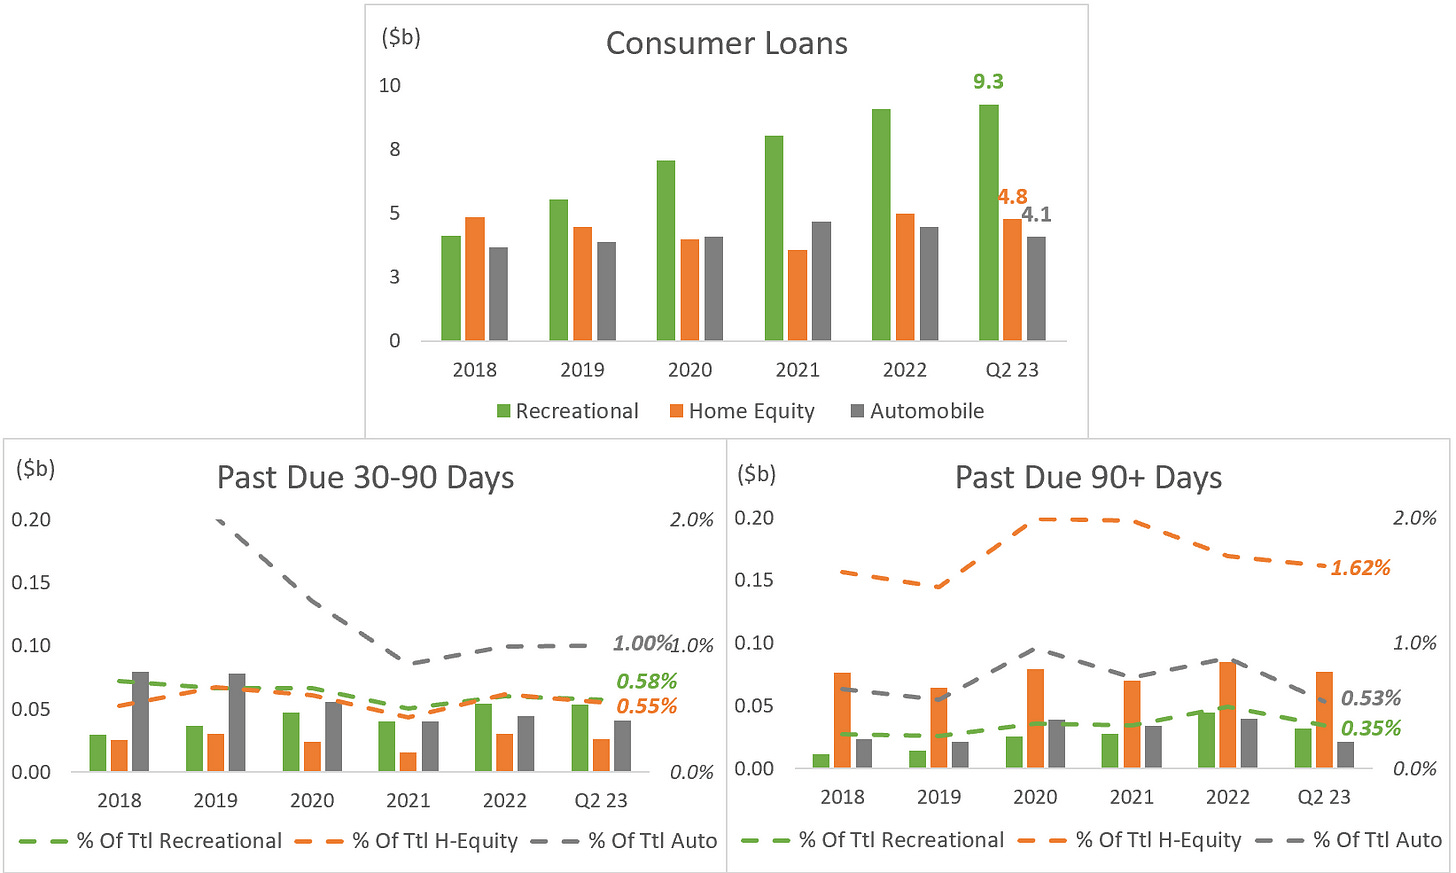
To conclude this section, a breakdown of the $20 billion consumer loans portfolio is presented below, detailing its past-due amounts and ratios. We've excluded the $2 billion categorized as "Other" for clarity. There are no alarming developments, in our opinion.
Graph by: MacroDozer | Data Source: M&T Bank (10K Reports, 2018-2022 & Q1-Q2 Reports, 2023)
Customer Deposits & Liquidity
Customer Deposits: The latest quarterly figures reveal that M&T Bank experienced a modest 2% uptick in its average total deposits for the quarter-to-date. This growth seems predominantly driven by an uptick in commercial and escrow deposits but was slightly offset by a reduction in municipal trust fund demand and consumer deposits.
Despite these fluctuations, the overall trajectory of the bank's deposits appears stable and doesn't invoke any concerns. For an insight into the customer deposit composition, please refer to the chart below, which showcases a breakdown of insured and uninsured deposits and interest-bearing and non-interest-bearing accounts.
Analysis: MacroDozer | Data Source: M&T Bank (10K Reports, 2018-2022 & Q1-Q2 Reports, 2023)
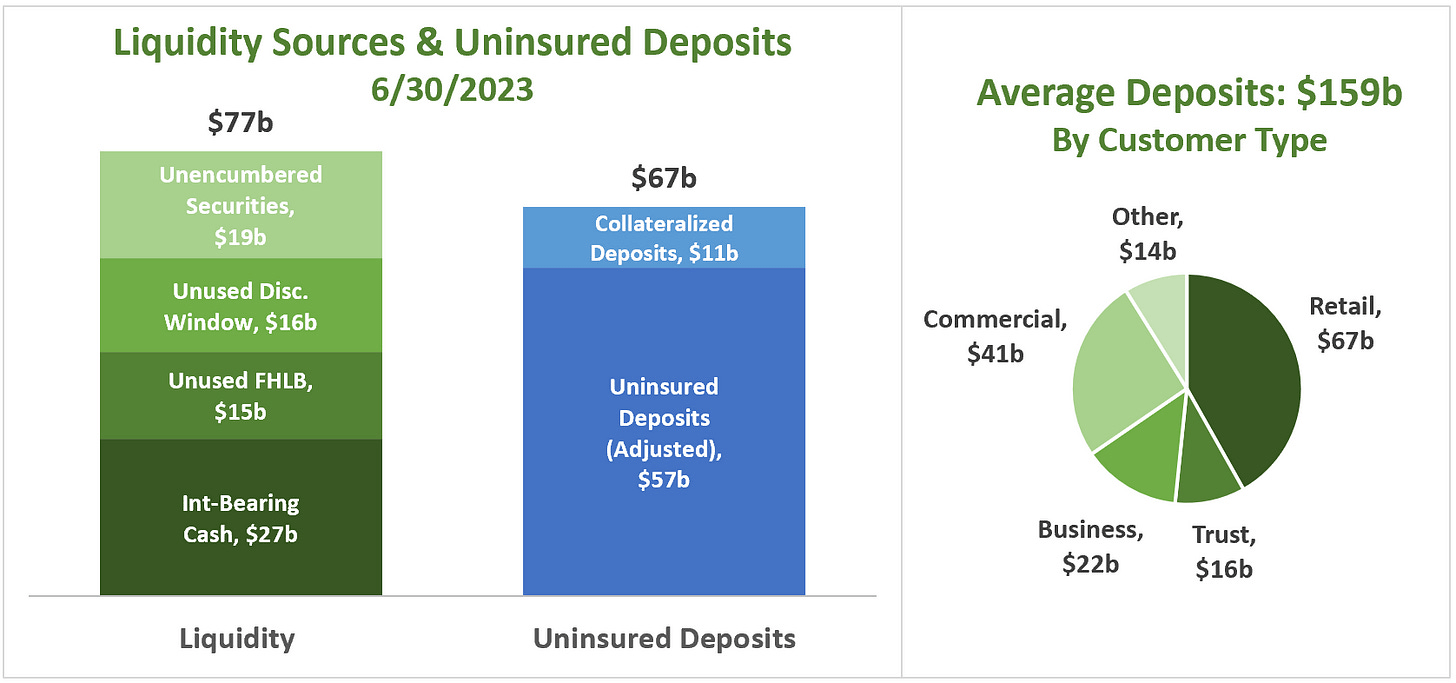
Liquidity: M&T Bank boasts a robust core funding and liquidity profile, bolstered by a diversified resource pool totalling $77 billion. The bank maintains a cash reserve that surpasses industry benchmarks and has an array of unencumbered securities ready for liquidation. Enhancing its liquidity stance, the bank can tap into standard contingent borrowing channels via the Federal Home Loan Bank (FHLB) and the Federal Reserve's Discount Window.
The immediate liquidity sources, totalling $77 billion, constitute 136% of the $57 billion in adjusted uninsured deposits - a satisfactory ratio. For a more detailed perspective, please turn to the stacked column charts on your left. The pie chart to your right shows the bank's average deposits over the last twelve months (LTM), segmented by customer type.
Graph by: MacroDozer | Data Source: M&T Bank (Investor Update 3rd Quarter 2023)
The deposit base showcases geographical diversity and is rooted in enduring relationships across diverse sectors. Starting with Retail deposits, the average account size is $12,000, spread across nearly 1,000 branches in 12 states. Within the Trust segment, the average account sizes are $154,000 for Wealth and $900,000 for Institutional Client Services. Business Banking touts an average account size of $45,000, while the Commercial Banking sector has an average account size of $3 million, with a median of $230,000.
Capital Management
MTB's regulatory capital ratio, Common Equity Tier 1 (CET1), which shows the bank's core equity (primarily common shares, retained earnings, and certain reserves, net of intangible assets) over risk-weighted assets, is a solid 10.6%.
Meanwhile, the leverage ratio (LR) - a measure of the bank's capital, including core capital and additional qualifying financial instruments over total assets - is 9.3%. Both figures are significantly higher than most of their larger peers and exceed the minimum requirements of 4.5% and 4.0%, respectively.
Analysis: MacroDozer | Primary Data: Koyfin | Verified with: Latest M&T Bank & Peer Group Financial Reports
Comprehensive Analysis: Valuation, Growth, and Dividends
In this comprehensive analysis of M&T Bank, we evaluate its growth, dividends, and valuation amidst its industry peers. While MTB showcases consistent growth and a solid dividend history, specific vulnerabilities emerge in its revenue trajectory and potential impacts from economic downturns. Valuation metrics present a mixed picture, with strengths in particular areas balanced against potential concerns. After an exhaustive review, considering historical data and future projections, we set a recommended share price target for M&T Bank at $155, highlighting a potential upside from its current market position.
Growth Analysis
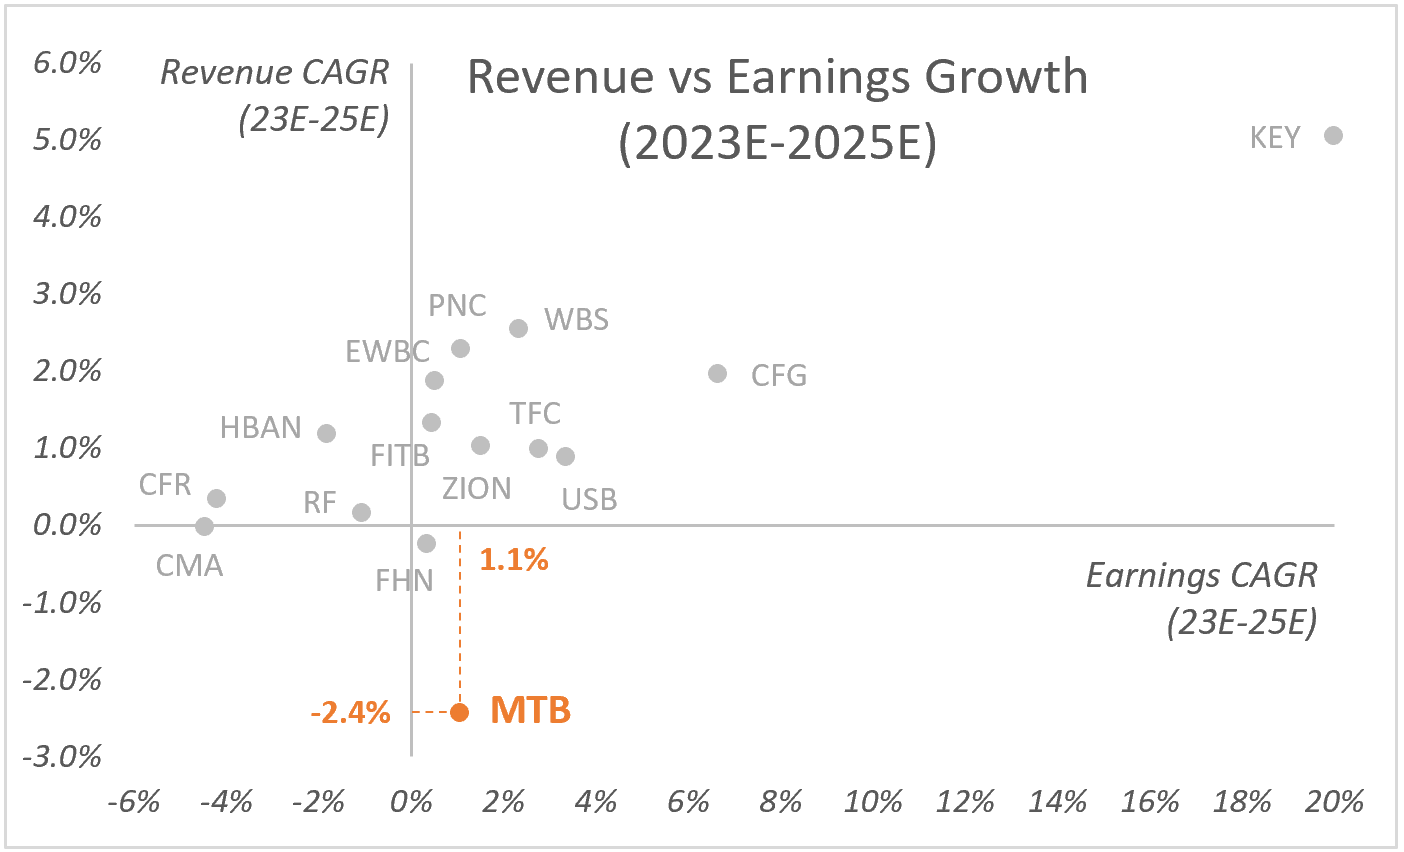
We have plotted the earnings and revenue growth on a scatter plot based on the CAGRs of the consensus estimates for 2023E-2025E.
MTB's annual earnings growth rate of 1.1% aligns with the group's median. While we are hesitant to challenge these earnings estimates too much, it's worth noting that, due to M&T's low credit allowances, its earnings might face more considerable downward revisions than its peers in an economic downturn.
However, the bank's revenue growth already stands at a negative -2.4%, which is notably low. Almost all peers display positive revenue growth, with the group's median at +1.0%
Graph by: MacroDozer | Data Source: Koyfin
In terms of strategic growth through mergers and acquisitions, there's always potential for more activity. However, given the recent acquisition of People's United in April 2022, which added $64 billion in assets to their existing $150 billion as of March 2022, we wouldn't anticipate any significant moves in the next 5-10 years.
Dividend Perspective
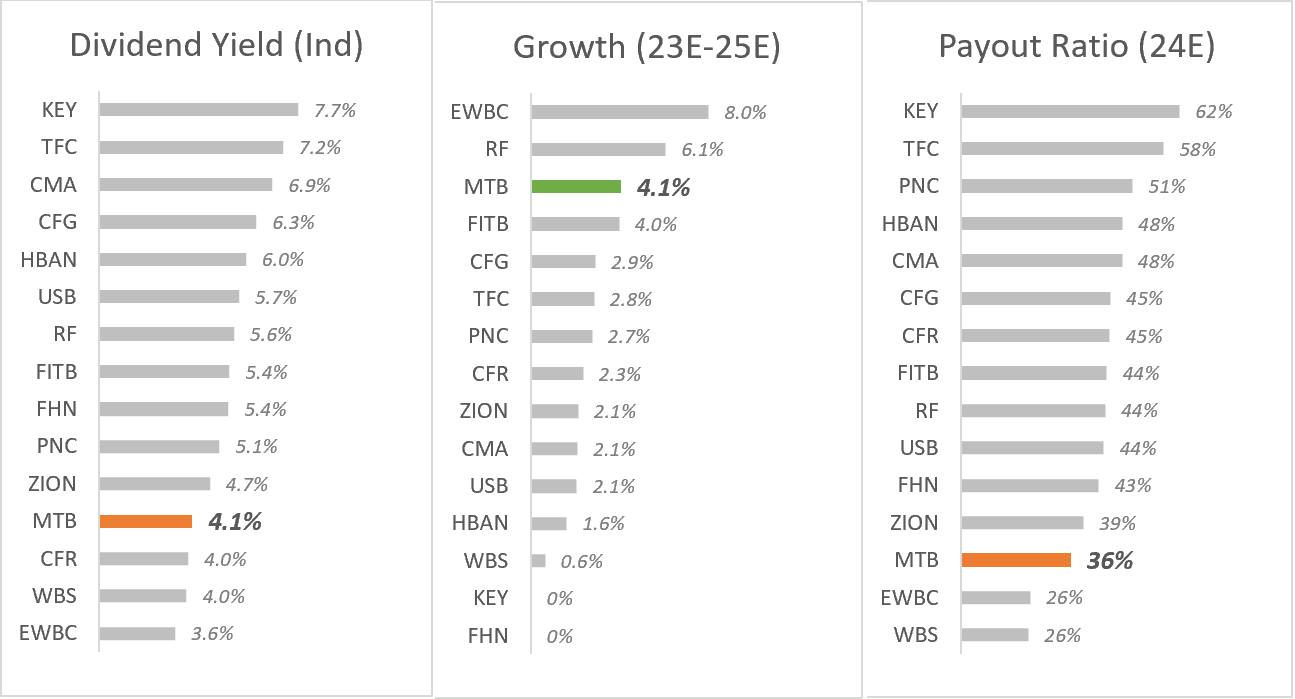
The bank has a solid track record, having paid dividends for 24 consecutive years and having grown its dividend for six successive years. It outperforms the sector median by 140% and 200%, respectively. This history underscores M&T Bank's commitment to delivering value to its shareholders.
However, there's a reason MTB can grow its dividend at an above-average rate: the current dividend yield and the projected 2024 payout ratio stand at a relatively modest 4.0% and 36%, respectively. These figures fall within the lower 30th percentile compared to their direct sector peers, as illustrated in the charts below.
Graph by: MacroDozer | Data Source: Koyfin
Looking at historical dividend yield levels from the past decade, M&T Bank's dividend yield is approaching its peak.
Source: Koyfin, Sep 26, 2023
Valuation
We employed the four most prevalent relative valuation metrics, displaying our findings mainly using scatter charts. These charts compare the Price-to-Earnings (P/E) with the Price-to-Sales (P/S) multiples and the Price-to-Tangible Book Value (P/TBV) with the Price-to-Book (P/B) multiples.
While our analysis primarily relies on future estimates, we also examined historical time-series data to assess multiple contractions and expansions over time - compared to peers and on a standalone basis.
The following chart presents the P/E and P/S valuation multiples (NTM) for MTB and its industry counterparts. The grey dots signify the current market positions of each bank, highlighting MTB's stance vis-à-vis its competitors. The chart also captures valuation percentiles based on the Last 10 Years (L10Y) of historical NTM data: the orange dots mark the 85th weighted percentile (upper valuation range), while the green dots signify the 15th weighted percentile (lower valuation range). Notably, all banks are trading proximately to their L10Y lower valuation range.
Analysis: MacroDozer | Data Source: Koyfin
The following chart drills down into the 2024E forward earnings and sales multiple comparisons. M&T Bank is outpacing most of its peers on both metrics, registering a P/E and P/S multiple of 8.4x and 2.3x, respectively.
Analysis: MacroDozer | Data Source: Koyfin
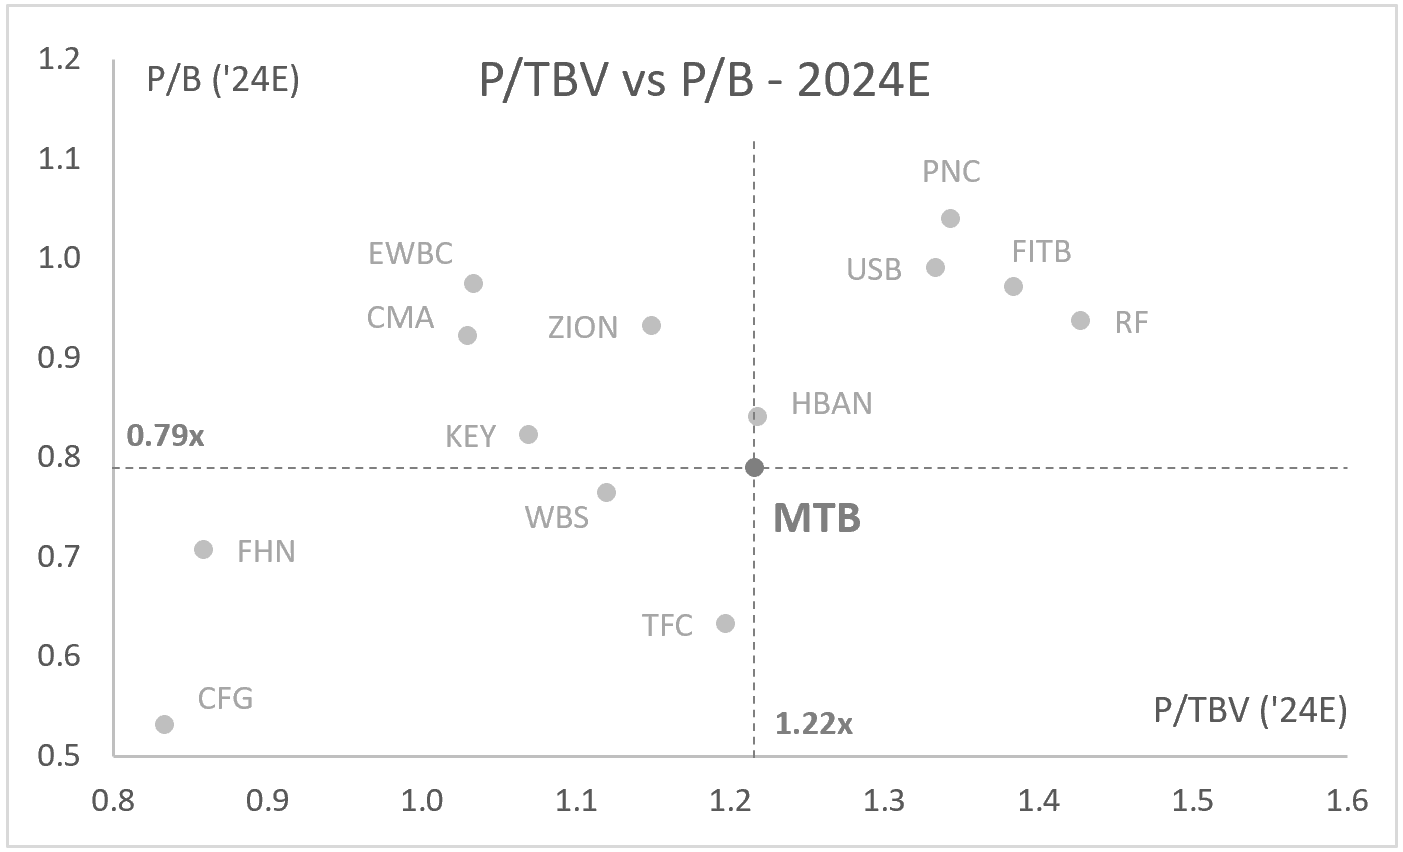
Transitioning to book values, the subsequent chart sketches the P/TBV and P/B valuation multiples (NTM) for M&T Bank and its peers. Mirroring the initial valuation chart, the grey dots pinpoint the current trading positions of each entity, highlighting MTB's positioning in the competitive landscape. This diagram, too, reflects valuation percentiles from the L10Y of historical NTM data.
Analysis: MacroDozer | Data Source: Koyfin
It's worth noting that numerous regional banks earmark almost half of their investment securities as "available-for-sale" (AFS) on their financial statements. This classification can transiently suppress equity or book values due to unrealized losses, inadvertently elevating the tangible/book value multiples. Thus, several grey dots in the preceding chart should align more with their green equivalents.
In the upcoming 2024E tangible/book value multiple visualizations, MTB appears somewhat below the mean of its peer group. This contrasts with the observations from the earnings and sales multiples. A plausible explanation is that a large share of MTB's investment securities are earmarked as held-to-maturity, preventing unrealized losses from diminishing the book values. This dynamic results in MTB's book value multiples being more conservative than peers who grapple with temporary available-for-sale markdowns. M&T Bank's trading multiples stand at P/TBV of 1.22x and P/B of 0.79x, respectively.
Graph by: MacroDozer | Data Source: Koyfin
Verdict
After thorough qualitative and quantitative analysis, as well as comparing M&T Bank both on its own merits and relative to its peers, and considering both historical and prospective data, we recommend the following estimated multiple ranges for 2024 to set a price target for M&T Bank:
P/E 24E: 9.5x - 11.5x
P/S 24E: 2.5x - 3.0x
P/TBV 24E: 1.40x - 1.65x
P/B 24E: 0.90x - 1.05x
In our final valuation chart, we apply each multiple range to today's share price to determine a fair price range for each metric. Ultimately, we suggest a share price target of $155, representing a potential upside from today's price.
Analysis: MacroDozer | Data Sources: MacroDozer & Koyfin
Risk-Reward
The price target of $155 implies a theoretical upside potential of around 25%, supported by a solid, albeit slightly below-average, dividend yield. To provide a holistic view, it's essential to outline potential downside scenarios, juxtaposing risks against the projected rewards.
Inflation Rebound: If inflation revisits recent peaks, purchasing power may decrease, potentially leading the Federal Reserve to persist with rate hikes. This could result in reduced loan demand and a rise in defaults for M&T Bank, especially among variable-rate borrowers. Fixed-income investments may devalue, causing customer withdrawals due to liquidity or cost-of-living concerns.
Recession: In a significant economic downturn, businesses might face plummeting revenues and soaring unemployment. M&T Bank could then see rising loan defaults and reduced loan demand. Liquidity challenges might arise if depositors withdraw funds largely, putting strain on the bank's financial stability.
Fintech Disruption: The ever-evolving fintech realm introduces innovations potentially eclipsing traditional banking. If M&T can't match a fintech newcomer's offerings, they could witness a slump in new accounts, particularly among the youth. Attempts to adjust might be hindered by technical issues and rising operational costs, impacting the bank's competitiveness and profitability.
Doomsday Share Price Projection
Given these scenarios, valuation multiples might plummet to all-time lows, potentially driving the share price close to $105, as illustrated in the chart below.
Analysis: MacroDozer | Data Source: Koyfin
However, it's essential to recognize that MTB's current situation diverges from periods of previous lows, such as the Great Financial Crisis. Since then, the bank has grown by acquiring four significant institutions: Provident, Wilmington Trust, Hudson City, and People's United. Consequently, in the grimmest scenario, valuation multiples could, in theory, fall even more profoundly than any past low.
In our assessment, an upside potential of 25% doesn't compensate for the potential risk of a 17% downturn, especially when coupled with a below-average dividend. Thus, while M&T Bank doesn't qualify as a "buy" in our book, it might fit comfortably in a diversified portfolio for those who possess deeper insights than we do or for whom emotional attachment outweighs the numbers.
Conclusion
M&T Bank presents a nuanced investment proposition. While it offers stability through conservative lending practices and a strong capital position, it faces challenges like elevated nonperforming loans and negative revenue growth expectations. The low allowance for loan losses raises concerns about credit risk. Given potential external factors, existing investors may consider maintaining their positions, but vigilance is required. Holding M&T Bank as part of a diversified portfolio remains a cautiously optimistic strategy.
For further details see:
Navigating M&T Bank: A Hidden Gem Or A Lost Cause?