NEO - NeoGenomics: Short-Term Upsides Possible Long-Term Not Supported By Economic Value
2023-10-25 06:30:00 ET
Summary
- NeoGenomics, Inc. has caught a bid in recent weeks, reversing off this year's lows.
- The market has priced a high required rate of return for buying NeoGenomics today, indicating a substantial degree of implied risk.
- The company's economic characteristics and technical indicators support a neutral stance.
Investment update
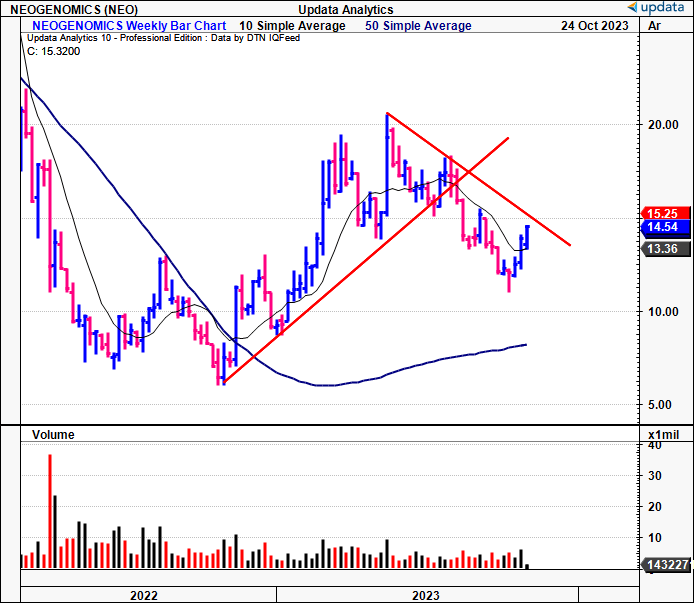
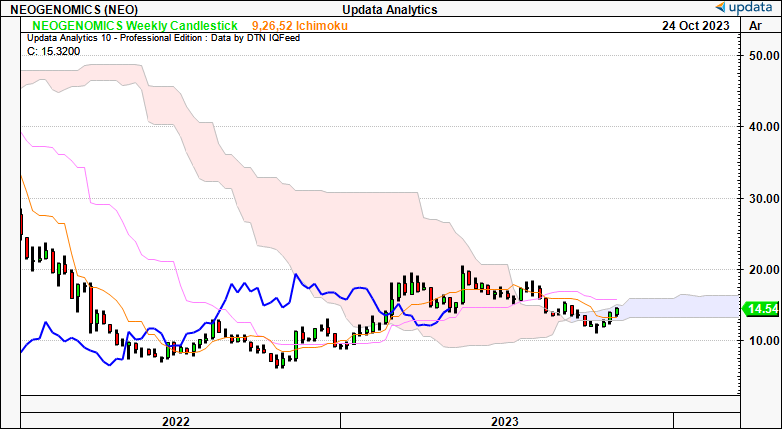
Rising market tensions, the inflation/rates axis, geopolitical risks, and a broad equity selloff have compressed the market values of unprofitable small-cap names in H2 '23. Since my August publication , NeoGenomics, Inc. (NASDAQ: NEO ) has travelled ~5% to the downside, curling off its '23 lows over the last month (Figure 1). It now trades above its 50DMA, indicating a potential short-term reversal.
A combination of fundamental and technical data is required to analyze NEO in with sound economic principles. It's also critical to gauge what's currently priced into the company's stock price, to assess the strength of this latest upside move.
The following critical insights are relevant:
- The market has priced a high required rate of return to buy NEO today, implying a substantial degree of risk at current values,
- The firm's economic characteristics aren't supportive of a buy in this current market,
- Technicals are supportive on a short-term horizon, but haven't shown the required bullish signals over the mid to long-term,
- Valuations don't corroborate an attractive entry point or mispricing in my opinion.
Net-net, I continue to rate NEO a hold based on the factors raised in this report.
Figure 1. NEO long-term price evolution, weekly bars. Recent bounce off yearly lows, trading above 50DMA in doing so.
Critical facts to reiterated hold thesis
1. Price implied expectations
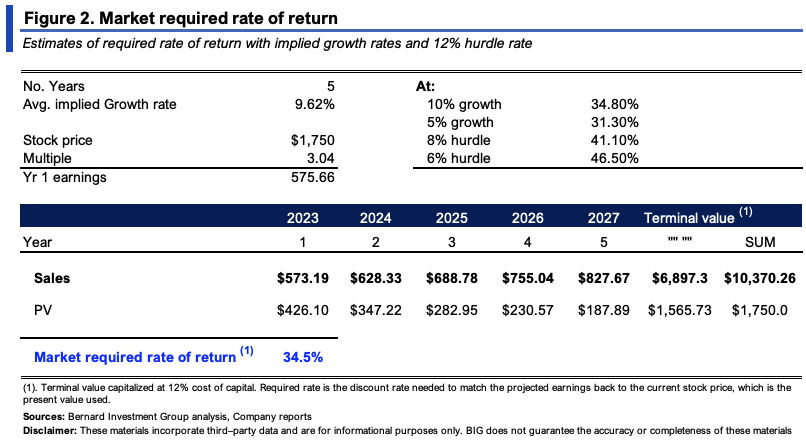
The company sells at 3.04x forward sales on a $1.75Bn market value, indicating the market expects $575mm in forward revenues (1,750/3.04 = 575). Consensus projects an average growth of 9.6% at the top line out to FY'25. I've extended this growth rate out to FY'25, as it appears a reasonable and sustainable estimate, especially given the company's growth rates from '22–date (Figure 2a).
Under these assumptions, the following estimates are noted:
(i). The market expects 12.8% YoY revenue growth this year,
(ii). Investors require a 34.5% rate of return if buying NEO today (the required rate of return is the discount rate needed to discount these estimates to the current market value of $1.75Bn at the time of writing).
(iii). This indicates a high degree of implied risk priced into NEO's current stock price. In a risk-on environment, this could be warranted. I'm not so sure in this current market.
To compensate for this risk is the 34.5% required rate of return, ranging from 31%—46.5% based on various stipulations (Figure 2).
Figure 2a.
Source: NEO Q2 Investor Presentation
2. Confirmation/deviation from market expectations
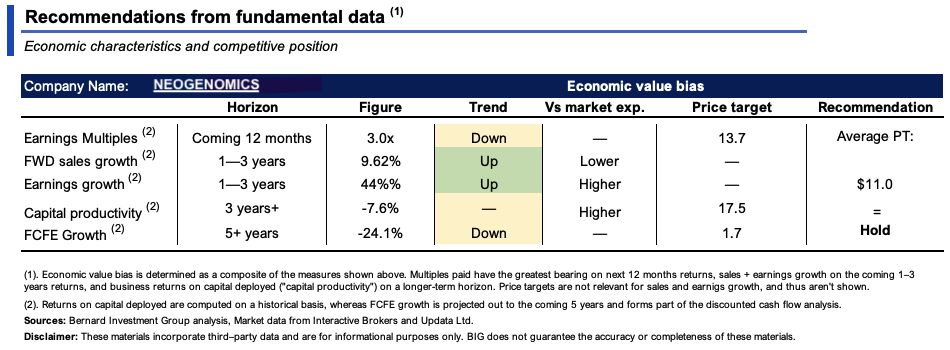
A composite view of NEO's economic characteristics and competitive position supports a neutral view in my opinion. Figure 3a depicts the recommendations across a number of horizons based on key fundamental inputs.
Figure 3a.
Several factors corroborate this viewpoint. In particular:
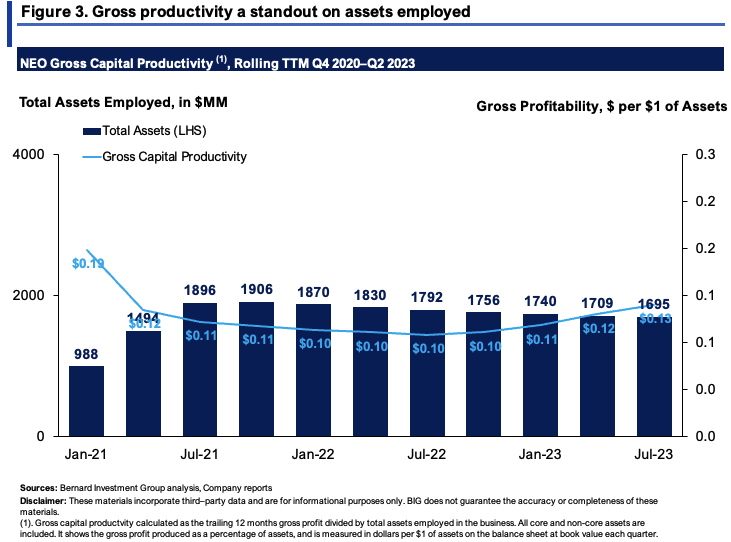
- NEO rotates just $0.13 in gross profit per $1 of assets employed on the balance sheet , as seen in Figure 3. All core and non-core assets are included to scale gross profit by gross asset value. This is below an attractive threshold of $0.3 per $1 of asset value.
- The company is hoarding cash, as it is unprofitable in both (i) operating income and (ii) operating cash flows. Over 24% of total assets are tied up in cash, with negative return on capital employed into the business. Critically, a low return on capital and high cash ratio business tell me a company is nervous to deploy capital. I.e., it is uncertain about the future, and/or has a lack of opportunities to grow. It has no FCF to fund growth internally and likely foresees future operating losses for a period to come.
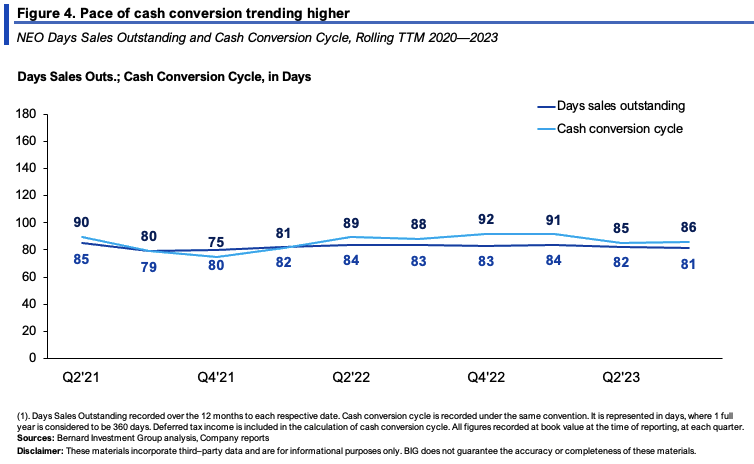
- In addition, NEO's cash conversion cycle isn't at a pace to offset this, recycling $1 invested to NWC back to cash in ~3 months (Figure 4). It can turn over its NWC ~4x each year at this pace, and its inventory turnover is 0.8x.
- Finally, NEO's growth these past 3 years has been capital-hungry, requiring $7.05 of investment for every $1 of new sales, M&A included. Without acquisitions, it was still $4.14 on the dollar. The bulk of this has been allocated to intangibles, NWC, and M&A, as mentioned. In that vein, NEO's required investment to grow the business has been 32x the sales growth produced from these investments. It cannot be said NEO has used capital efficiently in this regard, and we also see this in the fact its capital turnover has ranged from 0.3–0.35x over the last 3 years. So, each $1 of reinvestment brings in just $0.3–$0.35 in additional sales, and with $0.13 in gross profit produced on every $1 of assets, it is challenging to envision NEO creating value for shareholders any time soon.
3. Technical factors for consideration
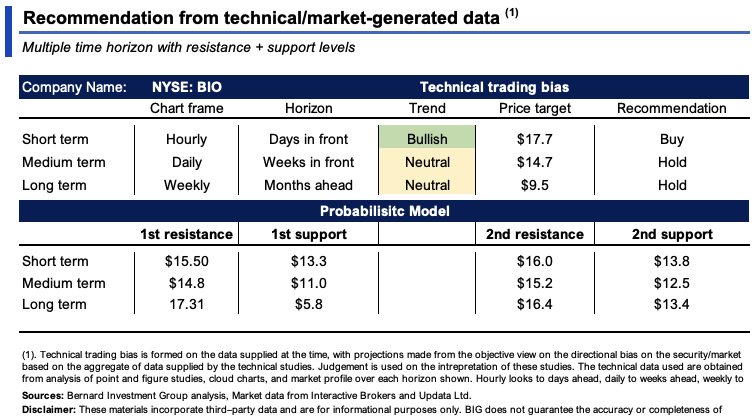
As with the economic value drivers, the market-generated data also supports NEO as a hold at this stage. Most critically, there is support for those investors with a short-term horizon, with scope for NEO to catch a short-term bid and rally to $17/share. This should be factored heavily heading into the company's earnings. You can see the recommendations and key levels across all time horizons in Figure 5.
Figure 5.
The divergence in short to long-term ranges is notable, but in my view, there is more evidence for NEO to remain rangebound and push further sideways. For instance:
(1). The profile of NEO's price distribution and time at price from Q1—Q3 indicates a pocket of low usage within the $12—$14 region, as seen in Figure 6.
(2). This is relevant as markets tend to move from areas of high usage to low usage to complete an entire distribution. On the profile charted in Figure 6 and 6a, it is clear the pocket of low usage lies within this range.
Figure 6.
Data: Updata
Figure 6a.
Data: Updata
(3). With the latest thrust off lows, we've got a price target of $14.70 activated on the medium-term horizon. This contrasts with the short-term targets that point to a potential move to $17. The short-term targets should be considered, but when looked at in conjunction with the firm's economic characteristics, may lack fundamental substance.
Figure 7.
Data: Updata
As a result of the recent price action, trend analysis shows a potential reversion to the mean:
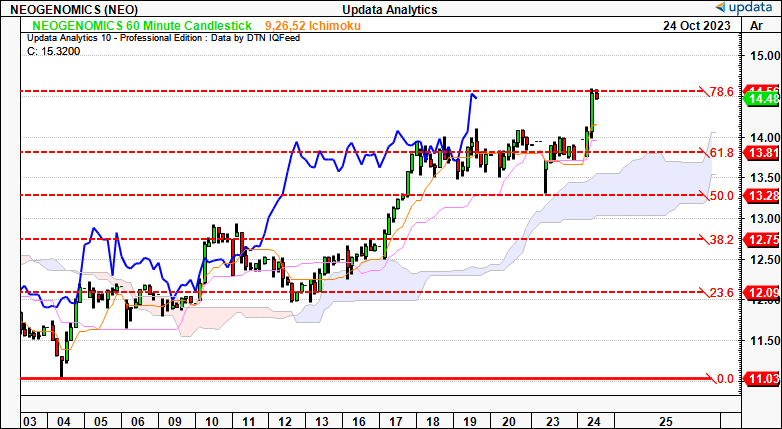
- Figure 8. 60-minute (short-term) cloud chart, looking to coming days:
- Break above cloud in mid-October, found support at cloud top before thrust off this level,
- Now testing top of fibs channel (78.6%) at current marks, with fibs traced down off September highs to October lows,
- Supports bullish view in the short term, i.e. coming days.
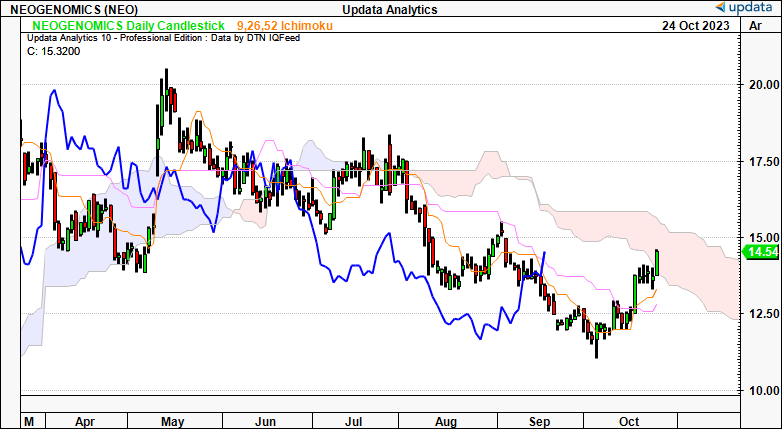
- Figure 9. Daily cloud chart, looking to the coming weeks:
- Price line nudged above cloud base, lagging line (in blue) yet to get there, but travelling to this mark,
- A break above $15 would be remarkable, and the lagging line would need to breach $15.80 to confirm the bullish signal on a medium-term horizon, i.e., coming weeks.
- Figure 10. Weekly cloud chart, looking to the coming months:
- Price line entering to narrowing cloud with and could break the cloud top, with lagging line currently trading within the cloud.
- This supports a neutral stance, but a break above $16 for the price line and $20 for the lagging line by December could be a bullish signal. Keep an eye out for these levels, especially after NEO's upcoming Q3 numbers. This may or may not be the catalyst for this change to happen.
Valuation and conclusion
The stock sells at ~3.05x forward sales as mentioned, which is actually a 10% discount to the sector. Does NEO qualify for this discount, is the sector overpriced, or is it warranted?
In my view, it is warranted at this stage. Even with the technicals outlined above, one cannot overlook the economic factors discussed so far. To view it differently, investors have priced the company at 1.22x EV/invested capital, showing the firm's investments are not economically valuable according to the market. And this makes sense, too, given:
- It returns <$0.15 in gross on the dollar for what assets are carried on the balance sheet,
- Lack of economic earnings, let alone operating profit and/or operating cash flow positive,
- The high amount of compensation investors demand in buying the stock today.
These, alongside the potential for a continued distribution of price around NEO's current market values. Collectively, it would appear there is a lack of support to advocate a buy at this stage. But I would be watching the short-term price action closely, as it could indicate a longer-term move.
In that vein, the company's upcoming numbers are absolutely critical for investors to digest where NEO should trade into FY'24. If it surprises estimates by a large magnitude, I'd be more constructive, but on the flip side, I'd still need more evidence from attractive long-term economics to corroborate a mispricing. To paraphrase Joel Greenblatt, rather than trying to uncover the next Picasso, it's better to find a Picasso painting on sale and buy it below value. Indicating it's wiser to buy quality companies at a fair price, rather than speculate on the next big thing. Our portfolios are far better positioned owning companies with exceptional long-term economics, sporting a strong competitive position, with durable, predictable cash flows—especially in the current market. In that vein, reiterate hold.
For further details see:
NeoGenomics: Short-Term Upsides Possible, Long-Term Not Supported By Economic Value