UL - Nestlé Vs. Unilever: Reassessing Ahead Of Full-Year Earnings
Summary
- In this article, I will give an overview of the portfolio of Unilever PLC and Nestlé S.A. and provide a discussion of their growth and profitability.
- I will also take a look at their balance sheets, as debt has only known one direction over the past decade - up and to the right.
- Moreover, I will discuss Unilever's and Nestlé's dividend track record, dividend safety, and growth prospects.
- Based on discounted cash flow and earnings-based valuations, I will show whether or at what prices I would buy Nestlé and Unilever stock.
- Finally, I will highlight what investors should look for when studying the upcoming earnings reports on February 9 and February 16, respectively.
Introduction
To gain exposure to emerging markets, one does not necessarily need to invest in globally diversified exchange-traded funds ((ETFs)) or outright emerging market ETFs. Just because a company is headquartered in the U.S., the U.K. or Switzerland doesn't mean it only generates revenue in that region. Quite the opposite - as global consumer goods companies Unilever PLC ( UL , UNLYF ) and Nestlé S.A. ( NSRGY , NSRGF ) demonstrate.
Emerging markets will play an increasingly important role in the future, in part due to the growth of the middle class there and the increasingly weak demographics in developed economies (see my related article ). As disposable income grows, the emerging middle class wants to spend it on the highest quality brands, many of which are owned by companies domiciled in the West. Unsurprisingly, Unilever and Nestlé are making major efforts to market their brands in emerging markets, as are, for example, The Coca-Cola Company ( KO ), Estée Lauder ( EL ), and Starbucks ( SBUX ).
Personally, I am very wary of investing in companies based on the other side of the world for a number of reasons. In China, for example, foreign investors are not allowed to own shares in companies like Alibaba ( BABA ), JD.com ( JD ), Tencent ( TCEHY , TCTZF ), or Baidu ( BIDU ). These companies benefit from foreign capital investment by using a variable interest entity ((VIE)) structure. Foreign investors own shares (or American depositary receipts, ADRs) in shell companies (usually based in the Cayman Islands) with only a claim on the Chinese company's profits and an indication of an element of control.
Admittedly, I own some ETFs to gain exposure to companies based in emerging markets, but that is a very small percentage of my portfolio. I am very confident that I can maintain exposure to emerging markets through global companies. Domiciled in the U.S. or in Europe, they offer better investor protection and an actual residual claim on the company's assets.
In this article, I will take a close look at Unilever and Nestlé, and elaborate which of the two I believe is the better company in terms of portfolio diversification, profitability, balance sheet optionality, growth, and, of course, dividend safety. I will close out with discounted cash flow and earnings-based valuations, and point out what I will be looking for in the upcoming full-year earnings reports.
Brief Overview Of Unilever And Nestlé
Unilever and Nestlé do not need much introduction, as their products are part of our daily lives. Unilever owns a wide range of food and refreshment (about 40% of revenue) and a number of household, personal care, and hygiene brands (about 60% of revenue). Examples include Ben & Jerry's, Domestos, Hellmann's, Dove, Knorr, Omo, Rexona, Lifebuoy and Magnum.
With a current market capitalization of around EUR 120 billion (about $133 billion), it is only 40% the size of Swiss-domiciled Nestlé, with a market capitalization of CHF 313 billion (about $340 billion). Unsurprisingly, Nestlé's portfolio is even larger and more diversified. It is the largest food company in the world and owns brands such as Gerber, NAN, S. Pellegrino, Acqua Panna, Maggi, Thomy, DiGiorno, Garden Gourment, Nescafe, Nespresso, Starbucks Coffee at Home, KitKat, Smarties, Carnation, Nesquik, Nestea, Mövenpick, Häagen-Dazs and Dreyer's. Notably, Nestlé also owns Purina , the leading pet care brand after Mars Petcare.
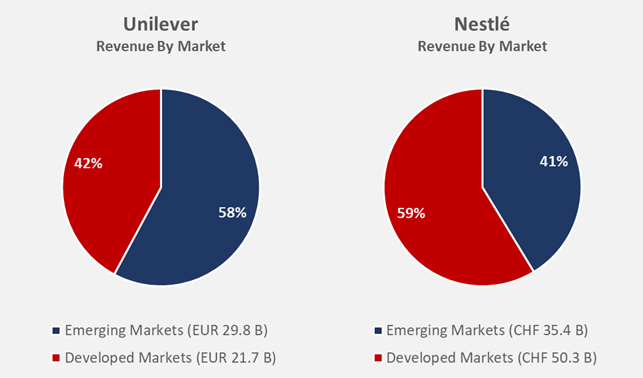
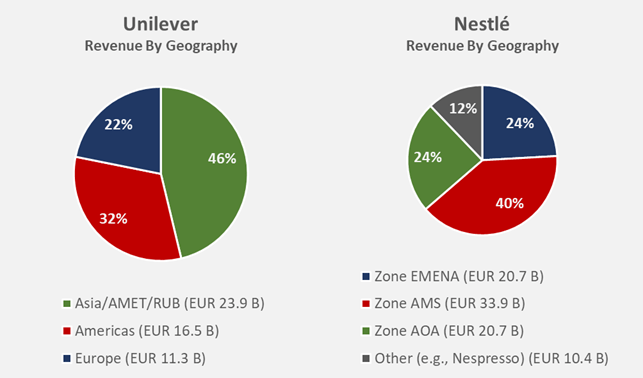
Both companies generate more or less half of their revenues in emerging markets, as shown in Figure 1, which is based on 2020-2021 average revenues. A closer look shows that Unilever is heavily involved in Asia, the Middle East, Turkey and Eastern Europe (46% of total revenue, Figure 2). Nestlé appears to have a stronger commitment to the Americas, but it should be remembered that its "Zone AMS" segment covers the U.S., Canada and Latin America. The U.S. account for about two-thirds of the sales of the "Zone AMS" segment. Russia represents approximately 1% and 2% of Unilever's and Nestlé's full-year revenue, respectively. Unilever announced that it will no longer invest in Russia, but will continue to provide basic products. Similarly, Nestlé announced a drastic reduction of its portfolio in Russia, but will also continue to supply basic products.
Figure 1: Unilever’s [UL, UNLYF] and Nestlé's [NSRGY, NSRGF] revenue by market (own work, based on the companies’ 2021 annual reports) Figure 2: Unilever’s [UL, UNLYF] and Nestlé’s [NSRGY, NSRGF] revenue by geography; Asia/AMET/RUB refers to Africa, Middle East, Turkey; Russia, Ukraine and Belarus; Zone EMENA refers to Europe, Middle East and North Africa; Zone AMS refers to Americas; Zone AOA refers to Asia, Oceania and Sub-Saharan Africa (own work, based on the companies’ 2021 annual reports)
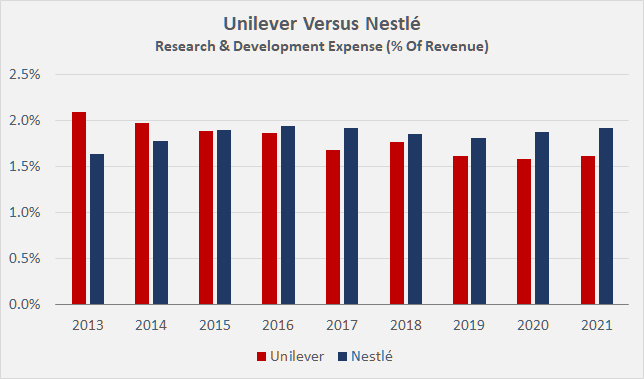
Both are truly global staple companies and will therefore continue to benefit from secular growth drivers in emerging markets, but of course the risks associated with significant exposure to these markets should also be considered (e.g., exchange rate fluctuations, local recessions, political tensions). As large companies, Nestlé and Unilever are firmly entrenched with retailers and are therefore in a better position to negotiate for shelf space, as compared to smaller and niche players. Supply chain disruptions have impacted most if not all retailers, so it seems only logical that large companies like Nestlé and Unilever are held in very high regard due to their sophisticated supply chains and typically much better reliability compared to smaller companies with less developed logistics networks. With only the most popular products and the latest trends occupying the top spots on retailers' shelves, staple companies must constantly invest in marketing and R&D. Relative R&D spending (Figure 3) is very stable at Nestlé, while it continues to decline at Unilever. This is a trend that should be closely monitored, especially in view of the recent decline in sales volumes, which, however, is mainly due to inflationary pressures and consumers switching to discount products. Marketing and advertising-related expenses also continue to decline at Unilever, from around 15% in 2013 to 13% in 2021. Nestlé does not break down marketing and administrative expenses (20% of sales in 2021).
Figure 3: Research & development expense of Unilever [UL, UNLYF] and Nestlé [NSRGY, NSRGF] since 2013, in percent of revenue (own work, based on the companies’ 2013 to 2021 annual reports)
Unilever is currently facing some uncertainties regarding its leadership. Alan Jope, Unilever's soon-to-depart CEO, placed great emphasis on ESG and political issues (e.g. Ben & Jerry's ), and he was also criticized for his intention to acquire GSK's consumer health business (Haleon, HLN ) for a whopping $68 billion. That idea was later abandoned , and it seems worth noting that Haleon's market cap currently stands at only $37 billion. From this perspective alone, and due to improvable operating profitability, it is understandable why activist investor Nelson Peltz (Trian) stepped in - he was appointed a non-executive director in May 2022. Unilever's current management is also under fire from Terry Smith (Fundsmith), who has criticized Unilever for its corporate strategy of seeking to ensure its brands convey broad benefits to society (e.g., Hellmann’s mayonnaise "purpose"). Just last week, Hein Schumacher was announced as Jope's successor, the former CEO of Royal FrieslandCampina and before that served at H.J. Heinz as chief strategy officer and later as president and CEO of the China division (2011) and executive vice president of Kraft Heinz's ( KHC ) Asia Pacific Zone (2013).
Growth And Profitability Of Unilever and Nestlé
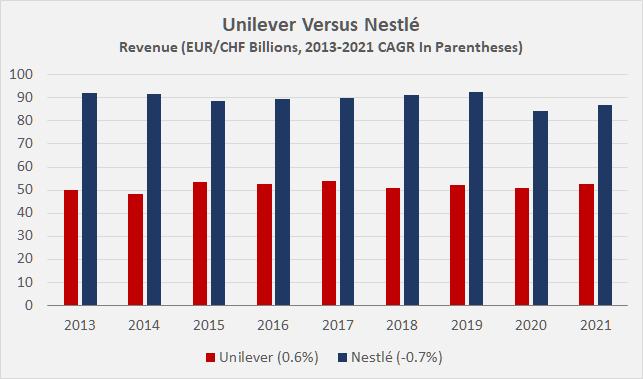
Long-term sales growth is de facto non-existent at both companies, as Figure 4 shows. However, it is important to understand that both are constantly reshaping their portfolios by divesting underperforming businesses and acquiring more promising assets. In turn, profit margins should improve, ultimately leading to bottom line and cash flow growth. However, with both companies largely remaining in their business segments - food, beverage, household, and personal hygiene - it is understandable that gross margins have not increased over the period under review. Expansion into higher margin business areas is extremely difficult. In a direct comparison, and this is easy to understand when looking at the brand portfolios, Nestlé focuses on more premium brands, which is reflected in a gross margin of around 50% (43% for Unilever).
Figure 4: Revenue of Unilever [UL, UNLYF] and Nestlé [NSRGY, NSRGF] since 2013 (own work, based on the companies’ 2013 to 2021 annual reports)
On an earnings per share basis, both are also "growing" through share buybacks. Net of shares issued as a result of stock-based compensation, Unilever and Nestlé have repurchased 11% and 13%, respectively, of the weighted average diluted shares outstanding in 2013 over the past nine years, resulting in earnings per share growth of 12% and 15%, respectively, over the same period.
Both companies are doing a good job of converting their revenues into cash earnings, as evidenced by their free cash flow ((FCF)) margins. As always, I have normalized FCF with respect to working capital movements and adjusted for stock-based compensation expense (normalized free cash flow, nFCF). Unilever has seen its nFCF margin widen by 400 basis points since 2013 to 11.4% (three-year average), leading to nFCF growth over the years against the backdrop of a flat top-line. In contrast, Nestlé's free cash flow margin has barely changed over the years (11.2% long-term average), so nFCF has not increased. While U.S.-based staples giant Procter & Gamble ( PG ) cannot be directly compared due to its focus on personal hygiene and home care, its nFCF margin of around 20% is nevertheless nothing short of spectacular.
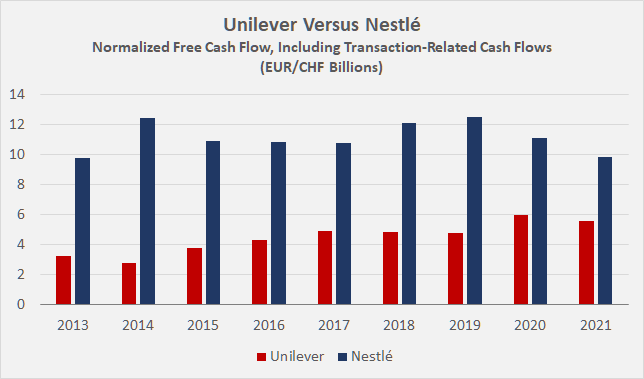
Nestlé obviously has highly cash-generative businesses, highlighted by its stable margins and a de facto zero percent and largely flat excess cash margin ( see here for an explanation and a discussion of Unilever's excess cash margin). In addition to free cash flow, Nestlé also generates cash through profitable divestments. When portfolio transactions are taken into account, the picture does not change qualitatively, as Nestlé's cash flow still does not show a growth trend over the last nine years (Figure 5). However, quantitatively, Nestlé generated 11% more free cash flow than conventionally calculated - i.e., CHF 100.2 billion versus CHF 90.2 billion since 2013 and through 2021. In stark contrast, Unilever generated 9% less free cash flow when transactions are also taken into account (EUR 40.2 billion versus EUR 44.3 billion). While it can be argued that a nine-year period is too short to draw a valid conclusion, I believe it still serves as a good indicator of the performance of the two companies.
Figure 5: Normalized free cash flow of Unilever [UL, UNLYF] and Nestlé [NSRGY, NSRGF] since 2013, including transaction-related cash flows, accounted for in an averaged manner (own work, based on the companies’ 2013 to 2021 annual reports)
While I concede that it becomes more difficult to run a business profitably as it gets larger, Nestlé's growing cash conversion cycle ((CCC)) is nevertheless a small fly in the ointment besides flat nFCF. It would be understandable if the company were increasingly focused on more complex offerings, but that is not evident from the margin profile. Nestlé's CCC has increased from -11 days in 2013 to 5 days in 2021, which of course is far from a critical development but should be monitored. Unilever's CCC is already very low at -25 days (2021) and even shows a slightly negative trend (-15 days in 2013). A closer look at Nestlé's working capital reveals that inventory management is lagging somewhat, but as mentioned earlier, such effects are understandable given the size of the company.
From a cash return on invested capital ((CROIC)) perspective, both companies are solid performers. Unlike return on invested capital ((ROIC)), CROIC is based on normalized free cash flow and is therefore much more difficult to manage. Excluding portfolio transactions, Nestlé's average CROIC is 9.0%, slightly lower than Unilever's (10.1%). If cash flows related to portfolio transactions are included, the result understandably improves in favor of Nestlé (10% versus 9.1% for Unilever). All in all, these are solid results for staples companies, especially in light of the fact that acquisitions in the consumer staples sector are usually quite expensive and consequently come with significant goodwill, which has of course been included in the calculations of invested capital. Excessively expensive transactions therefore represent a key risk, as the probability of impairment charges is quite high if the expected growth and profitability do not materialize. Impairment charges on goodwill and other intangible assets (e.g., relating to brands) are regularly recognized at both companies, suggesting that overpayments are the rule rather than the exception.
Balance Sheet Quality, Dividend History, And Dividend Safety
Since 2013, net debt at Unilever and Nestlé has tripled and increased six-fold, respectively. Admittedly, these are unpleasant developments at first glance, and they "nicely" demonstrate the impact of the low interest rate environment. However, I concede that analyzing the development of net debt on an absolute basis is rather sensational and not necessarily meaningful. After all, Nestlé's net debt in 2013 was CHF 5.4 billion, which is hardly meaningful for a company with annual sales of over CHF 90 billion.
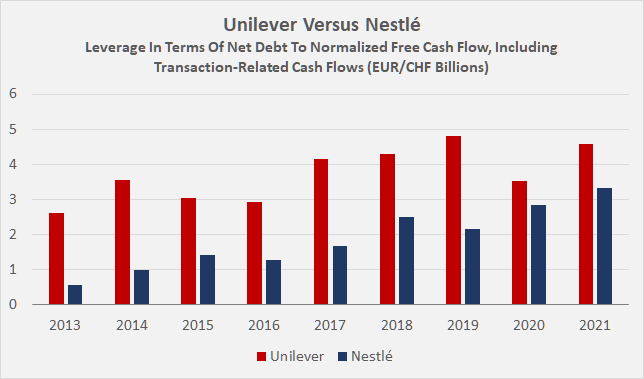
Putting net debt in relation to normalized free cash flow and taking transaction-related cash flows into account in an averaged way, Unilever's leverage is definitely more pronounced, but far from unmanageable (Figure 6). Interest coverage ratios are very reasonable for both companies, and are currently 17 and 12 times nFCF before interest for Unilever and Nestlé, respectively. While leverage at both companies will continue to increase in 2022 due to the increases in working capital, inflationary pressures and the (temporary) decline in volumes (Unilever), the situation should normalize at least somewhat in 2023. For Nestlé and Unilever, analysts expect a decline of free cash flow of 5% and 20%, respectively, in 2022 and a rebound of 23% and 12%, respectively, in 2023, according to FAST Graphs.
Figure 6: Leverage of Unilever [UL, UNLYF] and Nestlé [NSRGY, NSRGF] since 2013, in terms of normalized free cash flow, including transaction-related cash flows, accounted for in an averaged manner (own work, based on the companies’ 2013 to 2021 annual reports)
Overall, I consider both balance sheets to be of good quality, but Nestlé is still in better shape than Unilever. Pension obligations are hardly worth mentioning, as they account for only about 2.8% and 2.7% of total assets of Unilever and Nestlé, respectively. Goodwill and other intangible assets account for more than 50% of total assets at Unilever, but only about 38% at Nestlé, suggesting that the latter company is a less aggressive acquirer and/or has a better knack for acquisitions.
Of course, the different balance sheet qualities are also reflected in the debt ratings. While Unilever currently has a long-term issuer rating of A1 (A+ S&P equivalent), last affirmed in October 2020 with a stable outlook, Nestlé enjoys a somewhat higher standing, as evidenced by its Aa3 rating (AA- S&P equivalent), last affirmed by Moody's in October 2022.
Given their solid balance sheets, reliable cash flows and only subordinate sensitivity to economic cycles, both Nestlé and Unilever theoretically qualify as solid long-term dividend stocks.
According to the company’s website, Nestlé paid its first dividend in 1959 and has not missed a year since. Nestlé has increased its dividend for 26 consecutive years (since 1996) at a compound annual growth rate ((CAGR)) of 9.5%. Recently, however, dividend growth has slowed to a ten-year CAGR of 4.0% and a five-year CAGR of 3.7%. Increases in 2020 and 2021 were somewhat paltry at less than 2%, but in 2019, Nestlé increased its payout to shareholders by a solid 10%. With a current payout ratio of around 80% of normalized free cash flow (including averaged transaction-related cash flows), and given the declining nFCF in 2020 and 2021, it seems understandable that dividend growth has slowed significantly. With free cash flow expected to recover in 2023, Nestlé's dividend payout ratio will decline significantly, increasing the likelihood of more meaningful dividend increases. The current dividend of CHF 2.8 represents a dividend yield of currently 2.5%. U.S. investors should note the ADR fees and the 35% Swiss withholding tax on dividends, but as noted in the comment section in another article of mine, Vanguard, for example, automatically makes the necessary filings to reduce foreign tax withholding.
According to Unilever's website , the company has paid a dividend since at least 1999, but it has been frozen since 2020. Investors currently receive EUR 0.4268 per quarter (Unilever declares its dividend in EUR), which translates to a current dividend yield of 3.7%. That's definitely in the upper range for a consumer staples company. Unilever's payout ratio is also currently around 80% of nFCF, including transaction-related cash flows. While the payout ratio is expected to be higher in 2022 based on free cash flow, the situation should normalize from 2023 onwards. Given the commitment of activist Nelson Peltz, I think a return to dividend growth is likely. Being a U.K.-based company, there is no withholding tax on the dividend, but of course ADR fees need to be taken into account. As in the case of Nestlé, U.S. investors receive dividend payments in a foreign currency, so the yield on cost increases or declines depending on exchange rate movements.
Risks
Uncertainties associated with the change of leadership at Unilever, execution risks, and exchange rate risks from the perspective of U.S. investors have already been mentioned. Since more or less 50% of sales are generated in emerging markets, both companies naturally face significant exchange rate risks internally. I consider this risk to be particularly important for Nestlé, which reports in Swiss francs (Unilever reports in euros). As the recent past has shown once again, the currency continues to benefit from its safe haven status in times of geopolitical uncertainty. As a result of the appreciation of the Swiss franc, Nestlé's revenues and earnings come under pressure.
The risk of a global economic downturn or local recessions should also be considered, but I would not overstate it given Unilever's and Nestlé's diversified portfolios and focus on everyday products.
Other risks include litigation and balance sheet risks, but I do not consider these to be particularly material for either company. Finally, reputational risks should also be considered, as most of the pricing power comes from intangible brand assets. If a brand loses its appeal, this is likely to lead not only to sales and earnings problems, but also to impairment charges which could put further pressure on the stock price.
Valuation
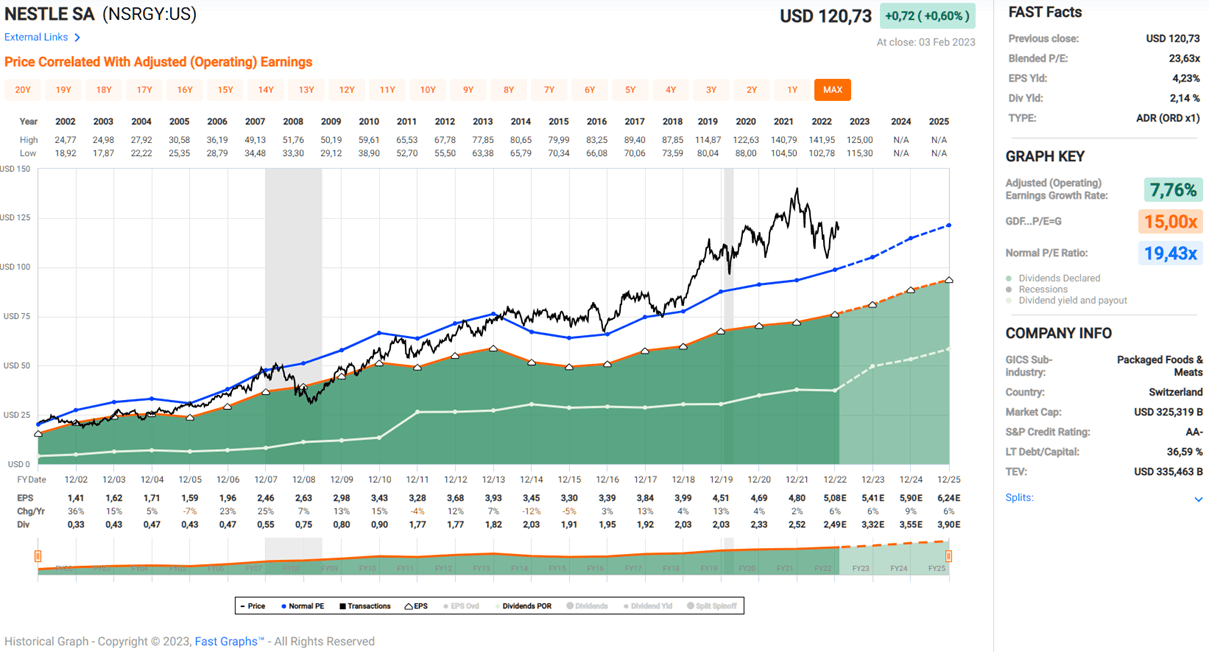
I believe that the consumer staples sector in general deserves a valuation premium due to its very low sensitivity to economic cycles. Nevertheless, Nestlé seems to be somewhat overvalued with a current price-to-earnings ((P/E)) ratio of 24. Nestlé's normal P/E ratio has increased significantly over the years, which is not entirely justified in my opinion (Figure 7). Other staples giants like PepsiCo ( PEP ) or Procter & Gamble ( PG ) are similarly expensive with P/E ratios of currently around 25. The current normalized free cash flow yield of 3.1% is quite low from a historical perspective, but in line with other large companies, such as PepsiCo. Morningstar rates Nestlé with two stars and a fair value estimate ((FVE)) of $113 for the ADR, which represents a 7% premium at the time of writing. Taking Nestlé's three-year average nFCF (including transaction-related cash flows) and performing a discounted cash flow ((DCF)) sensitivity analysis, the company would have to grow 3.5% each year in perpetuity for the shares to represent fair value at a 7% cost of equity - hardly a bargain (Figure 9, right panel).
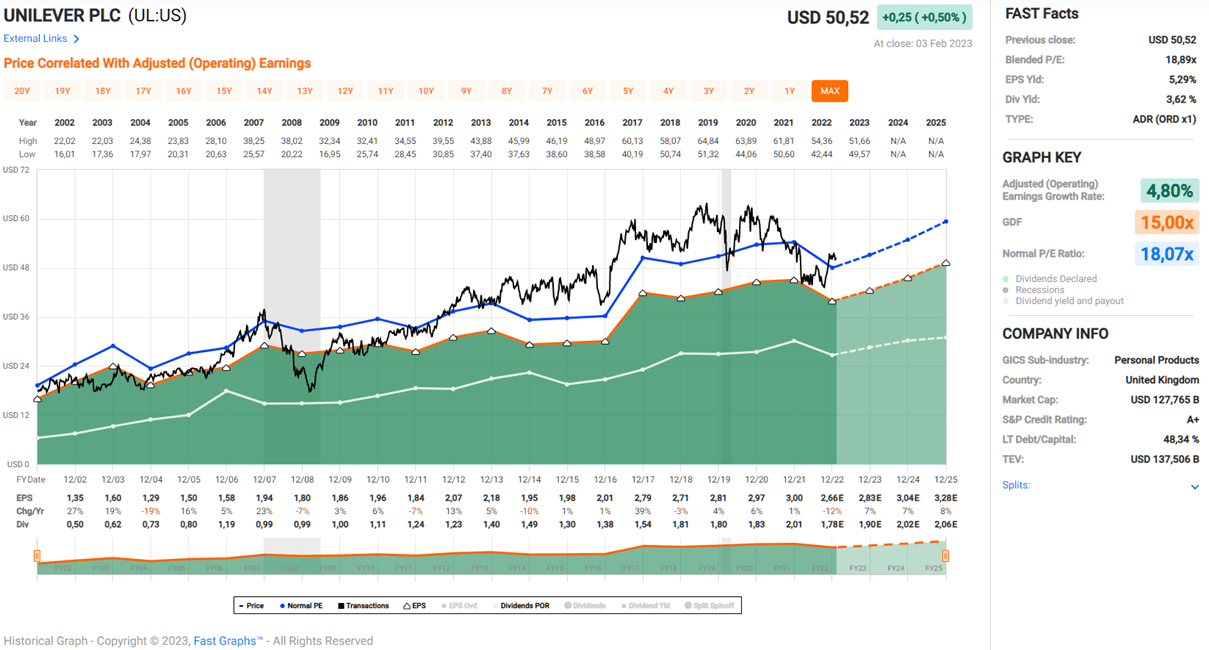
Unilever is significantly cheaper compared to competitors such as Nestlé or Procter & Gamble (see my comparative analysis ), mainly because of uncertainties related to management, the stagnant dividend, and inferior brand portfolio. A P/E ratio of 19 seems reasonable (Figure 8), and a free cash flow yield of 4.6% is not bad either. Morningstar rates Unilever at three stars, with an FVE of $51 for the ADR, currently representing a 1% discount. According to the DCF sensitivity analysis in Figure 9 (left panel), Unilever is slightly cheaper than Nestlé. At a 7% cost of equity, the company would need to grow its nFCF by 2% to 3% in perpetuity for the shares to currently represent fair value.
Figure 7: FAST Graphs chart for Nestlé ADRs [NSRGY] (obtained with permission from www.fastgraphs.com) Figure 8: FAST Graphs chart for Unilever ADRs [UL] (obtained with permission from www.fastgraphs.com) Figure 9: Discounted cash flow sensitivity analyses for Unilever [UL, UNLYF] and Nestlé [NSRGY, NSRGF]; note that the numbers are in Euros and Swiss francs, respectively (own work, based on the companies' 2019 to 2021 annual reports)
Summary And Conclusion – And What To Look For In The Upcoming Earnings Reports
Nestlé and Unilever are undoubtedly solid companies in the consumer staples sector. However, neither is without problems. Unilever faces uncertainties related to its top management, and while free cash flow is growing at a healthy rate (nine-year CAGR of 6%), debt is rising even faster. Nestlé, like Unilever, is doing a good job of divesting underperforming assets and acquiring promising businesses, but the Swiss company has also significantly increased its leverage without any tangible impact on cash flow growth for the time being. Compared to U.S.-based Procter & Gamble, both Unilever and Nestlé appear relatively weak in terms of profitability, although I acknowledge that the comparison is not ideal. There is definitely room for improvement.
In terms of portfolio, I think Nestlé is better positioned, even though it is much larger and thus less agile than Unilever. Nestlé's portfolio strikes me as more rounded and better focused, leading to stronger synergies and better cross-selling and advertisement opportunities. Unilever's combination of food, hygiene and home care products is slightly less attractive from this perspective. I also really like Nestlé's Purina pet care franchise, from which the company has benefited in particular since 2020 due to increasing adoption of pets.
Growth through acquisitions in the consumer staples sector is extremely difficult, as can be seen by the high valuation of the sector in general and the individual - also smaller - companies in particular. Church & Dwight ( CHD , $20 billion market cap), for example, trades at a P/E of about 28; Hormel Foods ( HRL , $25 billion market cap) trades at 25 times earnings; and McCormick ( MKC , $20 billion market cap) trades at a P/E of 29. Failed acquisitions are having an impact on both companies (goodwill and other intangible asset impairments), but I concede that at least to some degree, this should be considered a cost of doing business. The sector is not only very expensive, but also very competitive from a M&A perspective.
Both companies should benefit strongly from the growing middle class in emerging markets, so it does not seem unreasonable to expect that also Nestlé can return to free cash flow growth. Given their solid brand portfolios, both companies have strong pricing power, which helps them weather difficult environments like the current one. For example, Unilever reported sales growth of 8% for the first half of 2022, as did Nestlé . Both companies grew on rising prices, and while Nestlé's volume was largely stable, Unilever reported a 1.6% volume decline. The 180 basis point decline in operating margin is another sign of significant input cost inflation that is slow to be absorbed and passed on to consumers.
While Unilever will announce its 2022 results on Thursday, Feb. 9, Nestlé investors will have to wait until Feb. 16 , when its full-year results will be presented. In closing, I'd like to summarize a few considerations that are worth keeping in mind when evaluating the earnings presentations.
- Full-year sales growth is expected to be above 7% for both companies. How have volumes evolved - is there a discernible shift to discount brands (i.e., declining volumes)?
- A direct comparison of the two companies should allow conclusions to be drawn about further pricing actions in 2023. While Unilever has to be very cautious due to already weakening volumes (e.g., Home Care segment -3.4% in H1 2022), Nestlé seems to have taken a more conservative course ("price increases in a responsible manner") according to CEO Schneider's remarks.
- As for Nestlé, I would keep a close eye on Purina, as it is currently the largest contributor to organic growth. I believe that the trend of pet adoption will slow down sooner or later.
- The development of sales of confectionery and water can be seen as an indicator of recession and a continued deterioration of consumer confidence, as these are the most cyclical segments in Nestlé's portfolio.
- To what extent have share buybacks increased earnings per share? Unilever currently has a EUR 3 billion buyback program in place ( announced Feb. 10, 2022), and I expect the company to have repurchased 30 to 32 million shares during the year, representing 1.2% of shares outstanding.
- How pronounced is the margin compression, especially in terms of free cash flow? It is helpful to normalize working capital to better assess underlying profitability.
- How much was the actual decline in free cash flow? A 20% and 5% decline year-over-year should be expected on a non-normalized basis for Unilever and Nestlé, respectively. Are there tangible signs of a rebound in 2023, as currently expected by analysts?
- I would be very positive about a dividend increase in the case of Unilever, as it would confirm a return to a more shareholder-friendly stance, but I would not bet on it. The share buybacks are already a step in the right direction, and at least the first tranche, commenced in late March 2022, struck me as opportunistic.
- For Nestlé, I expect a continuation of the rather conservative dividend growth path and rate anything above 3% positively. A hike to round CHF 3.0 would take the payout ratio to 85% and represent a 7% increase - although this is probably wishful thinking, such an increase hardly seems unsustainable given that Nestlé's free cash flow is expected to pick up significantly in 2023.
- While I don't think Hein Schumacher will appear on Unilever's earnings call, I would still watch for tangible signs related to a change in the company's strategy. It will be very interesting to see if Peltz's involvement stands out when comparing the 2021 and 2022 earnings call transcripts.
While I recognize that Nestlé is the most important and best positioned food company in emerging markets, I don't think the stock is a good investment at this price. A P/E ratio of 24 seems largely undeserved, and a free cash flow yield of 3% with no real growth is also quite expensive. At CHF 100 ($108 per ADR, 2.8% yield) or less, I would re-evaluate the stock, but I would not be a confident buyer until the stock reaches CHF 90 ($97 per ADR, 3.1% yield). A starting yield of less than 3% seems unattractive against the backdrop of current long-term treasury yields, and I would also take into account the fairly strong Swiss franc and slow dividend growth.
I hold a modest position in Unilever and will continue to add to it during periods of weakness (such as March 2022). A dividend yield of around 4% seems quite reasonable to me, and I can look beyond the current stagnant dividend now that activist investor Nelson Peltz, who significantly improved the situation at Procter & Gamble a few years ago, has stepped in.
Thank you very much for taking the time to read my article. How did you like it, my style of presentation, the level of detail? If there is anything you'd like me to improve or expand upon in future articles, do let me know in the comments section below.
For further details see:
Nestlé Vs. Unilever: Reassessing Ahead Of Full-Year Earnings