NFLX - Netflix: Priced For Perfection
2024-01-08 01:41:09 ET
Summary
- Netflix is trading at a high current and forward P/E ratio, indicating the need for strong revenue and earnings growth to justify its market cap.
- Current market size is big, but market share has likely peaked in USCAN and other regions will be more difficult to penetrate in the same scale.
- ARPU has also probably peaked in USCAN and will be significantly lower in other regions. Total expected Revenue and Net Income are unable to support a $200 billion market cap.
- I consider Netflix currently priced for perfection and thus recommend investors to take profits.
Netflix ( NFLX ), the uncontestable streaming leader, is trading at almost 40x Price to Earnings (P/E) FY'23 and, if analysts are correct about EPS of ~$15 in FY'24, could be trading at ~32x forward P/E. A company that is valued at this kind of P/E isn't necessarily expensive, but it means investors need to be very thorough when analyzing the potential for revenue and earnings growth. Especially because, for those who have read Christopher Mayer's 100 Baggers , Netflix is now flying without an engine. I explain myself: Mayer's argument to find 100 Baggers in the stock market is that investors need to search for companies that can increase their earnings and expand their multiples (namely P/E). Since Netflix is trading at 40x P/E, it means that its multiple is now a headwind (as it is much more likely to come down than up) and its only engine to support current valuation is earnings growth.
This is the hypothesis I'll test in this article: Is there a significant earnings growth in the horizon to justify Netflix's $200 billion market cap? When growth stalls and the company starts to trade at 20x or 25x, will it be above, at or below $200 billion? The main reason to test this hypothesis is that the last time Netflix showed a small crack (e.g. when it lost subscribers during 1H'22) it lost more than 70% of its market value from peak to trough. Sure, some of it is correlated to the Nasdaq bubble burst in late 2021, but it's still significant. A 70% drawdown could be around the corner if Netflix's pillars for growth aren't firm enough.
First, we'll review the Content Assets and how much Netflix could expect to spend in the near future. Also, I'll make the argument that this year's record Cash Flow might not be realistic and that EPS of $15 for FY'24 doesn't necessarily translate to the same amount in FY'25. After this detour, I'll focus in the most important topic: what's Netflix addressable market? Can we extrapolate its potential market share? Is ARPU going up driven by ads or this new era of bundling and high competition will stop ARPU growth? In the end, my case is that Netflix is overvalued given its market cap of $200 billion. Market beating returns are unlikely to be achieved holding Netflix in the long-term - although in the short-term, everything is possible.
Content Assets Will Continue To Grow, Consuming Cash Flow And Making It Less Profitable
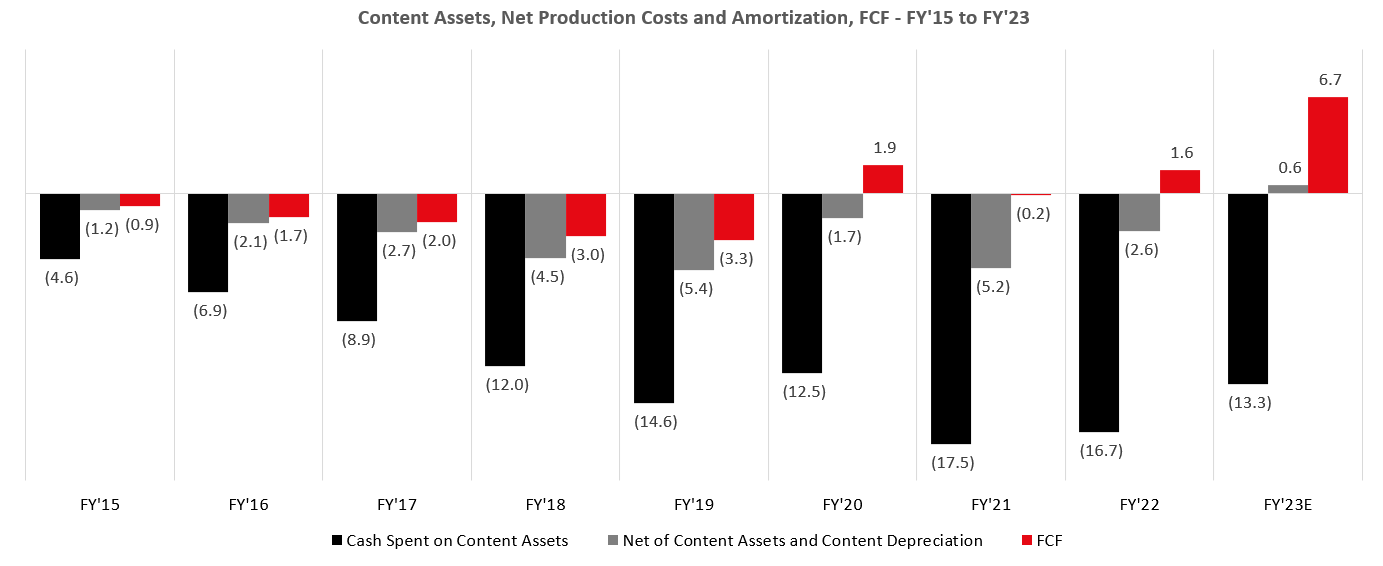
A few years back there was a short report on Netflix that claimed the company was too aggressive on how it depreciated its content assets, likely being too slow to amortize them and thus appearing to be more profitable than it was. Although I don't agree that this in itself is reason to short Netflix, it does have some truth to it. I analyzed data since FY'15 and in basically all those years Netflix spent more in content than it amortized, thus generating higher Net Income and lower Cash Flow.
Content Assets, Net Production Costs and Amortization, FCF - FY'25 to FY'23 (Netflix IR, Author)
What can be observed in the graph above is that Cash Spent on Content Assets (black bar) has been growing steadily since FY'15, with some recent interruptions to this growth in FY'20, FY'22 and FY'23. The important thing to note here is that Cash Flow (red bar) jumps whenever Cash Spent on Content Assets decreases. In FY'20 all productions came to a halt with COVID-19 and FCF was positive for the first time. When productions came back at full speed in FY'21, FCF disappeared. In FY'22 Netflix had to rein in on content spending because subscribers were slowing down and they tried to preserve its margins. My interpretation from FY'22 comes from Netflix Investor Relations website:
Finally, FY'23 arrives and we have a writers and an actors strike. This will also considerably drive down content spend and push FCF higher. Here is where I believe the origin of the $15 EPS estimate for FY'24 comes from. If Cash Spend on Content Assets goes down, the amortization of next year will also go down (or at least stabilize). Thus, with some Revenue growth and a lower content amortization, earnings will definitely go up. The devil lies in what comes after FY'24. I see no reason why Netflix will structurally slow down its content spend. In fact, management has already confirmed its expectation of spending $17 billion in Content Assets for FY'25, which is 20% above FY'23 and in line with FY'21. I expect it to continue to grow, representing a more stable percentage of the total revenue. Growth in content assets means that the capitalized portion will be higher than the amortization, which will drive FCF down or at least hold it back.
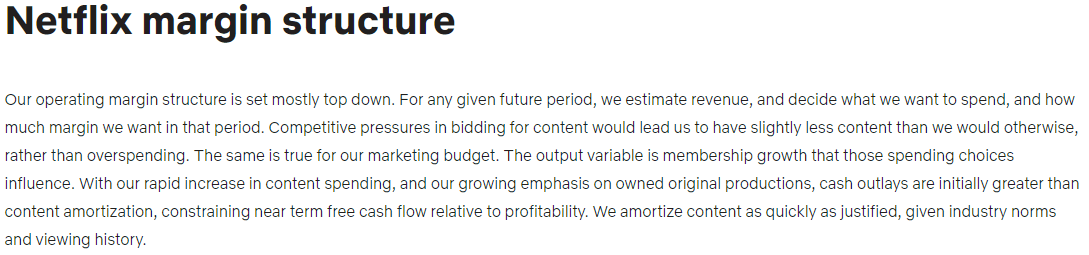
What confirms my understanding that content spend will continue to grow is that it did for Disney ( DIS ) and Paramount ( PARA ), as can be seen in the graph below. Also, the environment has become more competitive and one of Netflix's main competitive advantage is that it has something new every time you open the app. I'd expect Netflix to continue to increase its investment in content, not hold it back. It's important to also remember that Netflix currently doesn't have any sports rights, which are very expensive but a big competitive advantage. It is now dipping its toe in the water of sports rights and if they decide to go after this segment, it will definitely cost a lot.
Content Asset Spent and as % of Revenue, NFLX, DIS, PARA (Netflix IR, Disney IR, Paramount IR, Author)
The conclusion we arrive at by looking at this graph is that even established companies grow their content asset spend, before or after the streaming era. Even more, it's possible to see that Disney had a similar drop in Cash Spent on Content Asset as Netflix in FY'23 due to the strikes. Netflix is now at 40% of Content Asset spend as percentage of Revenue, not only lower than its own historical (which is somewhat biased due to lower revenue in the early years), but also against peers. I'd expect content asset to resume growth in FY'24 and onwards, to eat on FCF in the short-term and make it less profitable by resuming depreciation growth in FY'25.
The Growth Opportunity
Now that we have established that Netflix will continue to grow to justify its high PE, that Content Spend will also continue to grow and eat part of FCF and Earnings, it's time to understand if Netflix avenue for growth is big enough to justify its current valuation and expected FCF and earnings. First, we'll calculate how many subscribers Netflix could have. Second, a sensibility analysis will be run using the subscribers number and possible scenarios of ARPU. This will give us an expected growth in earnings and from it we'll be able to derive future Net Income.
Netflix Addressable Market
The great question here is: If Netflix has almost 250 million subscribers, how many more can they enroll? In an initial assessment, if we assume that each subscriber is actually a household with three people, Netflix now reaches 750 million worldwide out of an 8.1 billion population - almost 10% of the whole world. That's a gigantic number. YouTube may have as many (or more) viewers, but it doesn't receive recurring revenue from them (only in the form of ads). Continuing further, it's important to adjust the 8.1 billion for the quantity of people that have internet access. According to Statista , 65% of the population has access to the internet, but we need to exclude from this account the 73% of Chinese that have access (out of 1.4 billion) and the 88% of Russians that have access (out of 0.1 billion), since Netflix isn't allowed in those countries. This results in a Total Addressable Market ((TAM)) for Netflix of 4.2 billion people - the quantity of humans with access to the internet and in countries that have Netflix. Therefore, Netflix has captured almost 20% of its TAM (750 million out of 4.2 billion) - again, this is an impressive number.
With a top-down analysis like the last paragraph, I'm not sure we can go further as we would have to model in terms of economic power and that would create some conflict with the internet accessibility that I used first. However, it's good to have in mind that 4.2 billion as TAM, as we'll be back to it later. To calculate how many subscribers Netflix could have, I believe it's safer to start with what Netflix already have. The table below shows my calculation of how many subscribers could Netflix have in each Region based on economic power or internet access, always excluding China and Russia.
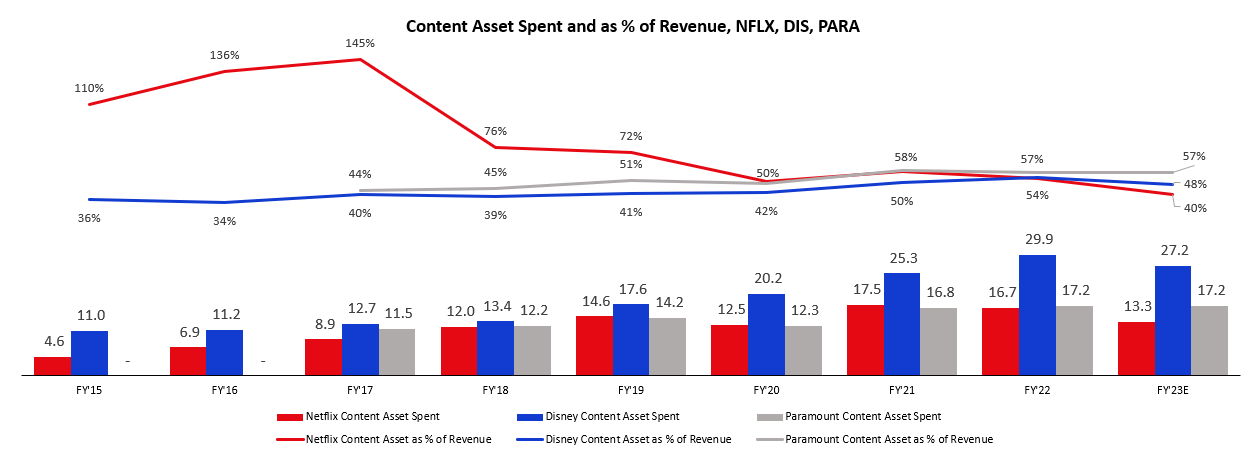
Potential Netflix Subscribers based on Internet Access or Income (World Bank, Statista, Pew Research, Wikipedia, US News)
Explaining this table, the idea here is that by knowing how many households we have in each region, we can use an assumption to estimate the potential market share of each region. To estimate that, I've considered that USCAN subscribers has peaked at 77 million, based on the decrease in subscribers that Netflix has seen between 2021 and 2022. I'm not forgetting the fact that Netflix grew its subscribers in USCAN during 2023, but that was likely driven by the password crackdown that they started and it's a non-recurrent event. They can still capture some market share with their ads offer, but that's my assumption for now.
The first set of rows called "Assumptions" contains general data, meaning it has the total population and number of households without applying any filters. That would give Netflix a 14% market share. The "Scenario 1" set of rows considers how many of the total households have access to internet (e.g., USCAN has 131 million households and 90% with internet access gives us 118 million). When using the 77 million subscribers over 118 million households with internet access, we get a market share of 65% in USCAN. When applying 65% across all regions to its households with internet access we get almost 800 million potential subscribers. "Scenario 2" uses the same logic as "Scenario 1", but instead of internet access I'm only considering the percentage of households that are middle or upper class. This results in 430 million potential subscribers.
What I conclude from this table is that Netflix likely has some room to grow, even if we assume that USCAN has likely peaked in terms of subscribers. However, that market growth is located mainly in EMEA (more likely in Middle East and Africa than Europe) and APAC and the issue here is that those populations have less access to the internet, are poorer compared to the rest of the world and have different internet consumptions habits. Again, Netflix still has room to grow, but the low-hanging fruit has already been captured. The market still uncaptured will be more competitive, more price sensitive and, probably, more interested in local content. Since I believe Income is a much stronger decision factor to confirm if someone could be a Netflix subscriber, I'll consider 430 million as the total market for Netflix at this moment.
A High Level Estimate of ARPU
Scott Galloway recently wrote in Seeking Alpha about Netflix's pricing power, mentioning the recent price hikes and that the streaming had achieved utility status. I have to say I don't quite agree with Scott as a utility is usually something you can't exchange providers, while in streaming you most surely can - just read this WSJ article for the most recent analysis on this behavior. Netflix's recent price hikes show some pricing power exists and it's a much needed one as Netflix felt the urge to start turning a profit and generating free cash flow. However, one has to ask: how much pricing power is left in Netflix? Can it be the market leader in terms of price hikes? Or the recent competition could dampen its capacity to raise prices? My way of thinking to answer these questions is two-fold: I can assess how much the top-performer in cable was earning back in the good old days and how much consumers are spending in total for streaming.
It has been consistently reported that ESPN was (and probably still is) the channel that received the highest fee from the cable companies. But how much revenue did ESPN generate for Disney, both in terms of fee and advertising? I found sources that stated ESPN received around $9.42 per subscriber from the networks during 2023, while that number was $7.21 back in 2017. In Ads, my approach was to use the amount reported as Advertisement Revenue in Disney's 10K divide it by 12 (for the months in a year) and divide it again by the number of subscribers. This yields $4.6 in 2023 and $7.6 in 2017 - the discrepancy could be in a part because Disney didn't separate ESPN from its Media Networks in 2017 but separates now. However, this drop in Ads revenue is consistent with the recent news that advertisement has been disappearing from the cable networks. The total from fees and Ads is equal to $14.81 in 2017 and $14.02 in 2023. In other words, very close to the ARPU of $16.29 that Netflix had at the end of Q3'23 in USCAN.
A different way of validating how much users would be interested in paying for Netflix is a kind of share of wallet analysis. Research shows that the average cable plan costs $83 so anyone considering cord-cutting would likely want to pay a similar amount or even lower for entertainment. It kind of goes without saying that I'd expect people to spend, on average, less than $83 a month in streaming services. A report shows that people are now paying $73, on average, for streaming services, lower than the $90 they paid back in 2021. This means that customers are now more rational with the streaming consumption, since they aren't locked in their homes due to COVID-19 and they noticed that they were actually paying more on streaming than they were with their previous cable provider. This survey even points out that Price is the most important factor to decide if they will sign-up for a streaming.
Using this article from the WSJ, if someone wants to subscribe to the main streaming services with ads (plus Apple TV+ that doesn't have this feature), they would spend $61 per month. If instead the user wants the ad-free version (except Paramount and Amazon that don't have this feature), they would spend $91 per month. In both cases, I'm not including Hulu Live TV, ESPN+, YouTube TV, Sling TV and Fubo TV. In any way we spin, it seems that customers are now paying close to what they paid for in cable and, in some cases, they are now missing on several live sports events. Would customers pay much more than this? Will they start to cut on streaming services? Try to bundle them with their cellphone or broadband operator? Here is my assumption: Customers are unlikely to pay much more than the $15 per month on a streaming unless it has valuable live sports events or live TV.
Valuation
Finally, we now have the total addressable market for Netflix (430 million households), a theoretical ARPU upper threshold for a streaming (around $15 per month) and the total monthly expense a household may have with streaming services (which seems to be maxed out). Putting all these pieces together, we can now formulate a valuation framework for Netflix. First, note on the graph below that Netflix's Global ARPU as of Q3'23 was $11.69. If we consider that Netflix achieves 430 million users with the mix by region we projected earlier and maintains the same ARPU as of Q3'23, global ARPU would go down to $10.86. This leads to the conclusion that Netflix ARPU is likely to go down as it tries to capture more customers from EMEA, APAC and LATAM, thus hurting profitability.
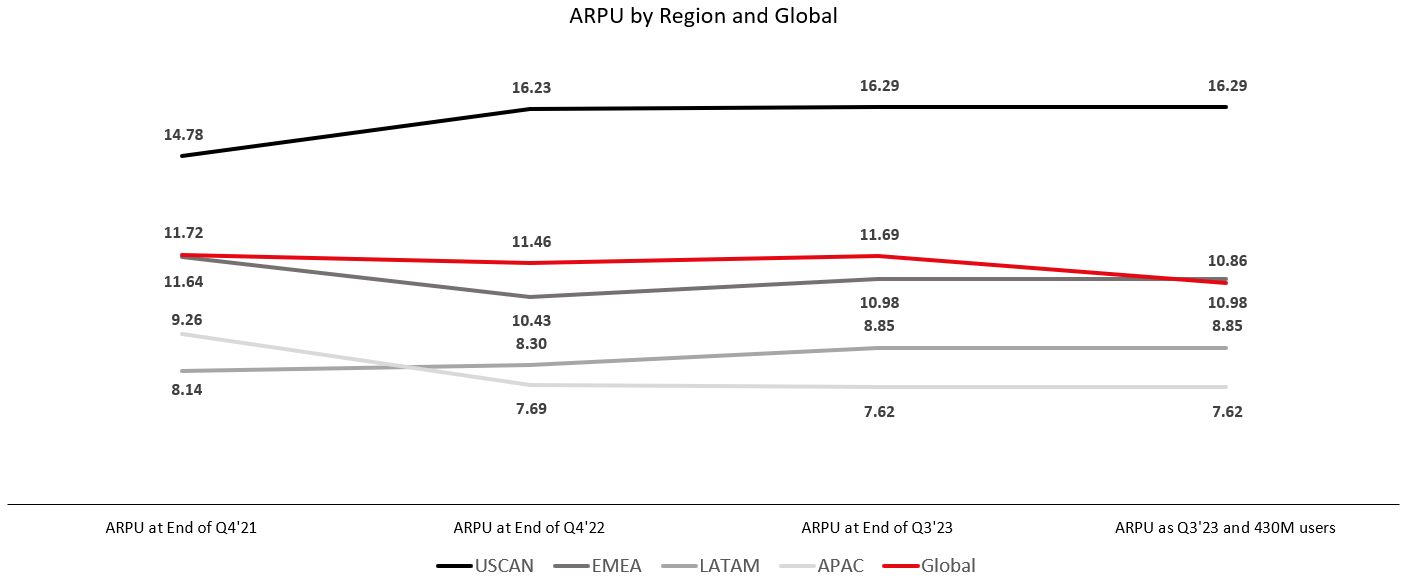
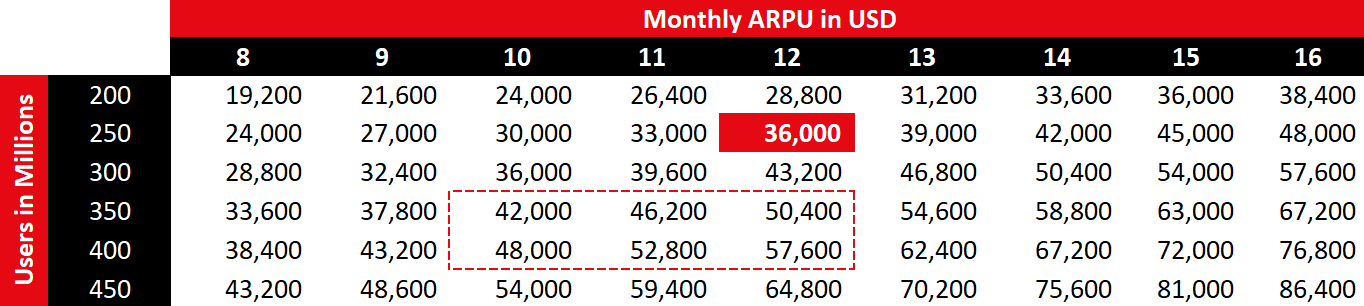
With the expected ARPU and the subscribers, we can build a sensitivity analysis to forecast how much revenue could Netflix obtain in the future. The columns represent the monthly ARPU in USD, while the rows the number of subscribers in millions. The combination of 12 USD and 250 million subscribers gives us $36 billion, which is close to Netflix current revenue. Based on what I just presented in this article that:
- 430 million subscribers are the total market for Netflix and they are unlikely to capture 100% market share.
- The Global ARPU is likely to go down given the higher growth in subscribers coming from EMEA, APAC and LATAM.
- In USCAN, the ARPU has likely peaked for the short-term given the amount users are paying for a variety of streaming services and that the most successful channel in cable was not able to earn more than $15 per month.
My expectation is that future revenue for Netflix will trend in the direction of the dotted red box. A range between $42 billion and $58 billion is big, but it highlights the uncertainties over ads monetization and subscribers growth in different regions.
Total Revenue based on ARPU (in USD) and Subscribers (in M) (Author)
If Netflix gets to my dotted red box mid-point of $50 billion, then we can build some scenarios as to how much Net Income it will generate. The table below shows the first column as the current Netflix scenario, with revenue close to $36 billion and Net Income of $5 billion (which translates to almost 40x P/E). Using different Gross Margin % assumptions and the $50 billion in revenue, it's possible to see that even if Netflix maintains the 40% gross margin (remember that depreciation is down due to lower content asset spend) it will still be trading at more than 30x P/E. However, note that $50 billion in revenue means either 100 million more subscribers or 3 USD to 4 USD more in Global ARPU. The only way I see that Netflix can be valued in line with the market is with a revenue of $60 billion and a Gross Margin of 50%.
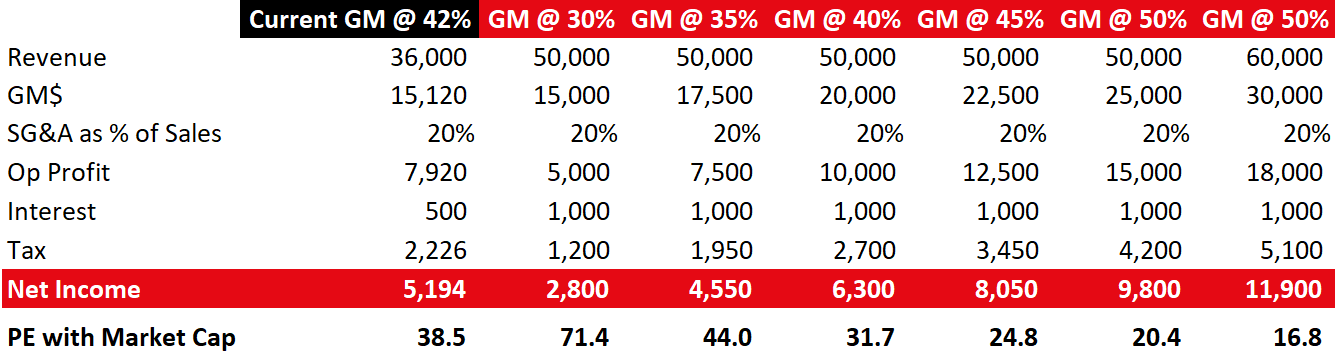
In my view, this scenario is very unlikely given the difficulty to grow with attractive ARPU in the regions outside USCAN. Even if Netflix achieves it, investors wouldn't get any appreciation as this means that their future net income is already completely priced in its valuation. Investors that buy Netflix at its current valuation should not expect market beating returns (or any return).
Risks To My Thesis (or Reasons to be Bullish)
If you believe I'm being too pessimistic, here are some reasons why my analysis could be flawed and Netflix could continue to be a great growth story:
- They will continue to gain market share, including in USCAN. Netflix will continue to approach that 450 million subscribers mark because it became to streaming what ABC, NBC and CBS were in the early days of television.
- The strategy over ads monetization will pay off and Netflix will be able to continue to grow its ARPU, even if customers decide to trade down their plans.
- The streaming war will continue but Netflix will suffer less than its competitors because of its size, volume of content creation and audience reach.
- Netflix will expand its presence in theaters, making more money out of movies while channeling demand to its streaming platform.
- Other monetization ideas (e.g., games) will be successful or Netflix will lower their Content Assed spend as they are able to better negotiate licensing agreements with other studios.
Final Thoughts
In sum, I have a bearish view on Netflix given its market capitalization of $200 billion and its difficult path forward to earn enough to justify its valuation. It doesn't mean I expect Netflix to crash down and lose a significant portion of its value, just that investors who buy Netflix now shouldn't expect market beating returns any time soon.
For further details see:
Netflix: Priced For Perfection