NBIX - Neurocrine Biosciences: Scope For Valuation Upside With Ingrezza Numbers
Summary
- After a strong performance in H2 FY22, Neurocrine Biosciences saw a sharp reversal into the new year.
- The question is, does this present an opportunity to buy or not?
- Market data suggests demand is still present and buyers have been active at these prices.
- We see scope for valuation upside and are eyeing aggressive targets of $172.50, then $211 in the upside case.
- Net-net, rate buy.
Investment Summary
With the macroeconomic paradigm again shifting in early FY23, factors like the USD and treasury yields have lessened their compressive effects on equities [Exhibit 1]. Still, this year is set to be a period for active managers, with individual stock-picking still heavily in favour.
Following a strong performance in the back end of FY22 and sudden reversal into the new year, we wanted to examine the prospects for Neurocrine Biosciences, Inc ( NBIX ). NBIX had rallied following its Q3 FY22 earnings [Exhibit 2], where management made the second upgrade to its full-year sales projections for the Ingrezza label. Net-net, we rate NBIX a buy, noting potential value even with another pullback to the sub-$108 level, eyeing upside targets to $172 and then $211 in the upside case.
Exhibit 1. USD weakness versus SPY
Data: Updata
Exhibit 2. NBIX rally across FY22
Data: Updata
NBIX tardive dyskinesia hypothesis is where the investment opportunity lies
The company's novel hypothesis in treading tardive dyskinesia ("TD") is what has NBIX on our radar in the first place. It's worth noting a few key points on the pathophysiology and pathogenesis of the condition to understand the investment opportunity here.
For those readers unaware, TD is a chronic neurological disorder that is best distinguished by dyskinetic movements [basically abnormal, repetitive, uncontrolled movements] that impact the orofacial, lingual, and hypoglossal regions [facial, mouth/lips and, tongue]. The pathophysiology of TD is multifactorial and not fully understood, however, the primary hypothesis suggests that prolonged exposure to antipsychotics - particularly the dopamine receptor antagonist sub-class - results in neurological changes that impact the dopaminergic neurons of the midbrain.
Specifically, aside from its role in the mesolimbic, or 'reward centre' of the brain, the dopaminergic system plays a crucial role in the regulation of musculoskeletal movements. Most prominently, this includes the basal ganglia and substantia nigra - two regions also involved in the pathogenesis of Parkinson's disease. However, unlike in Parkinson's - a condition that results from a lack of dopamine production - TD is thought to be caused by the over-release of dopamine. Consequently, the long-term blockade of dopamine receptors results in the downregulation of these receptors, reducing their number and activity. Moreover, this receptor downregulation is believed to result in over/under-expression of other neurotransmitters, such as acetylcholine and glutamate, ultimately leading to the development of TD.
Unsurprisingly, therefore, there is mounting evidence that TD may be related to changes in the basal ganglia and the cerebellum, and there's been an established link between these changes and the long-term use of antipsychotic medications, as mentioned. Various studies have also shown an overactivity of the glutamate N-methyl-D-aspartate ("NMDA") receptor in the brains of patients with TD, another pathway heavily regulated by the use of antipsychotics. This NMDA receptor overactivity may lead to excessive release of dopamine in the brain, resulting in the dyskinetic movements seen in patients with TD.
NBIX's Ingrezza label has been commercialized to manage TD. is a once-daily selective vesicular monoamine transporter 2 ("VMAT2") inhibitor. We'd note this is an interesting hypothesis, given that the drug reports to have no binding affinity to other key receptors in the dopaminergic pathway. According to NBIX specifically it " is thought to work by reducing the amount of dopamine released in a region of the brain that controls movement and motor function, helping to regulate nerve signaling in adults with [TD] ". Quarterly sales for the drug came in at $376mm for Q3 FY22 and this helped grow the company's total sales to ~$388mm for the quarter, a 31% YoY increase.
Moreover, two recent catalysts arose at the back end of FY22 regarding the Ingrezza label:
- The 2nd increase in FY22 sales guidance for Ingrezza on the Q3 FY22 earnings call, calling for $1.4-$1.425Bn. Previously, NBIX management projected $1.4Bn at the upper end of range.
- The FDA's approval for NBIX's supplemental new drug application ("NDA") as a potential treatment for Huntington's disease ("HD") in December. This stemmed from the company's KINECT-HD phase 3 trial, along with the ongoing KINECT-HD2 open label study checking Ingrezza in HD.
These are potential mid-term growth catalysts that look to be well received by the market, judging by the price response following each update. Moreover, the upgrade to full-year sales estimates should pull vertically down through the P&L, resulting in $135mm in core EBIT and ~$1.14 in FY22 EPS in our modelling. As we'll show later, this justifies a scenario with valuation upside for NBIX looking ahead, by estimation.
NBIX deeper view of fundamentals
We also examined NBIX with respect to profitability, as a gauge of its 'quality' factor. In FY22, and amidst the impeding economic challenges forecasted in FY23, factors of quality shone in equity markets, and we believe this will continue looking ahead.
This includes return on equity ("ROE") and return on assets ("ROA"), but as a cleaner measure, we opt to check tax adjusted operating income ("NOPAT"), free cash flow ("FCF") and return on invested capital ("ROIC") to gauge profitability for NBIX.
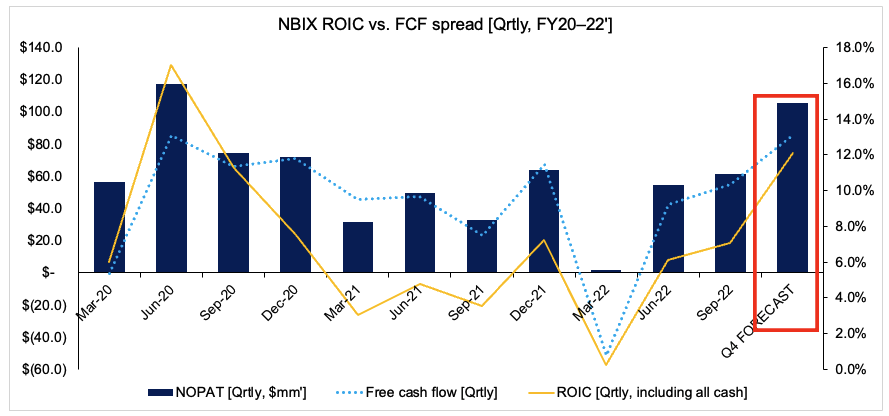
You'll see in Exhibit 3 that each of NOPAT, FCF and ROIC have curled up from March FY22 lows and now rest in-line with 3-year averages. What's best to see for the company is the trajectory of free cash inflows and ROIC lifting together, a sign that NBIX is investing its free cash wisely at a c.7% quarterly return [31.5% annualized].
Assuming the company maintains its current capital intensity, with $870mm in invested capital for Q3, and then assigning our Q4 FY22 EBIT and tax rate estimates for NBIX of $135mm and 21.8%, the trend in all three measures looks to continue rising north, as shown.
Exhibit 3. NBIX demonstrating superior ROIC, FCF and NOPAT conversion at back end of FY22
Note: "Q4 Forecast" assumptions are made using Q4 EBIT, tax rate estimates, on Q3 FY22 actuals for invested capital. No reconciliations are made for GAAP accounting. NOPAT means "net operating profit after tax", otherwise tax-adjusted operating EBIT. (Data: Author, NBIX SEC Filings)
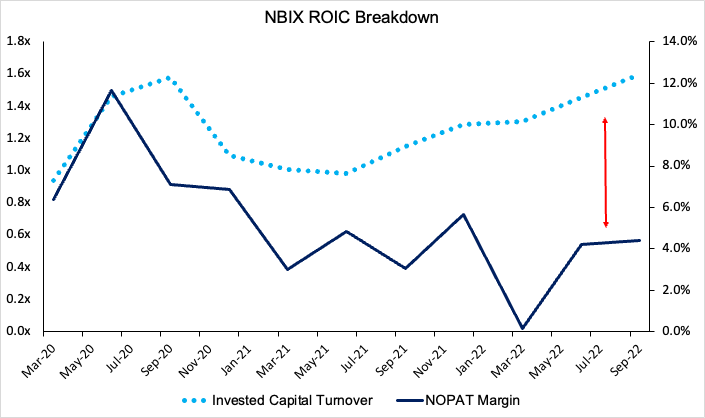
Next question we needed to answer is where the company is deriving its ROIC from. To do this, we broke the equation down into its sub-components, invested capital turnover and NOPAT margin, respectively [Exhibit 4].
As observed, the bulk of ROIC upside is derived from NBIX increasing the pace of its invested capital growth. This should be taken on notice, as it tells us that, as sales and operating income grow, the capital intensity required to drive this growth is also increasing.
Exhibit 4. NBIX quarterly ROIC breakdown, with divergence in invested capital turnover to NOPAT margin
We therefore needed to examine how this translates into value creation, both in terms of corporate value and for shareholders. This is measured by the level of economic value added ("EVA"), as you'll see in Exhibit 5.
NBIX has successfully generated $11mm in EVA in Q3 FY22, and, including the same assumptions mentioned earlier, could generate $55mm in EVA for Q4. Therefore, despite the uplift in capital intensity, this looks to have pulled through to both corporate value and value for equity holders.
Exhibit 5. NBIX EVA, Q3 FY21-F22' actuals & forecast
Data: Author
NBIX advanced technical analysis
To understand what's to transpire in the NBIX share price looking ahead, it's imperative to dive deeper into what the market is saying on the stock.
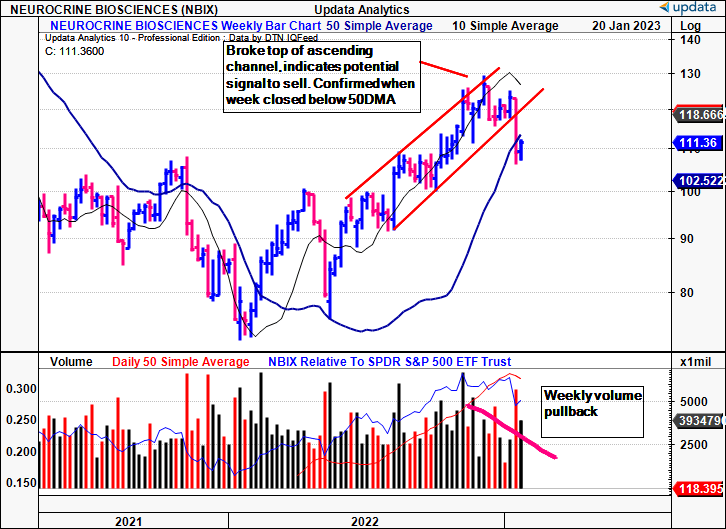
We'll run through the next series of charts in plain English to break this down for the benefit of our readers. First point to note is that NBIX broke the top of its ascending channel on December 2nd, telling us a potential consolidation was on the cards. This is a potential sell signal, and 6 weeks later, this was fulfilled, with NBIX breaking to the downside and below the 50DMA. At the same time, weekly volume trends have pulled back, although haven't completely evaporated.
Exhibit 6. NBIX broke trend first with a poke above the ascending channel then break to the downside 6 weeks later
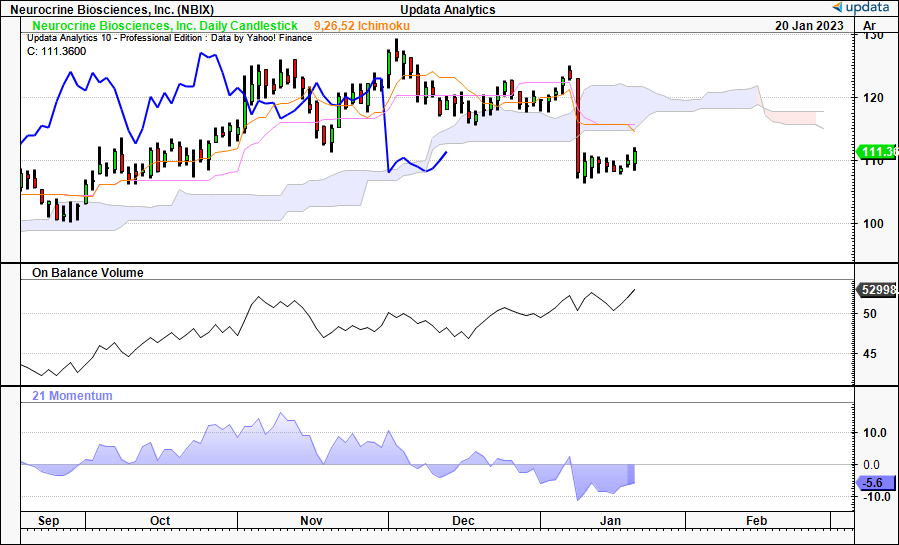
Question is, where does this leave the prevailing trend for NBIX longs? It's important to first understand the time horizon here, and with daily candles, we're looking out into the next month or so [February/March].
You can see in Exhibit 7 that shares are trading below the base of the cloud, with the lagging line [in blue] also situated below the cloud. This occurred after a large selloff in January that saw shares dip to lows of $107. There's also been a turning point in the cloud with the next sequence suggesting the recent sideways consolidation could continue for the time being. At the same time, on-balance volume had lifted in-tandem with the price action, but has levelled off since January. Meanwhile, price momentum has collapsed, as the rate of price change has slowed to a standstill.
Exhibit 7. NBIX trading below the cloud with momentum evaporating at the turn of the new year. This is potentially a bearish sign.
Looking at money flows into/out of NBIX equity, the pullback into January was immediately preceded by heavy outflows on a daily basis across November and December. Evidently, there was heavy supply over these periods, clamping the NBIX rally exhibited across the FY22 period.
This is important information, as periods of heavy outflows have seen the NBIX share price bleed value on each occasion, as seen in Exhibit 8.
On a weekly basis, inflows have still been net positive across the bulk of FY22-date, providing good evidence that demand [buyers] is/are still present and buying the stock [Exhibit 9].
Exhibit 8. Daily inflows and outflows in NBIX equity
Data: Updata
Exhibit 9. Weekly inflows and outflows in NBIX equity. As it stands, investors are still net-buyers of NBIX.
Data: Updata
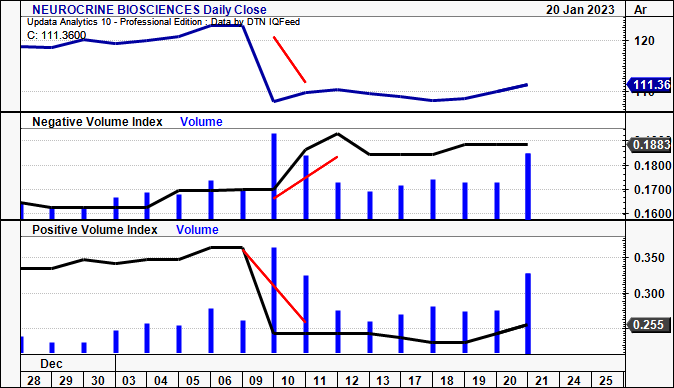
It's also essential to understand the type of buyers and/or sellers that have been driving the price action [Exhibit 10]. We gauge this by looking at the negative and positive volume indices ("NVI" and "PVI" respectively).
Shifts up/down in the NVI suggest large, institutional buyers/sellers, whereas respective movements in the PVI indicate retail trading activity. The important note to take from the chart below is that, whilst NBIX saw a large dip in price, the NVI spiked at the same time, indicating that larger accounts [funds, accredited investors, etc] were buyers at these ranges. This is important, as a recovery in the NBIX share price would stem from the presence of these institutional investors.
Exhibit 10. Large buyers present with the NBIX selloff in January
With the above analysis in mind, we then turned to what the market data is telling us to guide price action looking forward.
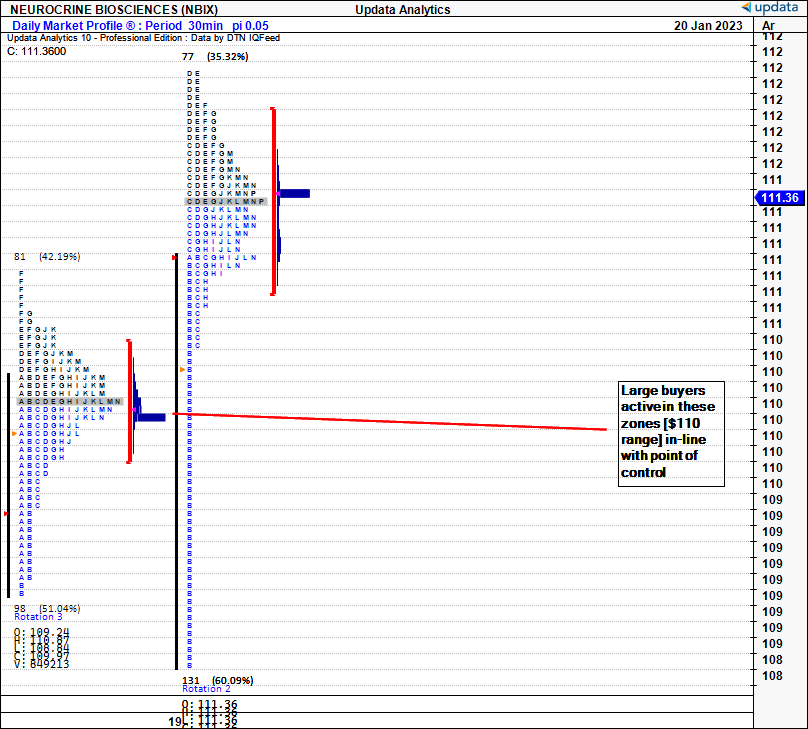
We tend to go about this two ways when looking at the marketplace specifically, using market profiles and point and figure analysis. You'll see below in Exhibit 11 and Exhibit 12 the two market profile charts for NBIX over the last month and last 2 weeks respectively.
These charts use letters to indicate where NBIX has traded with each 1 hour period over the past month of trade. The grey, highlighted bar is where the NBIX share price spent the most time over the month, whereas the red bracket shows where 70% of the trading range was. The volume histogram is shown in deep blue vertically along the profile.
What's important to take from this, is, that most of the trading activity occurred at the ~$110 region over the past few weeks, suggesting this is where the market sees a perception of value in the stock in the near-term.
You'll see with the volume trends below these levels [also in Exhibit 12] that buyers have been extremely active below this level, vindicating this point. We therefore believe that there is value in buying NBIX with another pullback below the $108-$111 range.
Exhibit 11. Market profile for NBIX over last month indicating market most comfortable at the $110-$111 range. This is the market's perception of near-term value in NBIX, by estimation.
Data: Updata
Exhibit 12. Market profile for NBIX over last 2 weeks, also indicating market most comfortable at the $110-$111 range.
Using the point and figure analysis [Exhibit 13] illustrates there's potential for a rally to $172.50 with the thrust last year. Point and figure charts are great as they provide an objective insight, giving bias to the prevailing trend. It requires a large reversal in price to see a new column formed, and so investors can clearly see where the stock is within the longer-term trend cycle. As a result, we believe there is scope for the stock to re-rate to the $172.5 region, and believe there is value to be made if it were to pull-back to the $108 region based on the analysis above.
Exhibit 13. Upside targets to $172.50
Data: Updata
Valuation and conclusion
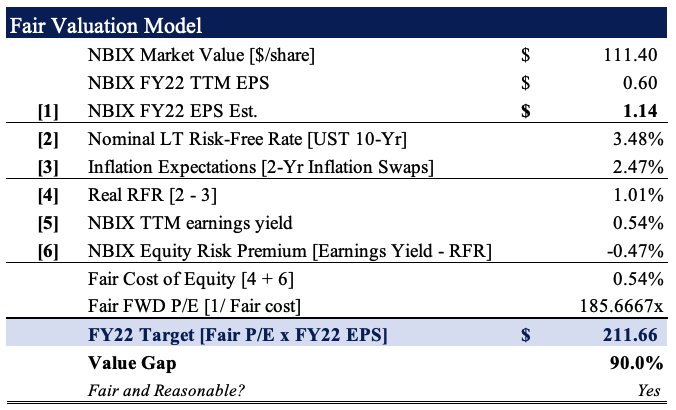
Perhaps where we see the most valuation upside in NBIX is when factoring in the upgrade to FY22 sales guidance. We see the $1.425Bn in Ingrezza sales pulling down to $1.14 in GAAP EPS should the company hit this target.
Factoring in these growth percentages there's scope for NBIX to rally to $211, should the market agree. If this were to eventuate, this would represent ~90% valuation upside from the current share price.
Exhibit 14. At $1.14 FY22 EPS estimate, we see scope for NBIX to re-rate to $211 if the market were to agree
Net-net, there's enough meat and potatoes in the NBIX investment debate to suggest that demand is there for its share price to rally higher. Fundamentals are a standout, with respect to profitability and valuation upside, and market analysis also corroborates this point. We are seeking medium term targets of $172.50 then $211 in the upside case, representing substantial value in FY23. Rate buy.
For further details see:
Neurocrine Biosciences: Scope For Valuation Upside With Ingrezza Numbers