JRE - New And Revised Data Suggests Possible Negative Change In Trend For U.S. New Home Market Cap
2023-11-29 07:45:00 ET
Summary
- Political Calculations' initial estimate of the nominal market capitalization of new homes sold during October 2023 is $29.25 billion.
- The data for October 2023 is also the first to break what had been a series of consistently rising monthly values for this measure since November 2022, though it is too early to verify if that upward trend has been broken.
- There are negative implications for the market cap of new home sales to have begun falling in October 2023.
What a difference a month and data revisions make!
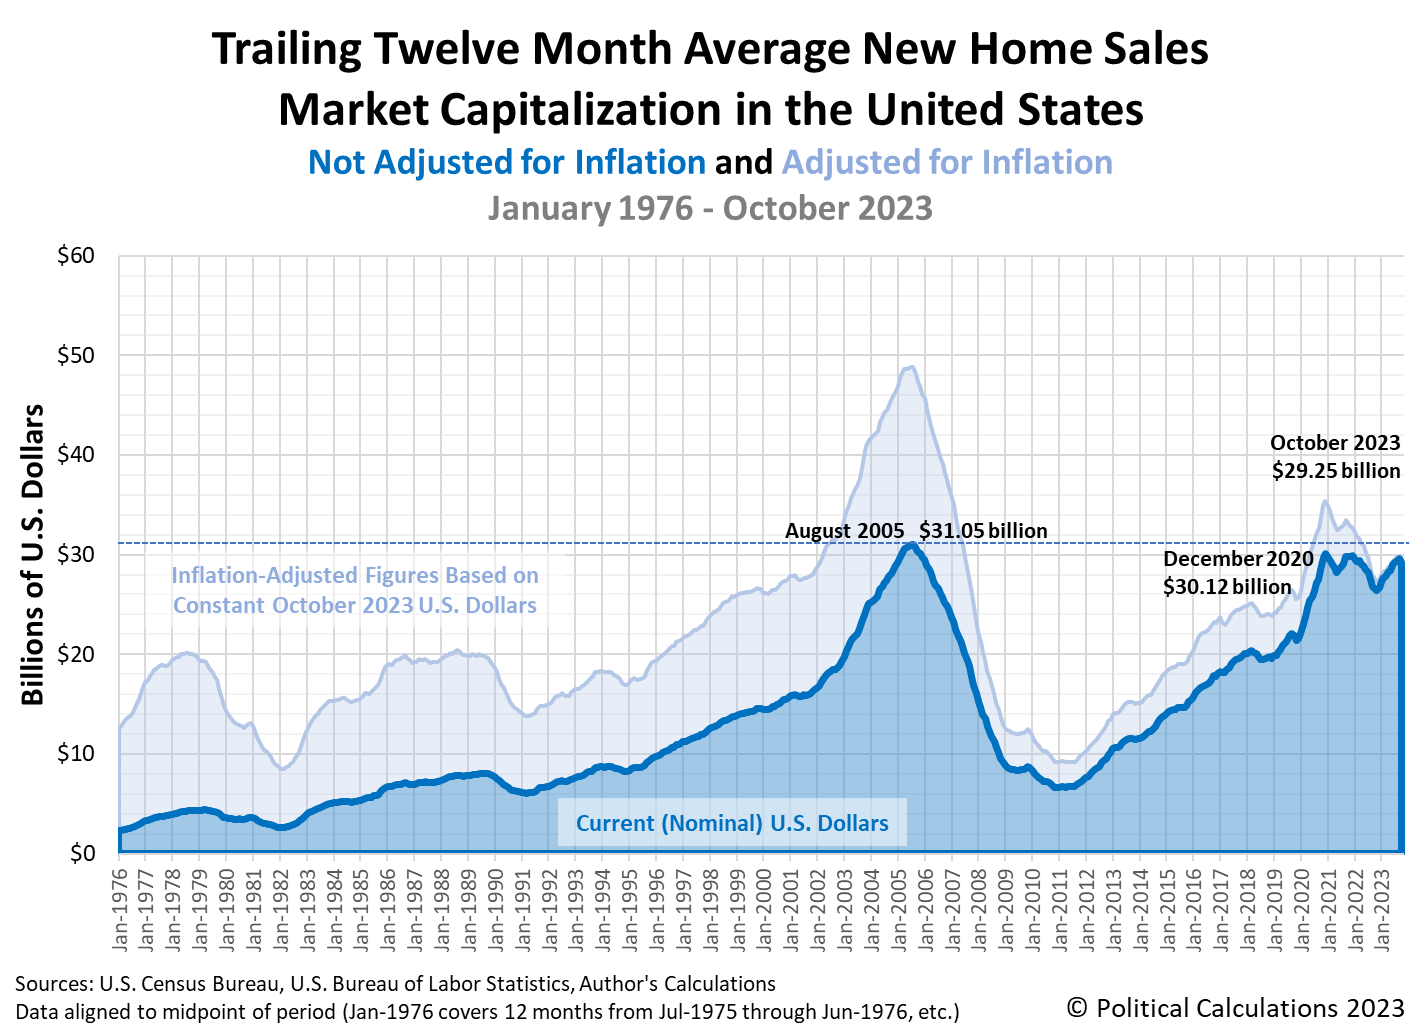
It was just a month ago that U.S. Census Bureau data on new home sales put the total value of all new homes sold during September 2023 within half a billion dollars of the $31.05 billion peak reached at the height of the U.S. housing bubble in August 2005.
But downward revisions for the number of new homes sold in recent months combined with the falling average price of new homes sold has changed that picture. Political Calculations' initial estimate of the nominal (non-inflation adjusted) market capitalization of new homes sold during the month of October 2023 is $29.25 billion. That's below September 2023's revised estimate of $29.62 billion, which itself is a full billion below our initial estimate for that month.
So rather than being close to the August 2005 nominal peak, we find instead that the market cap of all new homes sold in the U.S. has yet to surpass their December 2020 pre-Biden era peak. The data for October 2023 is also the first to break what had been a series of consistently rising monthly values for this measure since November 2022, though it is too early to verify if that upward trend has been broken.
These figures will continue to be revised over the next several months, but for now, here is the latest update to our chart illustrating the market capitalization of the U.S. new home market since January 1976:
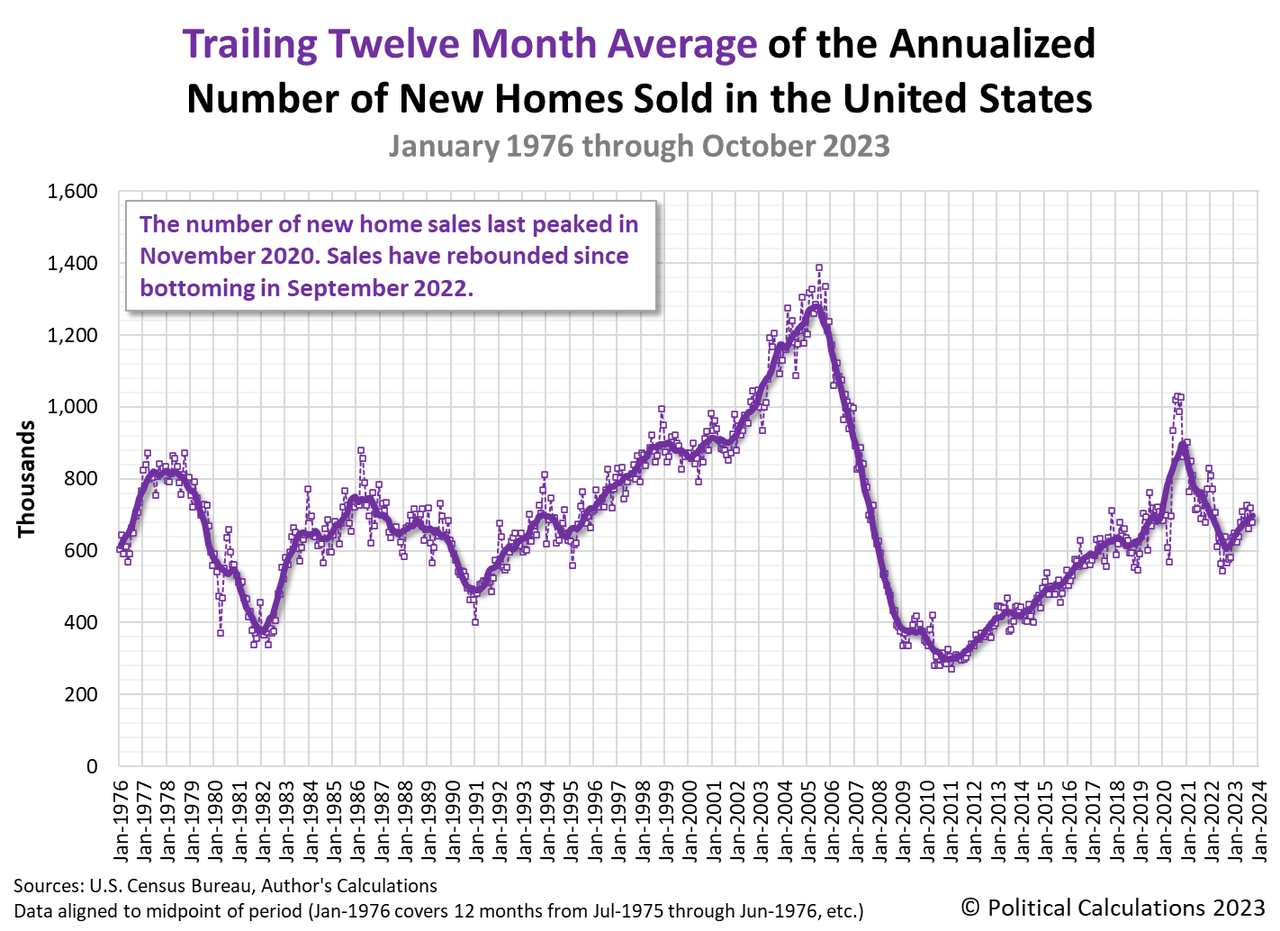
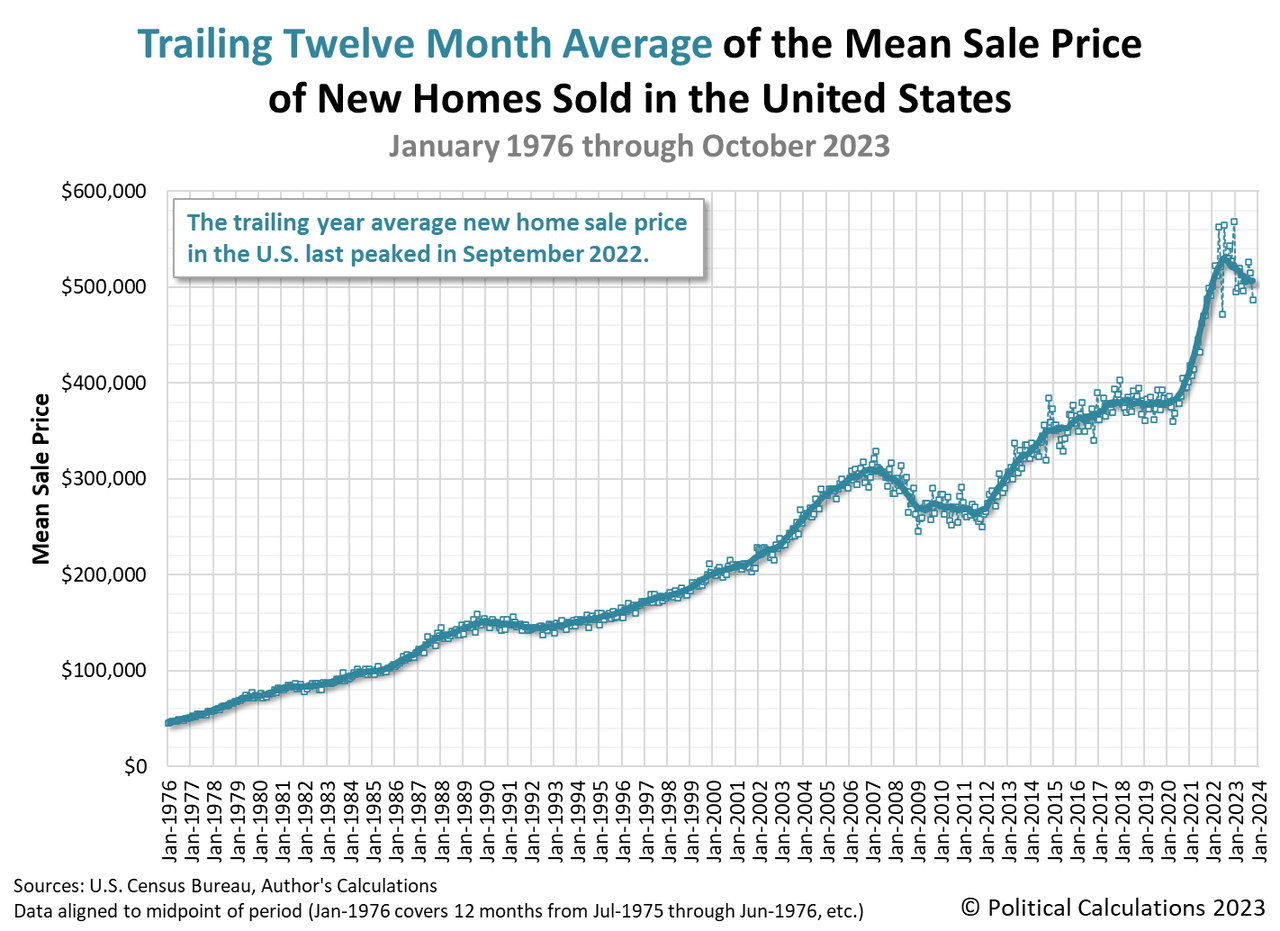
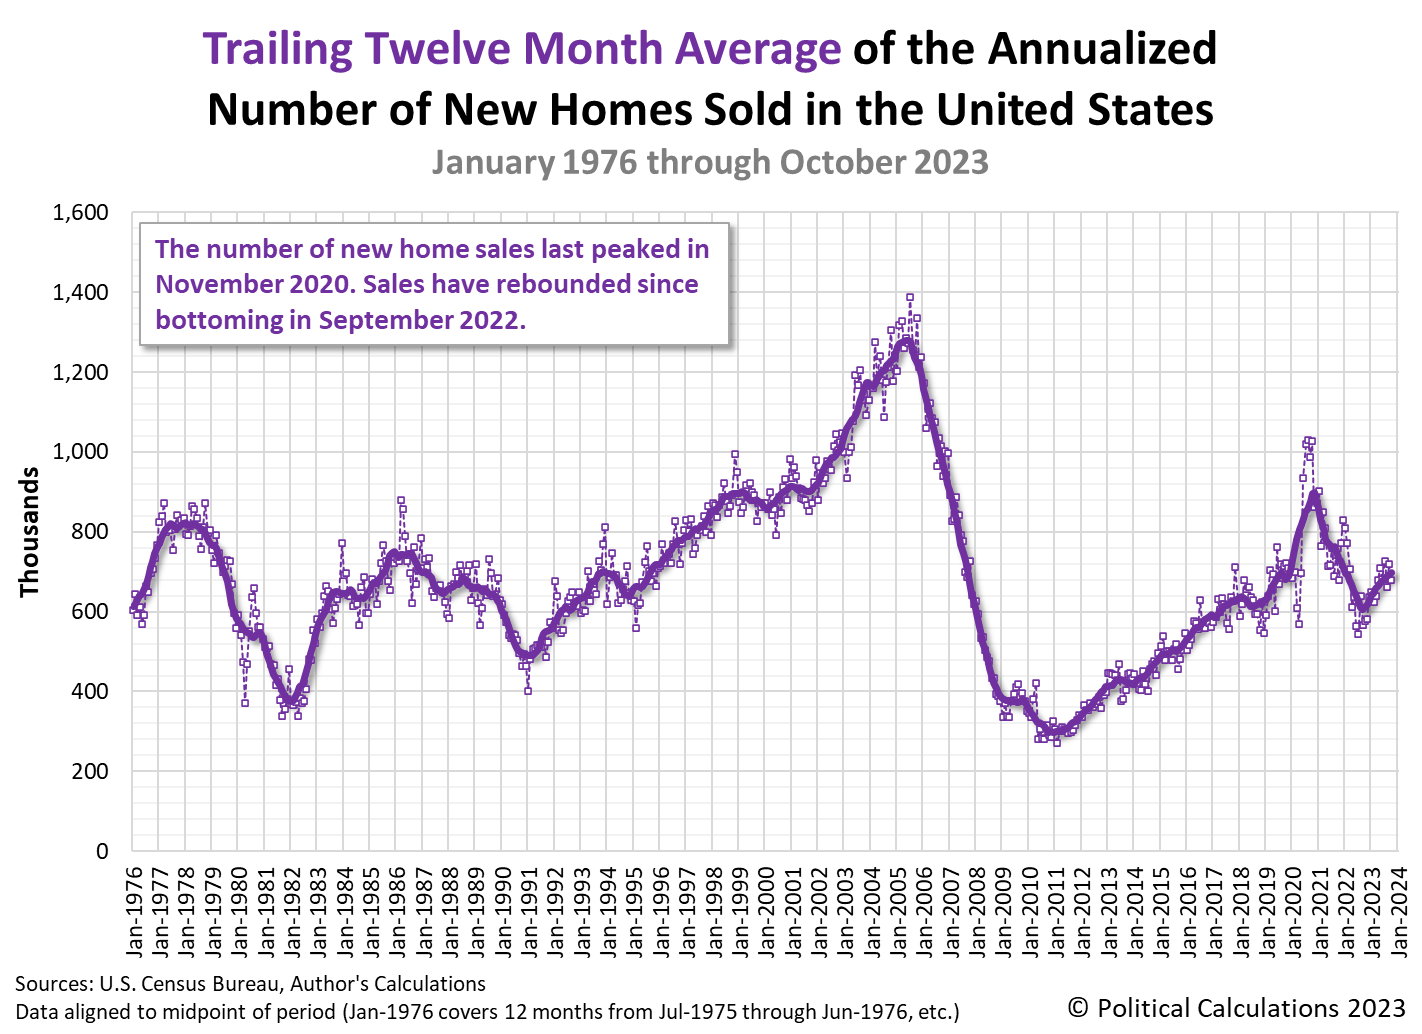
The next two charts show the latest changes in the trends for new home sales and prices :
Rising trend for new home sales slows:
New home prices heading downward:
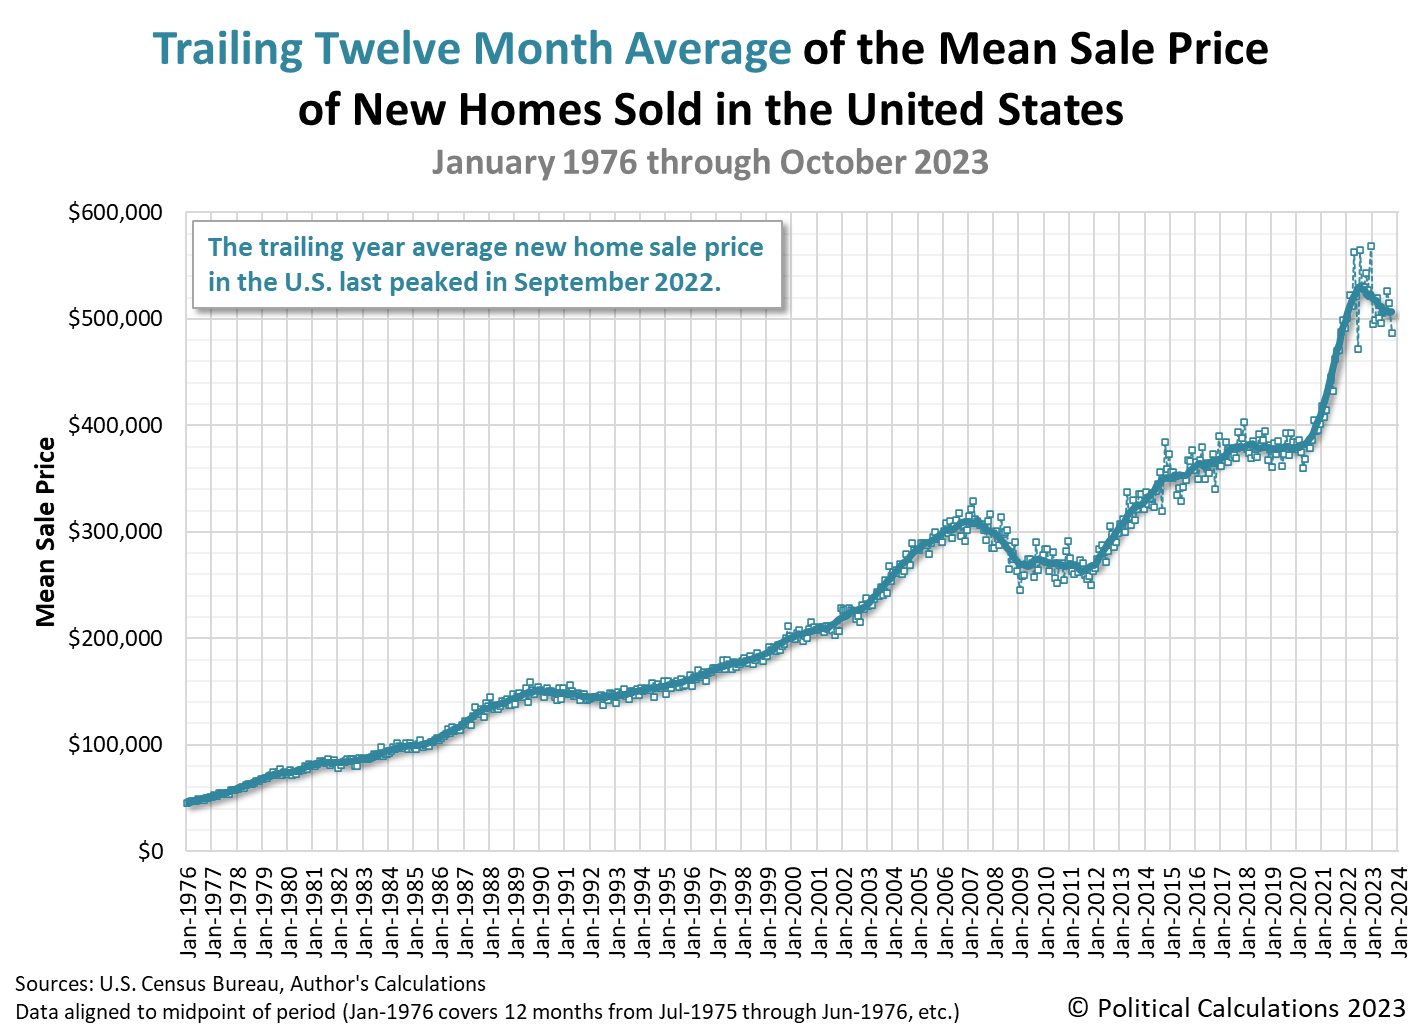
There are negative implications for the market cap of new home sales to have begun falling in October 2023. Since new home sales contribute roughly 3-5% to the nation's Gross Domestic Product, a change from a rising to a falling trend would mean the market for new homes may now be contributing a headwind to the U.S. economy.
References
U.S. Census Bureau. New Residential Sales Historical Data. Houses Sold. [ Excel Spreadsheet ]. Accessed 27 November 2023.
U.S. Census Bureau. New Residential Sales Historical Data. Median and Average Sale Price of Houses Sold. [ Excel Spreadsheet ]. Accessed 27 November 2023.
Editor's Note: The summary bullets for this article were chosen by Seeking Alpha editors.
For further details see:
New And Revised Data Suggests Possible Negative Change In Trend For U.S. New Home Market Cap