NGD - New Gold: 2023 Guidance Offers A Sliver Of Hope
Summary
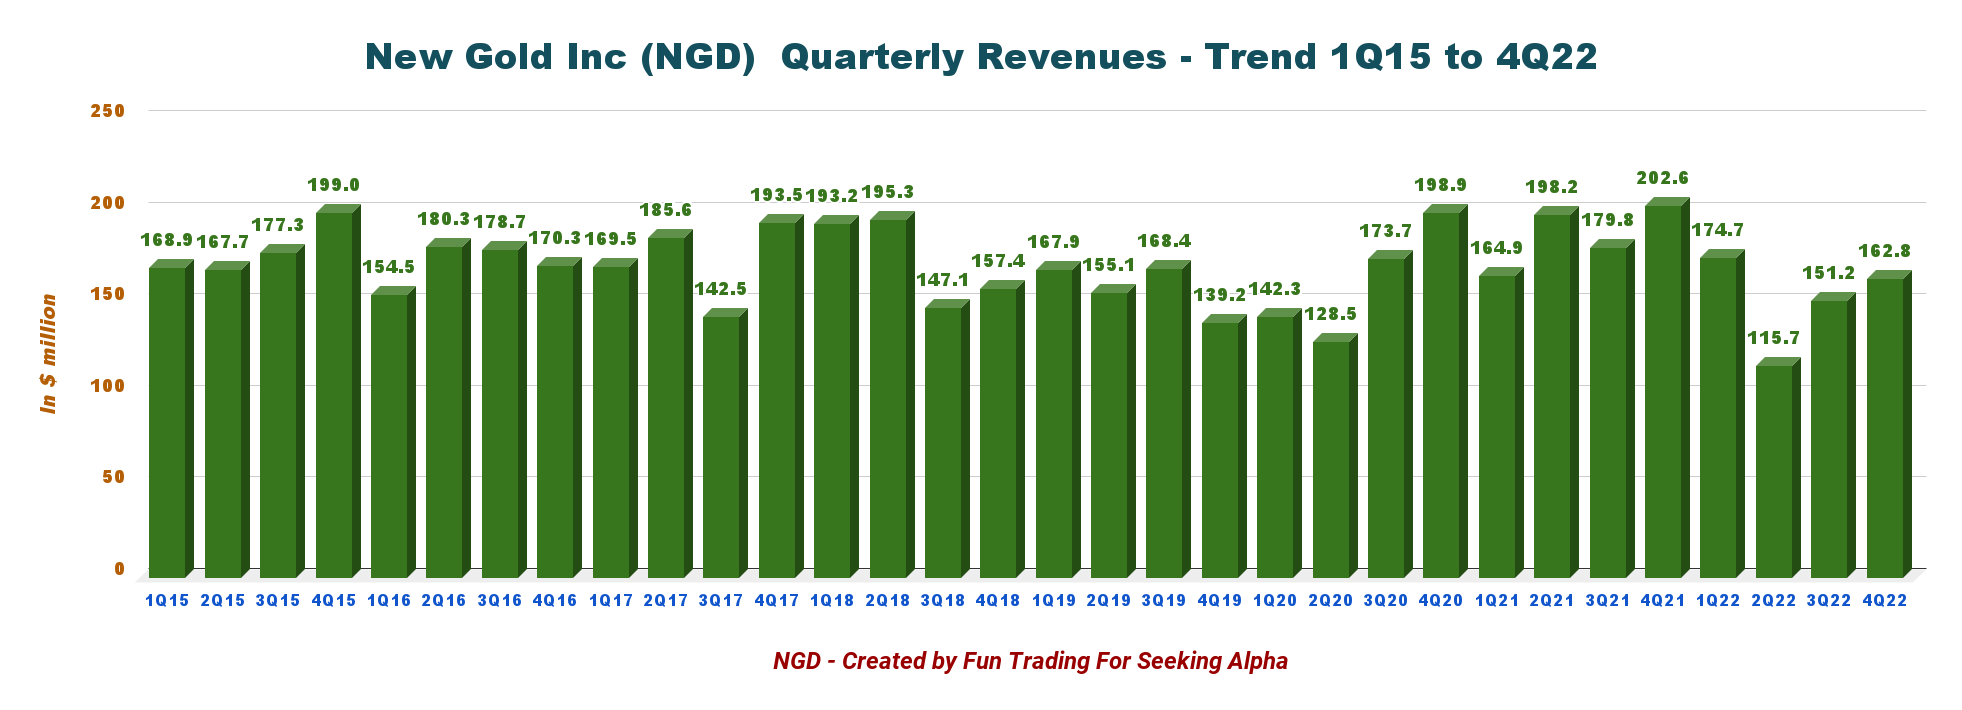
- New Gold's revenues for the fourth quarter of 2022 decreased significantly from $202.6 million in 4Q21 to $162.8 million.
- New Gold Inc. production for 2023 is expected to be 365K-425K GEOs with 280K-320K Au ounces and 38-48 Mlbs of copper.
- I recommend buying NGD between $0.935 and $0.885 with possible lower support at $0.85.
Part I - Introduction
Canada-based New Gold Inc. (NGD) released its fourth-quarter 2022 and FY22 results on February 16, 2023.
Note: This article is an update of my article published on November 4, 2022. I have followed NGD on Seeking Alpha since January 2019.
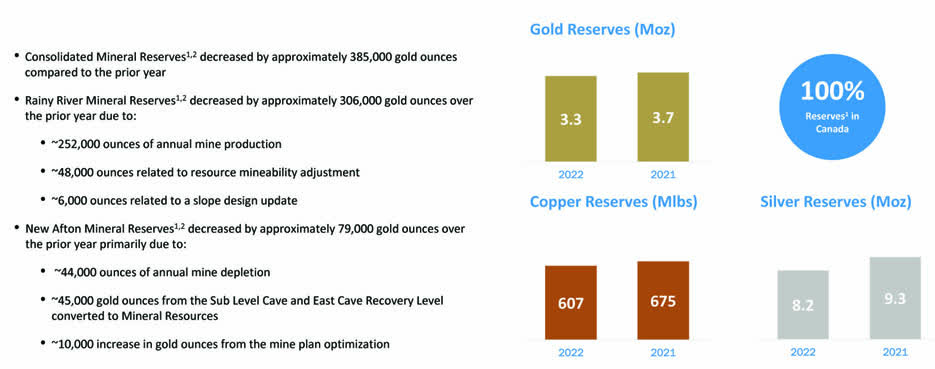
New Gold operates two mines: The Rainy River and the New Afton mines, with 2022 reserves of 3.3 Moz of gold, 607 Mlbs of Copper, and 8.2 Moz of silver. Reserves went down over 10% YoY.
NGD Reserve gold, silver, and copper in 2022 (NGD Presentation)
1 - 4Q22 Results highlights
Revenues for the fourth quarter of 2022 decreased significantly from $202.6 million in 4Q21 to $162.8 million.
The company said the revenue for the quarter decreased over the prior-year period primarily due to lower copper sales volume and lower gold and copper average realized prices.
For the year ended December 31, 2022, the decrease in revenue over the prior-year period was due to lower gold and copper sales volume, and lower copper average realized prices.
The company posted a net loss of $16.9 million compared to a loss of $11.3 million in 4Q21. Adjusted net loss was $16.7 million from an income of $150.9 million in 4Q21.
Gold equivalent production for the quarter was 97,924 ounces (80,694 ounces of gold, 6.9 million pounds of copper, and 128,145 ounces of silver).
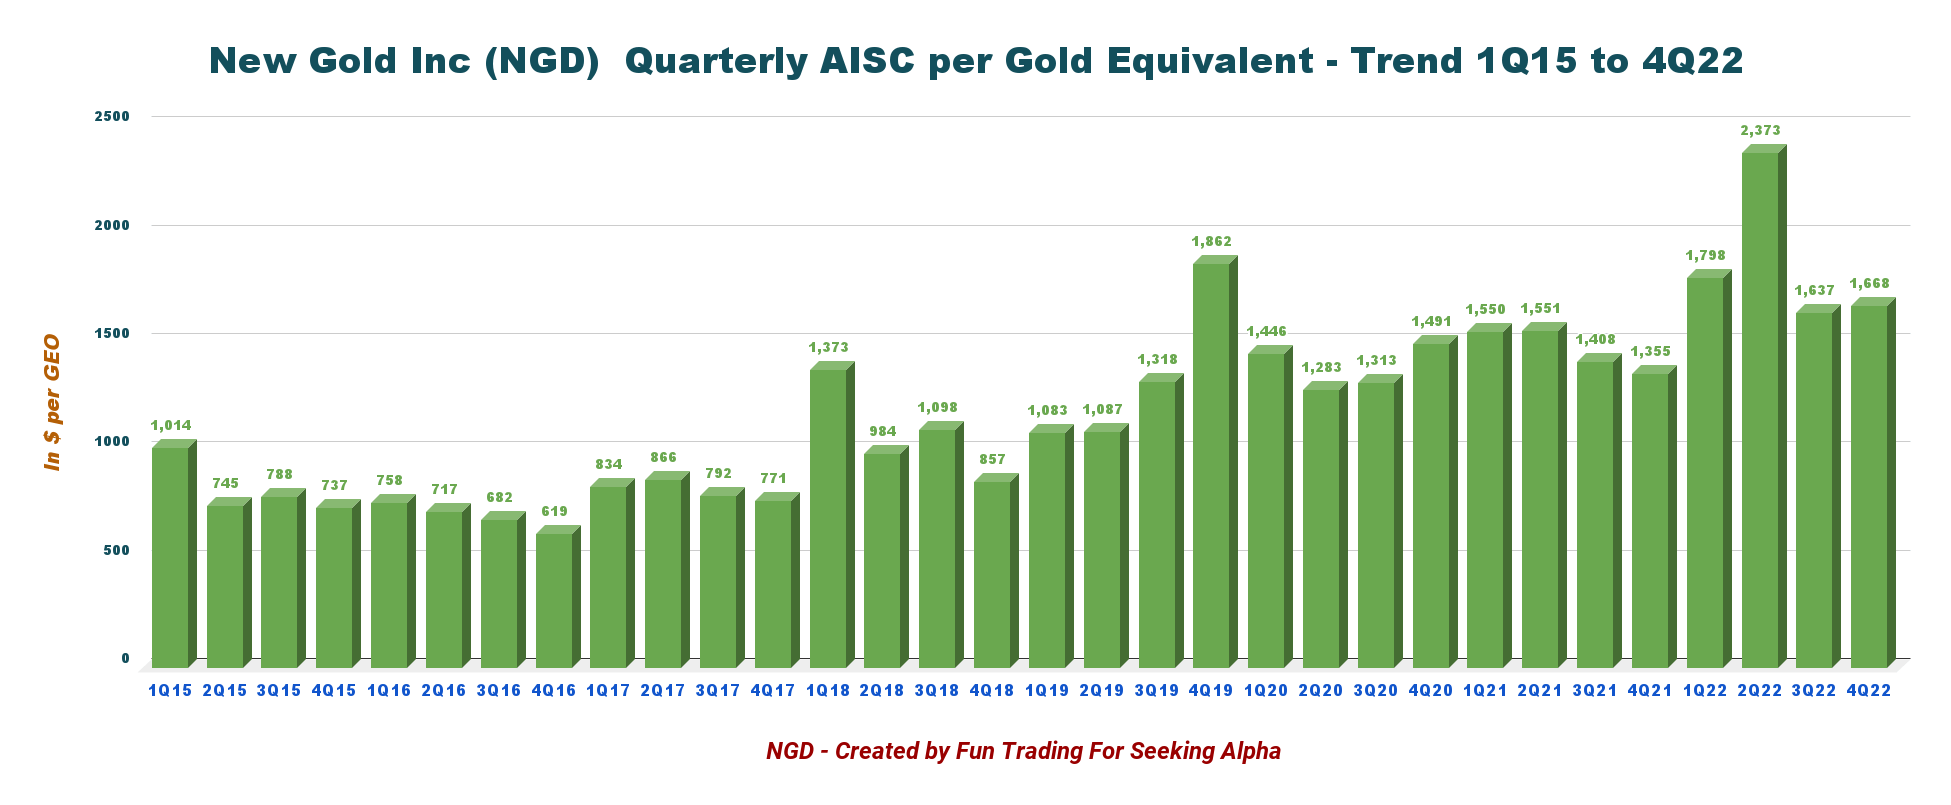
All-in sustaining costs AISC were $1,668 per GEO in 4Q22, including total cash costs of $1,167 per GEO.
AISC is elevated and has been an issue for many quarters, as we will see later in this article. AISC went up 1.9% sequentially due to inflationary pressures. However, one silver lining here, CEO Patrick Godin said in the conference call :
All-in sustaining costs are also expected to decrease by over $100 per ounces to 1500 to 1600. Costs are lower than last year due to the lower sustaining capital expenditures and higher productions.
2 - Investment Thesis
The investment thesis is limited for New Gold due to the risk related to its only two mines that are not delivering a production that could be qualified as terrific with recurring technical issues , even if the mines' location in Canada offers extra security.
In late 2021, Rainy River's East Lobe deposit had a grade problem.
The grade shortfall came from mining at the East Lobe deposit, which delivered 20,000 fewer ounces than expected in July and August. The zone will contribute about half of production from Rainy River in the second half of the year, and about 35% in the final quarter.
Thus, I recommend trading the stock and keeping a low long-term position in NGD. One possible positive outcome is that NGD gets acquired by another Canadian producer like Eldorado Gold ( EGO ) or even Newmont Corp. ( NEM ) at a good enough premium.
3 - Stock Performance
NGD has significantly underperformed the VanEck Vectors Gold Miners ETF ( GDX ). NGD is now down 53% on a one-year basis; however, still above its record low in September 2022. The company stock is definitely struggling.
4 - Gold Production Details For The Fourth Quarter Of 2022
Note: The gold production was covered in my preceding article on Janvier 11, 2023. This part is an update of this previous article, including data unavailable at the time (AISC, Gold price realized, etc.).
4.1 - The raw numbers
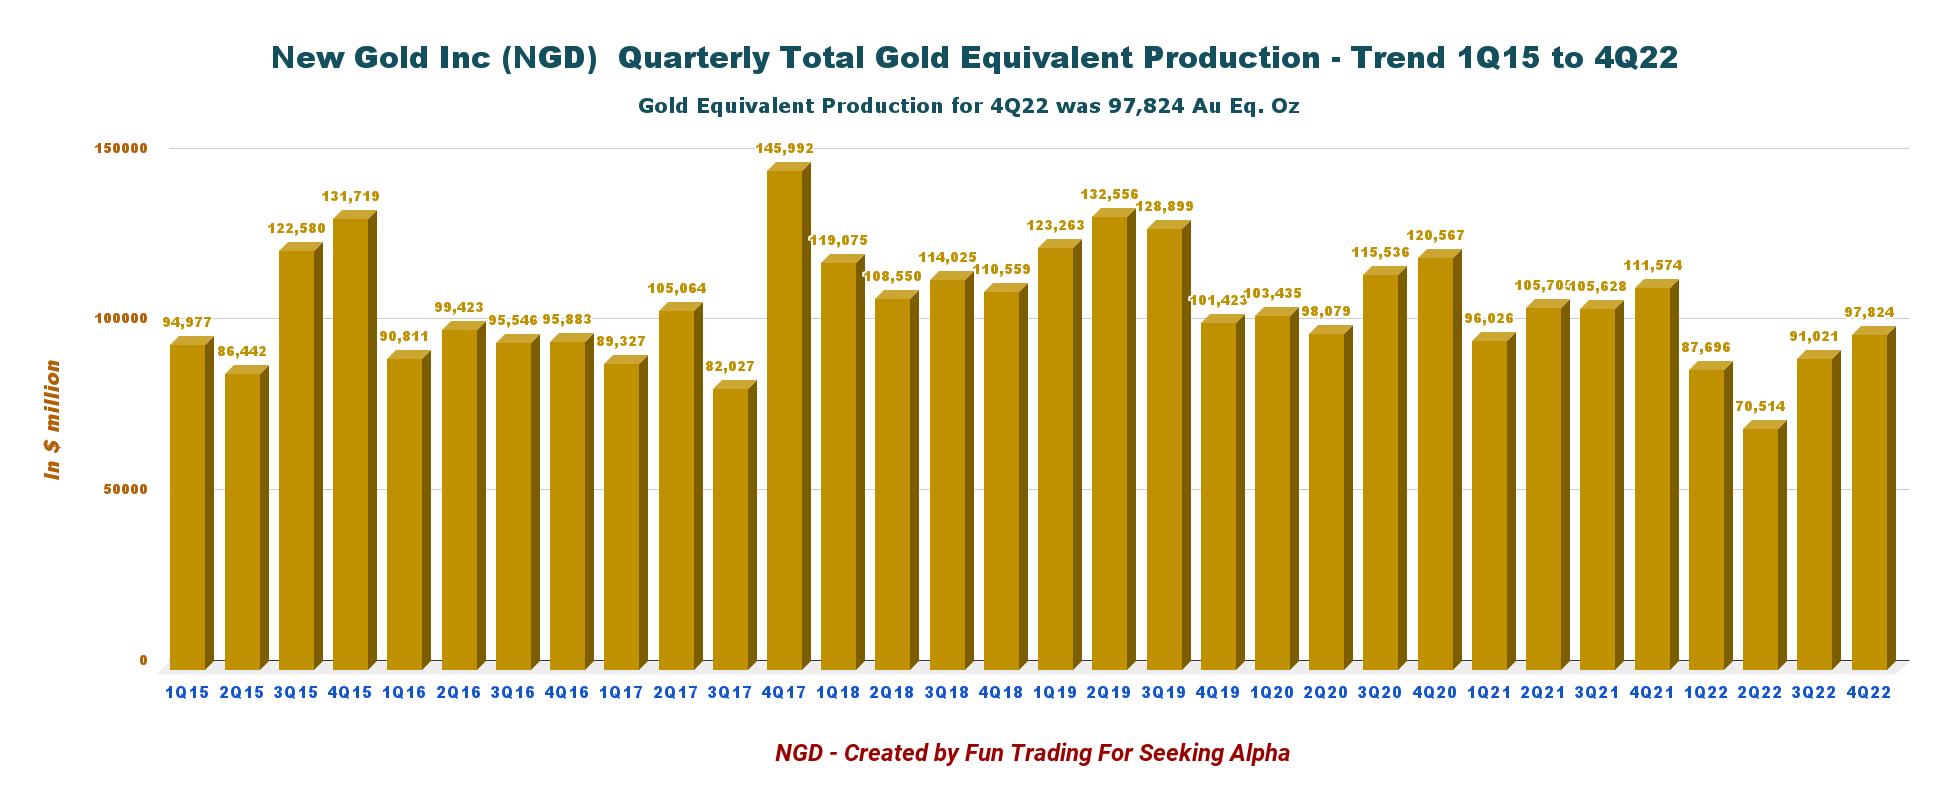
NGD Quarterly Gold Equivalent production history (Fun Trading)
NGD produced 97,824 GEOs during the fourth quarter, up 7.5% sequentially. The company sold 95,161 GEOs in 4Q22.
AISC for 4Q22 was $1,668 per ounce.
NGD Quarterly AISC history (Fun Trading)
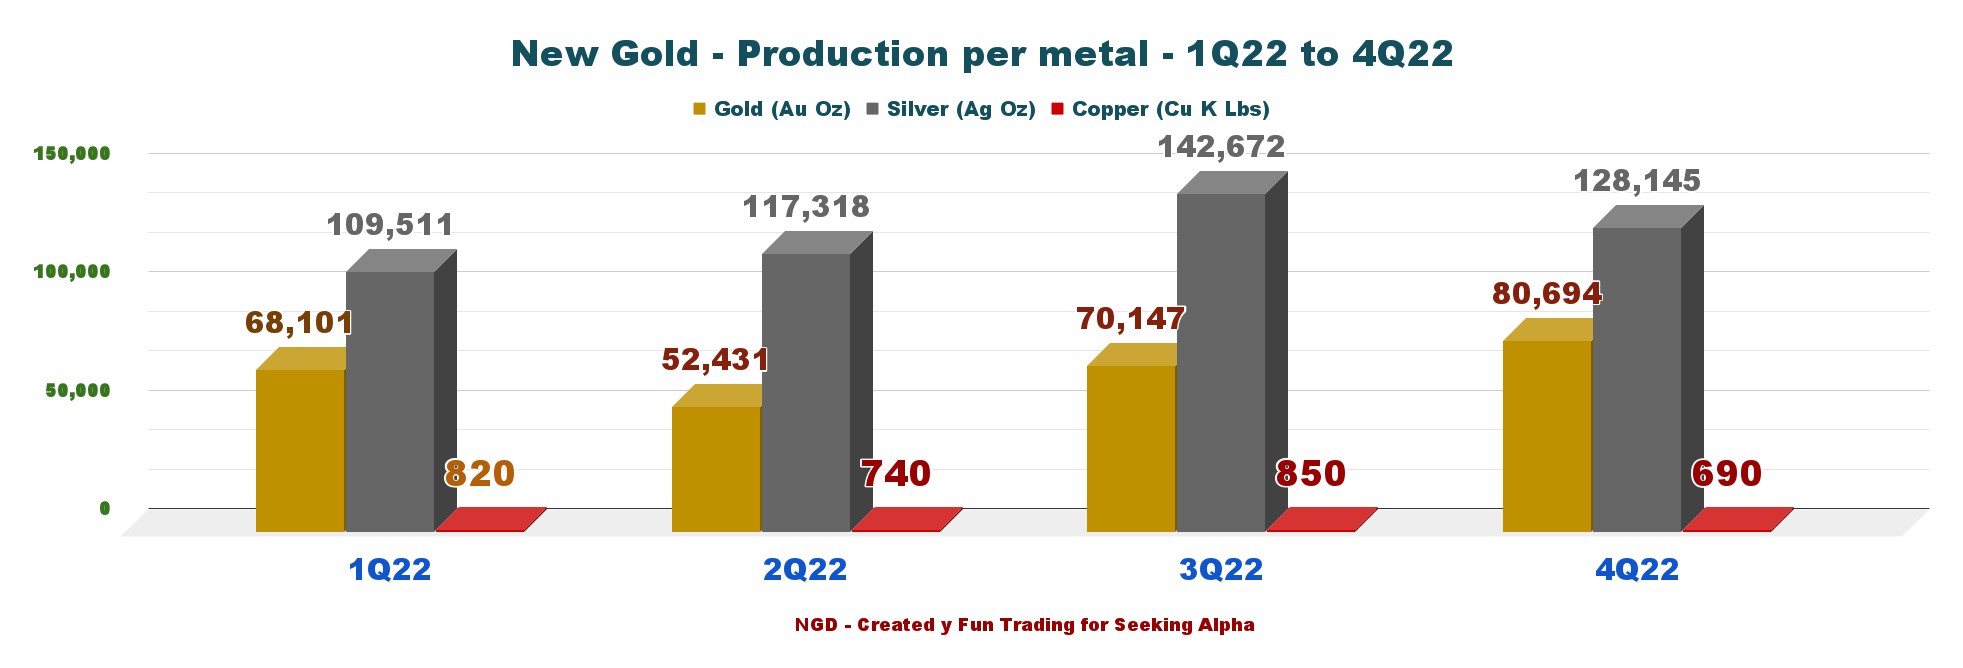
The production of equivalent gold ounces GEO includes gold, silver, and copper. Below are the details:
- Gold production was 80,694 Au oz
- Silver production was 128,145 Ag oz
- Copper production was 6.9 M Pounds.
Below is shown the production for the four quarters in 2022 and per metal:
NGD Quarterly production per metal in 2022 (Fun Trading)
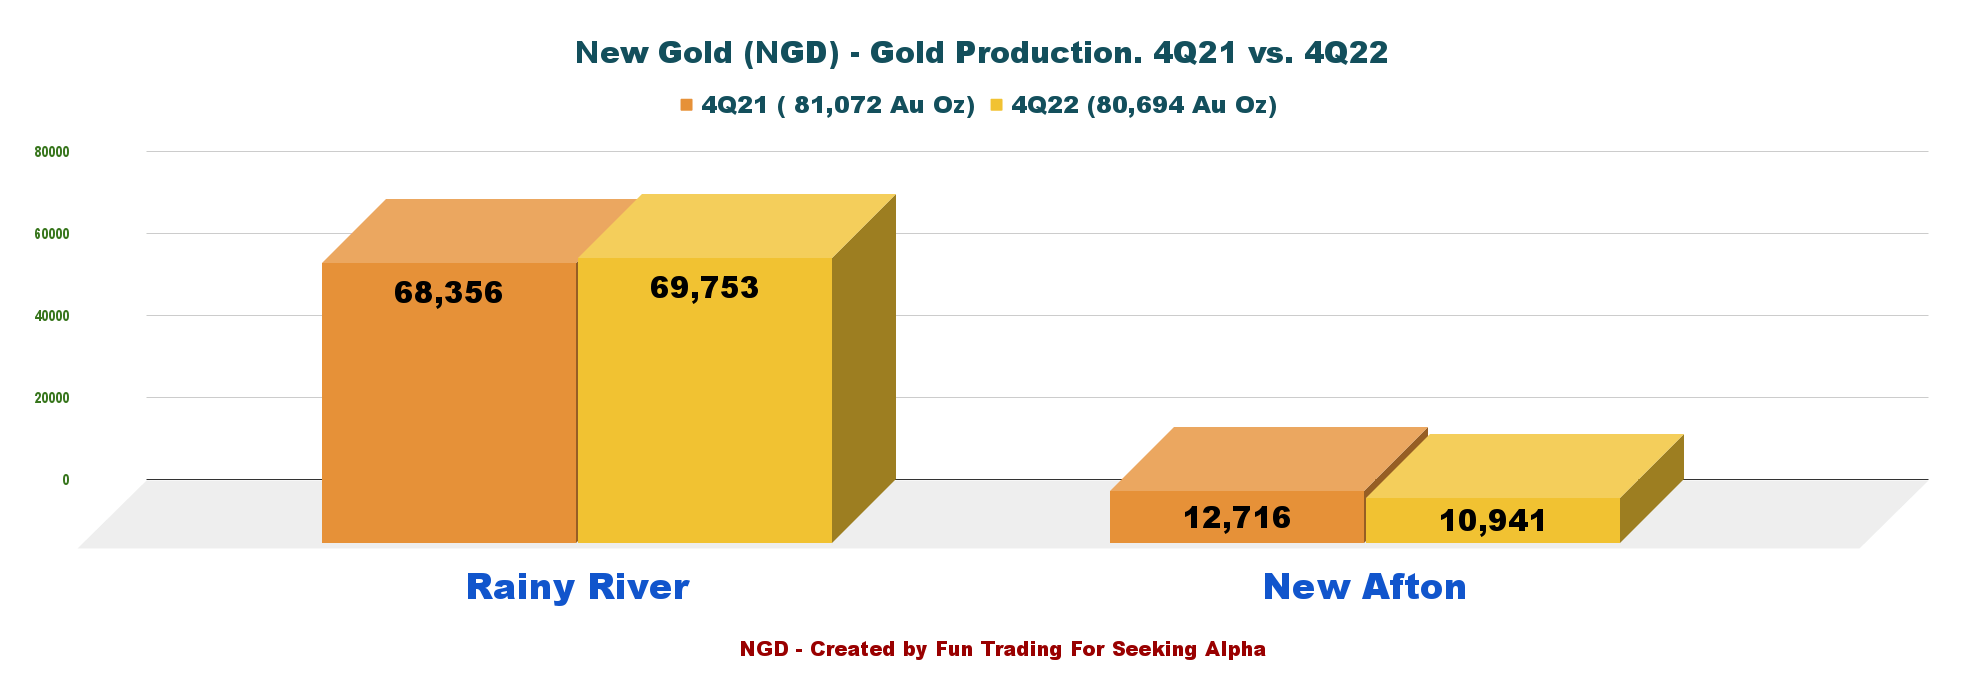
Gold production for the Rainy River mine was 69,753 Au ounces, and 10.941 Au ounces for the New Afton mine.
At Rainy River, underground mining helped deliver solid production. The best quarter in 2022, in fact.
At New Afton, New Gold Inc. had solid production with the successful ramp-up of B3 with 8,000 TPD.
NGD Quarterly production per mine 4Q21 versus 4Q22 (Fun Trading)
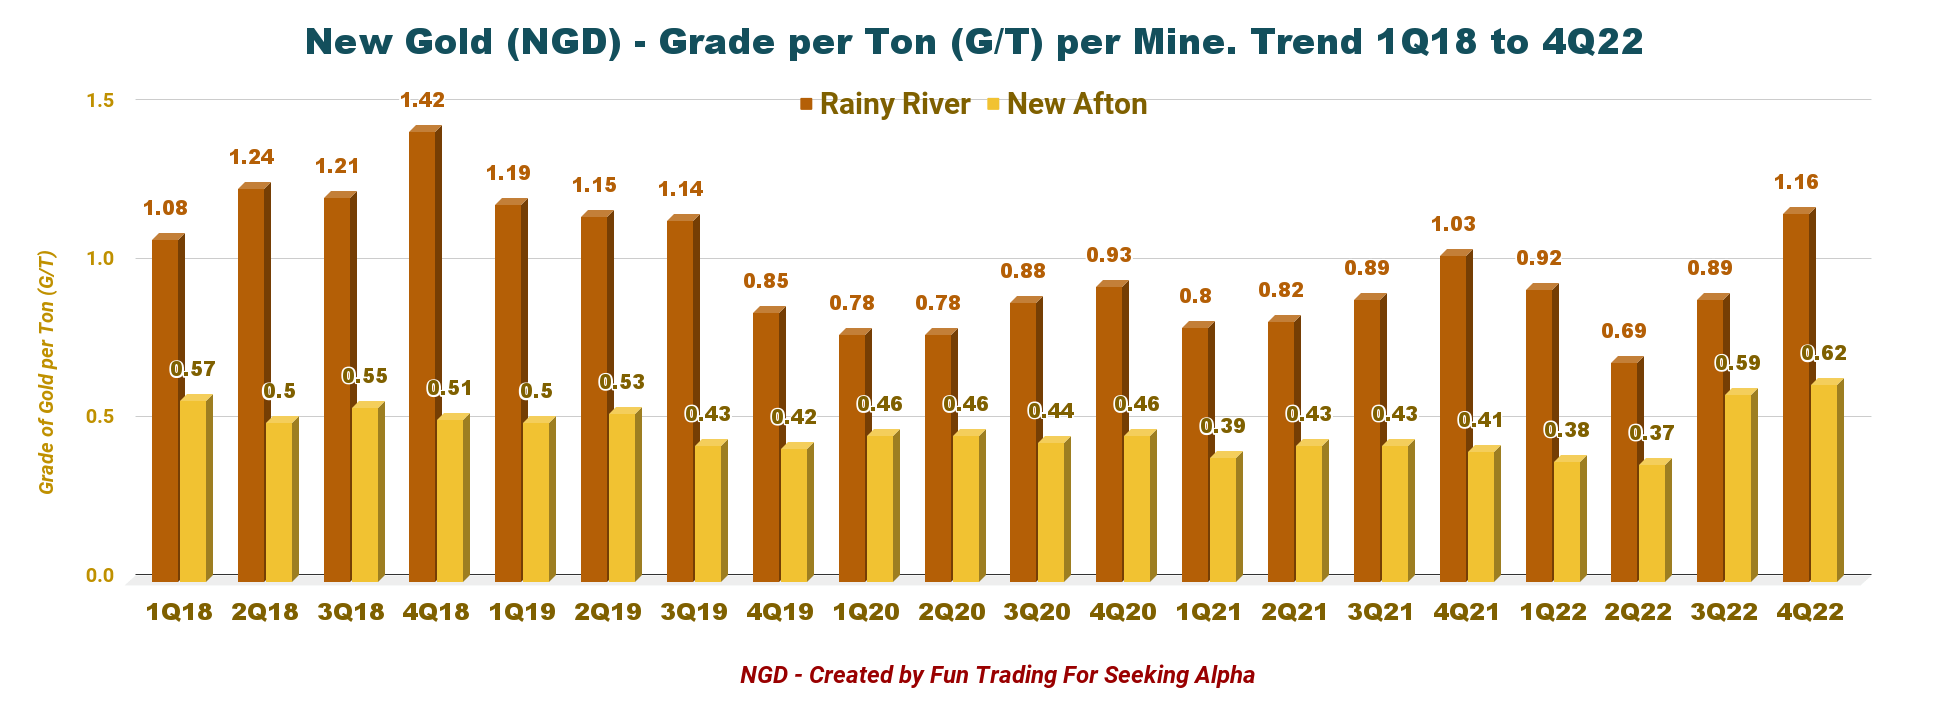
The grade per tonne G/T recovered from the disastrous second quarter of 2022 with another record high at New Afton and a solid grade at Rainy River due to the underground. It was encouraging news that eased some of my earlier concerns.
NGD Quarterly grade per tonne per mine history (Fun Trading)
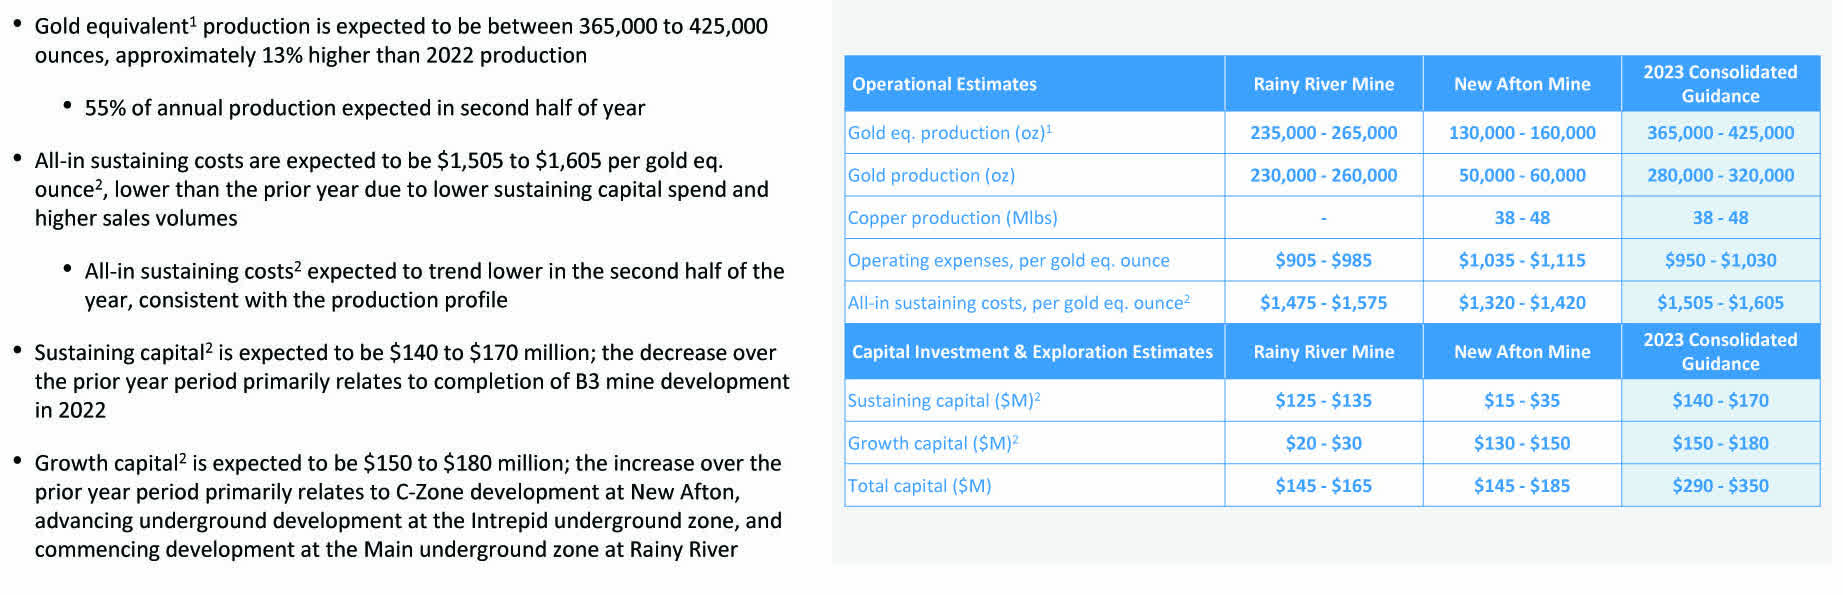
5 - 2023 Consolidated Guidance. A sliver of hope.
New Gold Inc. production for 2023 is expected to be 365K-425K GEOs with 280K-320K Au ounces and 38-48 Mlbs of copper.
AISC will be between $1,505 to $1,605 per ounce, which is lower than the company realized in 2022.
Finally, CapEx is expected to be between $140 million and $170 million after completing the B3 and draw bell construction in 3Q22.
NGD Consolidated 2023 Guidance (NGD Presentation)
CEO Patrick Godin said in the press release:
Looking ahead to 2023, our core strategy and objectives remain unchanged. We will advance key priorities at both sites with the health and safety of our team at the forefront. At Rainy River, we will continue to advance underground production from the Intrepid zone and begin developing the Main zone below the pit with the first in-pit portal to be completed in the second half of the year. This year will also be the last significant capital waste stripping year which will reduce sustaining capital in future years
New Gold Inc. - Balance Sheet history until 4Q22 - The Raw Numbers
| New Gold NGD |
| 4Q21 |
| 1Q22 |
| 2Q22 |
| 3Q22 |
| 4Q22 |
| Total Revenues in $ million |
| 202.6 |
| 174.7 |
| 115.7 |
| 151.2 |
| 162.8 |
| Net Income in $ million |
| 150.9 |
| -7.8 |
| -37.9 |
| -4.2 |
| -16.9 |
| EBITDA $ million |
| 214.7 |
| 47.6 |
| 7.9 |
| 43.1 |
| 59.2* |
| EPS diluted in $/share |
| 0.23 |
| -0.01 |
| -0.06 |
| -0.01 |
| -0.02 |
| Cash from Operating Activities in $ million |
| 105.7 |
| 67.8 |
| 37.4 |
| 53.7 |
| 31.9 |
| Capital Expenditure in $ million |
| 58.1 |
| 78.2 |
| 76.1 |
| 69.9 |
| 71.3 |
| Free Cash Flow in $ million |
| 47.6 |
| -10.4 |
| -38.7 |
| -16.2 |
| -39.4* |
| Total cash $ million |
| 541.0 |
| 494.7 |
| 324.9 |
| 279.9 |
| 236.4 |
| Total Long-Term Debt in $ million |
| 491.0 |
| 491.5 |
| 394.4 |
| 394.7 |
| 394.9 |
| Shares outstanding (diluted) In millions |
| 687.5 |
| 681.3 |
| 682.0 |
| 682.3 |
| 681.9 |
Data Sources: Company release
* Estimated by Fun Trading.
Analysis: Balance Sheet Discussion
1 - Revenues of $162.8 million in 4Q22
NGD Quarterly Revenues history (Fun Trading) New Gold posted revenue of $162.8 million for 4Q22, down 19.6% from the same quarter a year ago and up 7.7% sequentially. The company posted a net loss of $16.9 million compared to a gain of $150.9 million in 4Q21. The adjusted net loss was $6.3 million or $0.01 per share.
Revenue decreased over the prior year due to lower copper sales volume and realized copper prices.
2 - Free cash flow was a loss of $39.4 million in 4Q22
NGD Quarterly Free cash flow history (Fun Trading) Note: The generic free cash flow is the cash from operating activities minus CapEx.
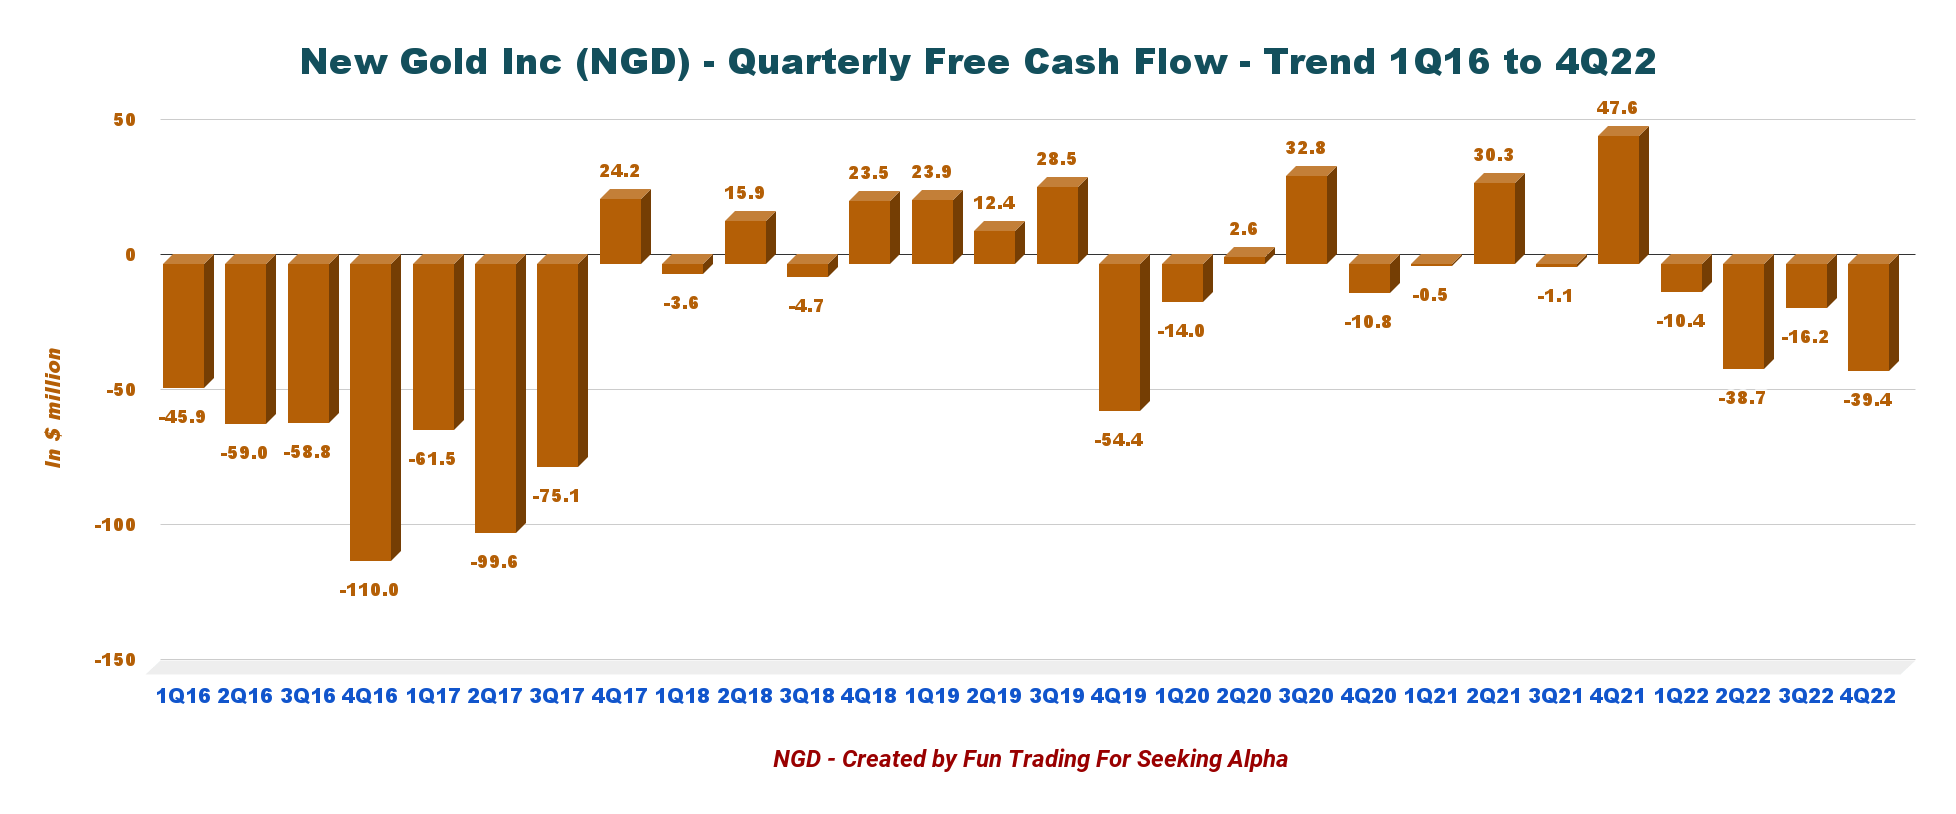
The free cash flow for 4Q22 was a loss of $39.4 million, with a trailing 12-month free cash flow loss of $104.7 million. The company is struggling. However, free cash flow should recover in 2023 after the completion of the B3 expansion.
3 - Net debt is $158.5 million as of December 31, 2022
NGD Quarterly Cash versus Debt history (Fun Trading)
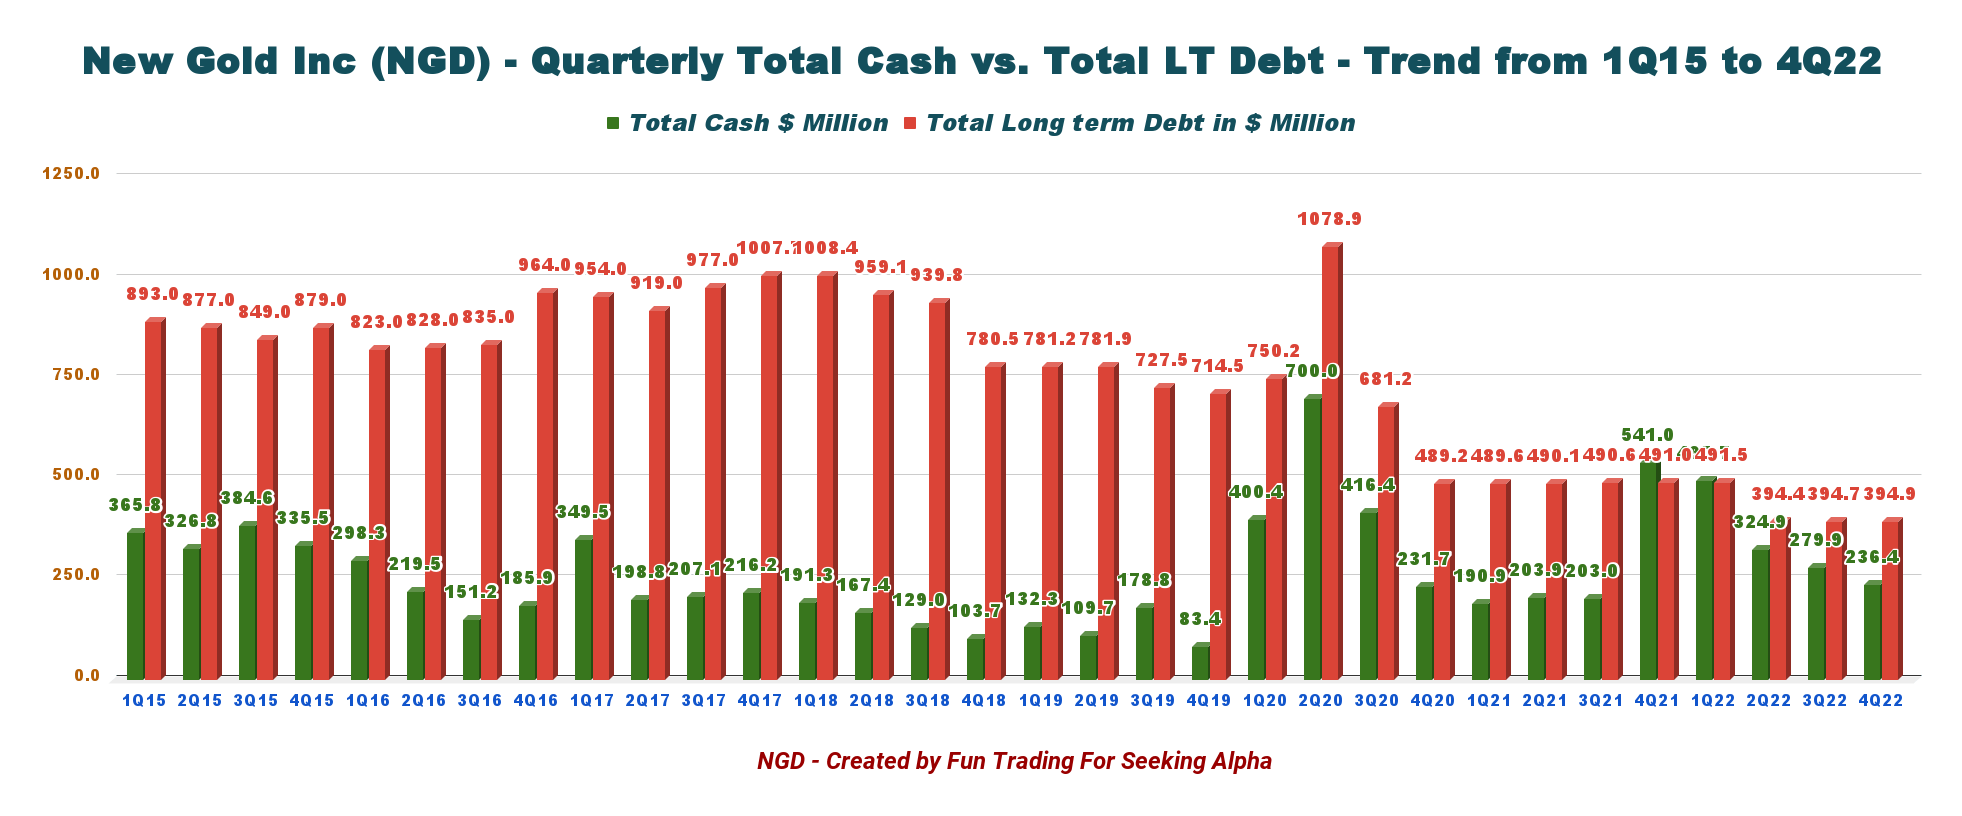
New Gold's net debt was $158.5 million this quarter. As of December 31, 2022, the debt was $394.9 million, and the total cash was $236.4 million.
The total liquidity position was $597 million at the end of December 2022, including the recent sale of Artemis on January 16, 2023, for approximately $23 million (evaluated at $24 million in Q4, a bit higher than it was sold). The company still owns Talisker Resources Ltd. and other marketable securities.
NGD Balance sheet 4Q22 (NGD Presentation)
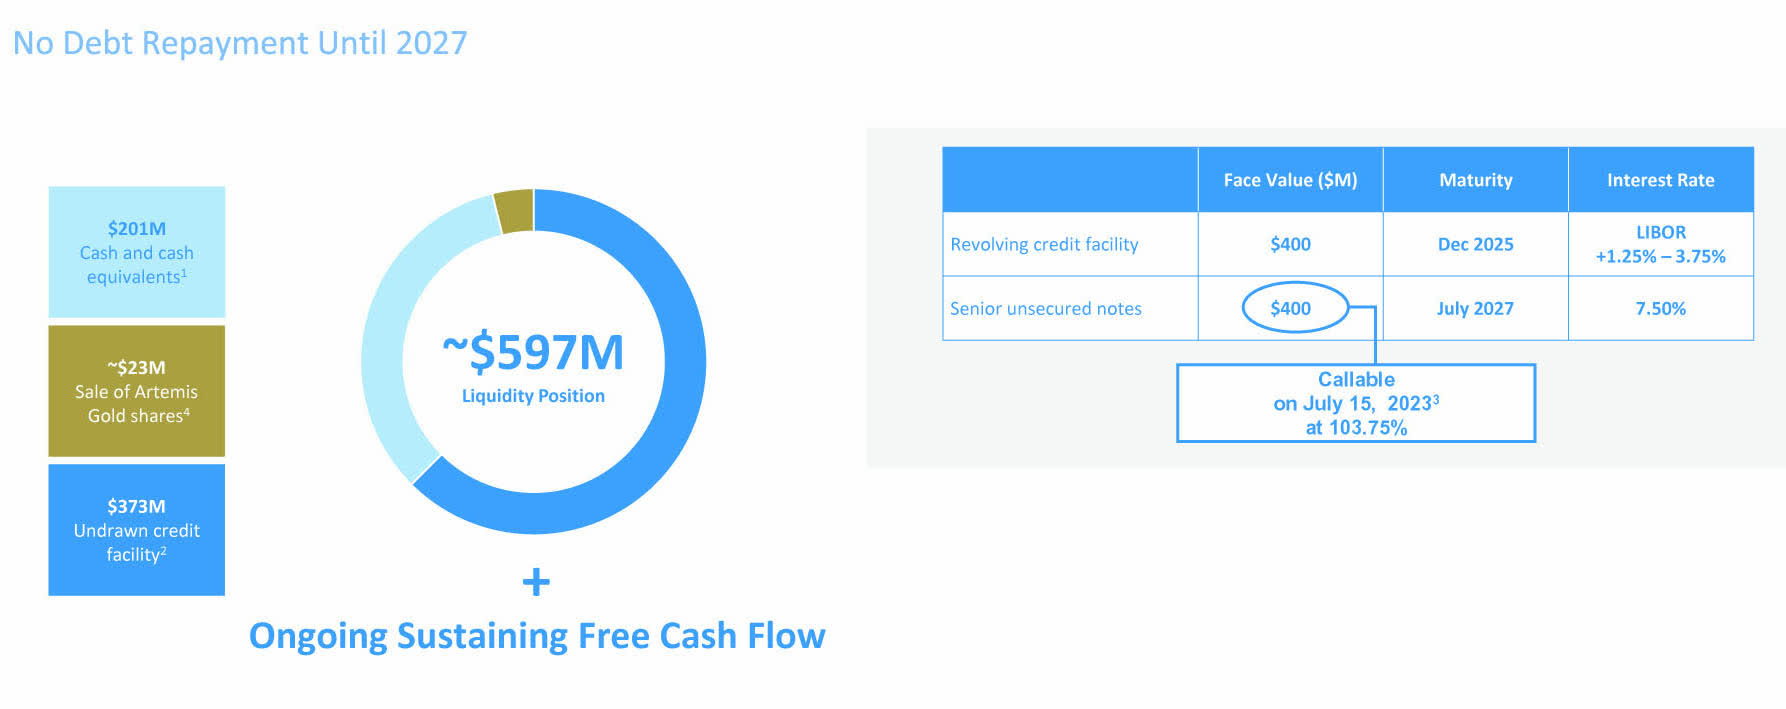
Technical Analysis And Commentary
NGD TA Chart short-term (Fun Trading StockCharts)
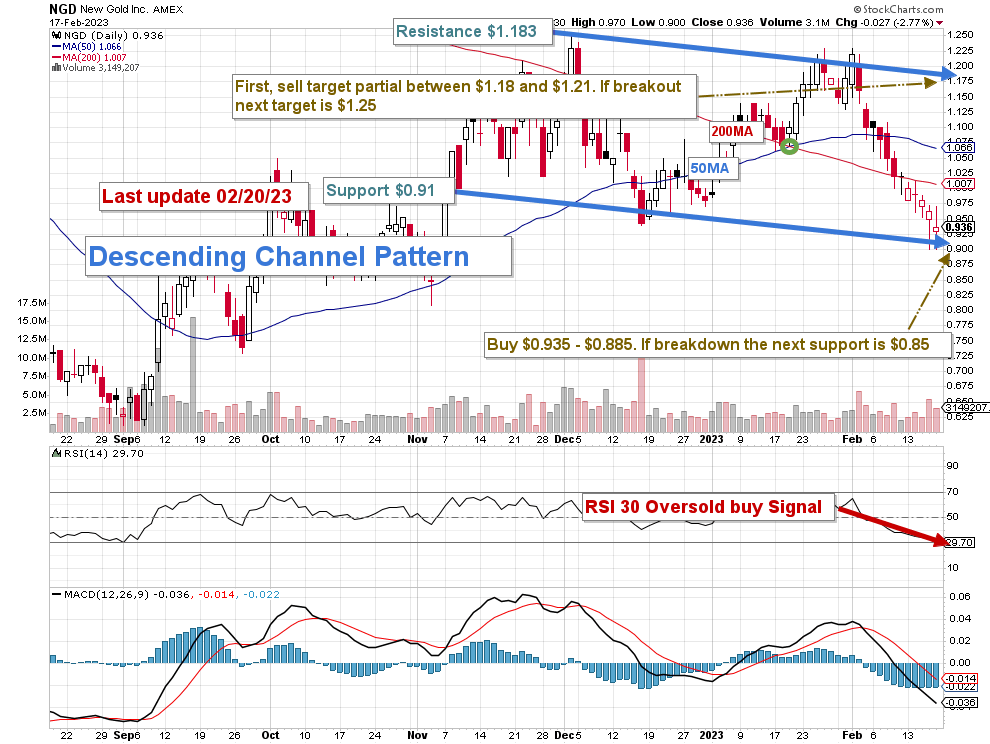
Note: the numbers below are in US dollars.
NGD forms a descending channel pattern with resistance at $1.183 and support at $0.91.
The overall strategy that I promote in my marketplace, "The Gold And Oil Corner," is to keep a core long-term position and use about 60-70% to trade LIFO while waiting for a higher price target for your core long position between $1.25 and $1.50.
I suggest selling about 50% of your position between $1.183 and $1.09 (50MA) and accumulating between $0.935 and $0.885 with possible lower support at $0.85.
The gold price has recently recovered well above $1,900 per ounce after the market felt the FED was about to turn more dovish in 2023.
Unfortunately, the recent CPI numbers and job market were not as favorable as expected, and the market turned quickly bearish last week, fearing more rates increase and a possible recession in 2023.
The result is that gold dropped as low as $1,818 on Friday to finally close at $1,842, completing a week on a slightly better note. However, despite this last-minute upside, the gold miners sold off on Friday, especially NGD, which dropped significantly.
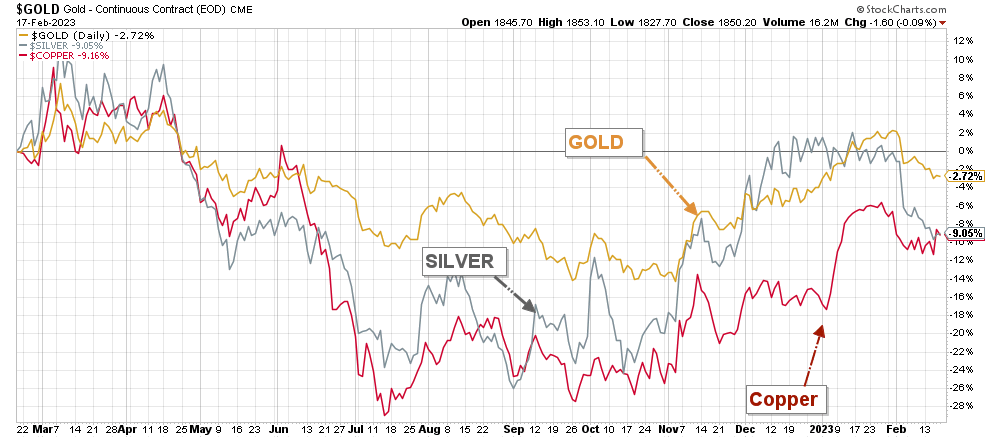
NGD Gold, Silver, and Copper 1-Year (Fun Trading Stockcharts)
Watch gold and silver prices like a hawk.
Warning: The TA chart must be updated frequently to be relevant. It is what I am doing in my stock tracker. The chart above has a possible validity of about a week. Remember, the TA chart is a tool only to help you adopt the right strategy. It is not a way to foresee the future. No one and nothing can.
Author's note: If you find value in this article and would like to encourage such continued efforts, please click the "Like" button below as a vote of support. Thanks.
For further details see:
New Gold: 2023 Guidance Offers A Sliver Of Hope