NGD - New Gold: A Better Outlook For 2024 But Mark Your Entry And Exit Prices
2023-12-06 07:26:30 ET
Summary
- New Gold Inc. released its third quarter 2023 results, showing an increase in revenue and production of gold equivalent ounces.
- The Rainy River and New Afton mines have experienced technical setbacks in the past, posing a risk to investors.
- I recommend buying NGD between $1.34 and $1.28, with a lower support level, possibly at $1.19.
Introduction
On October 26, 2023, Canada-based New Gold Inc. (NGD) released its third quarter 2023 results ending September 30, 2023. This article updates my article published on October 6, 2023. I have regularly followed NGD on Seeking Alpha on Seeking Alpha since 2019.
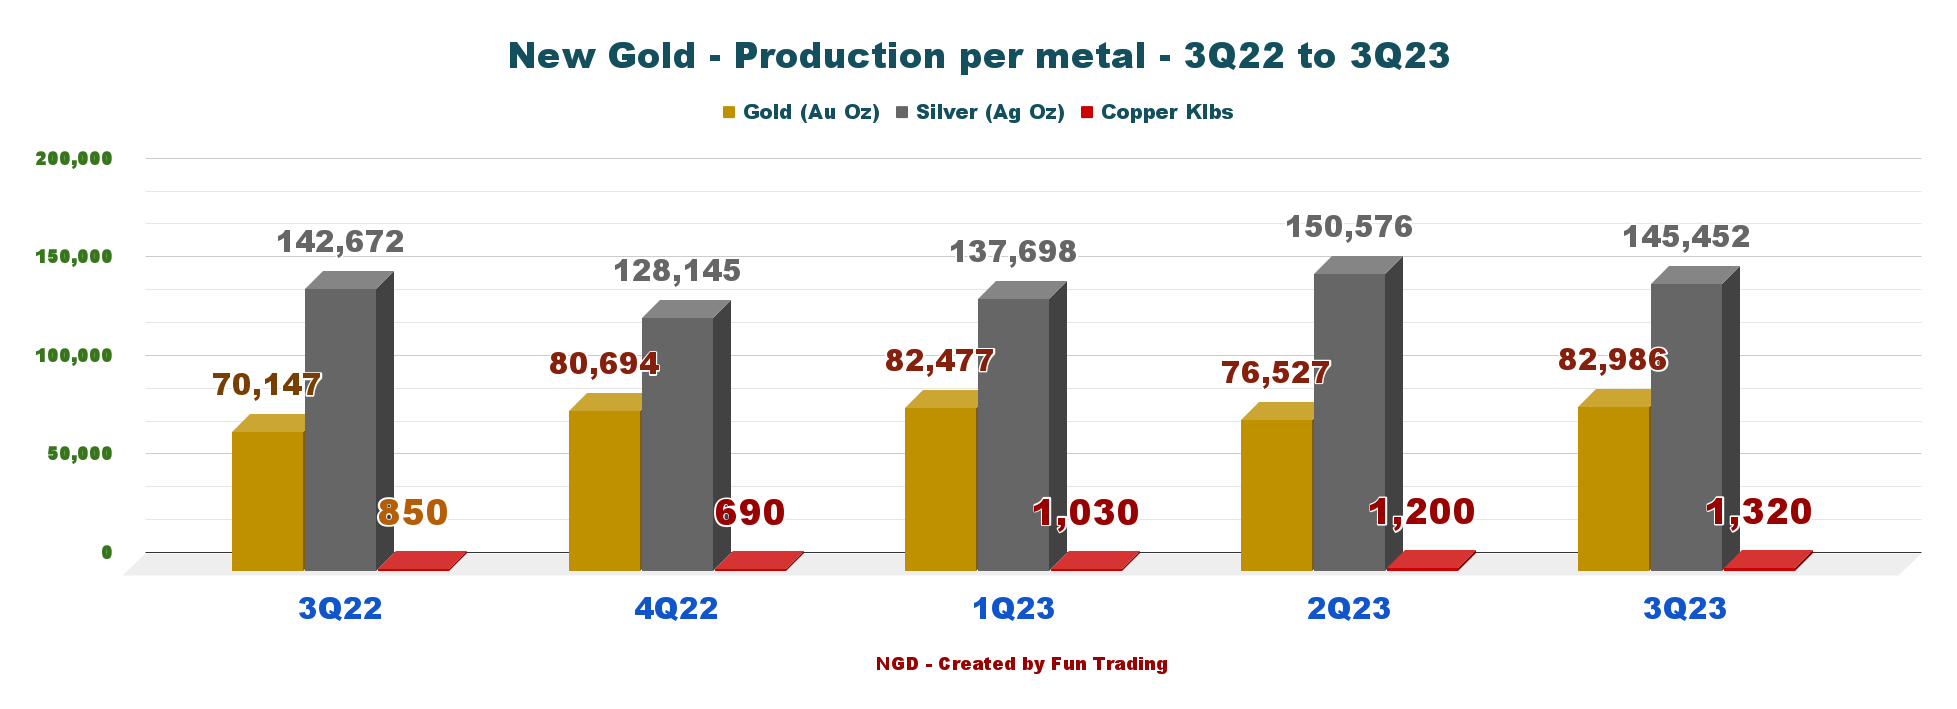
The Rainy River and the New Afton are the only two of New Gold's fully-owned mines, from which the small miner produces gold, silver, and copper with a large majority of gold. As shown below:
NGD Quarterly Production per Metal 3Q22 versus 3Q23 (Fun Trading)
Those two mines have regularly encountered technical setbacks and are likely to do so in the future. This limited assets portfolio presents a major risk to investors that should be factored imperatively into your investment strategy.
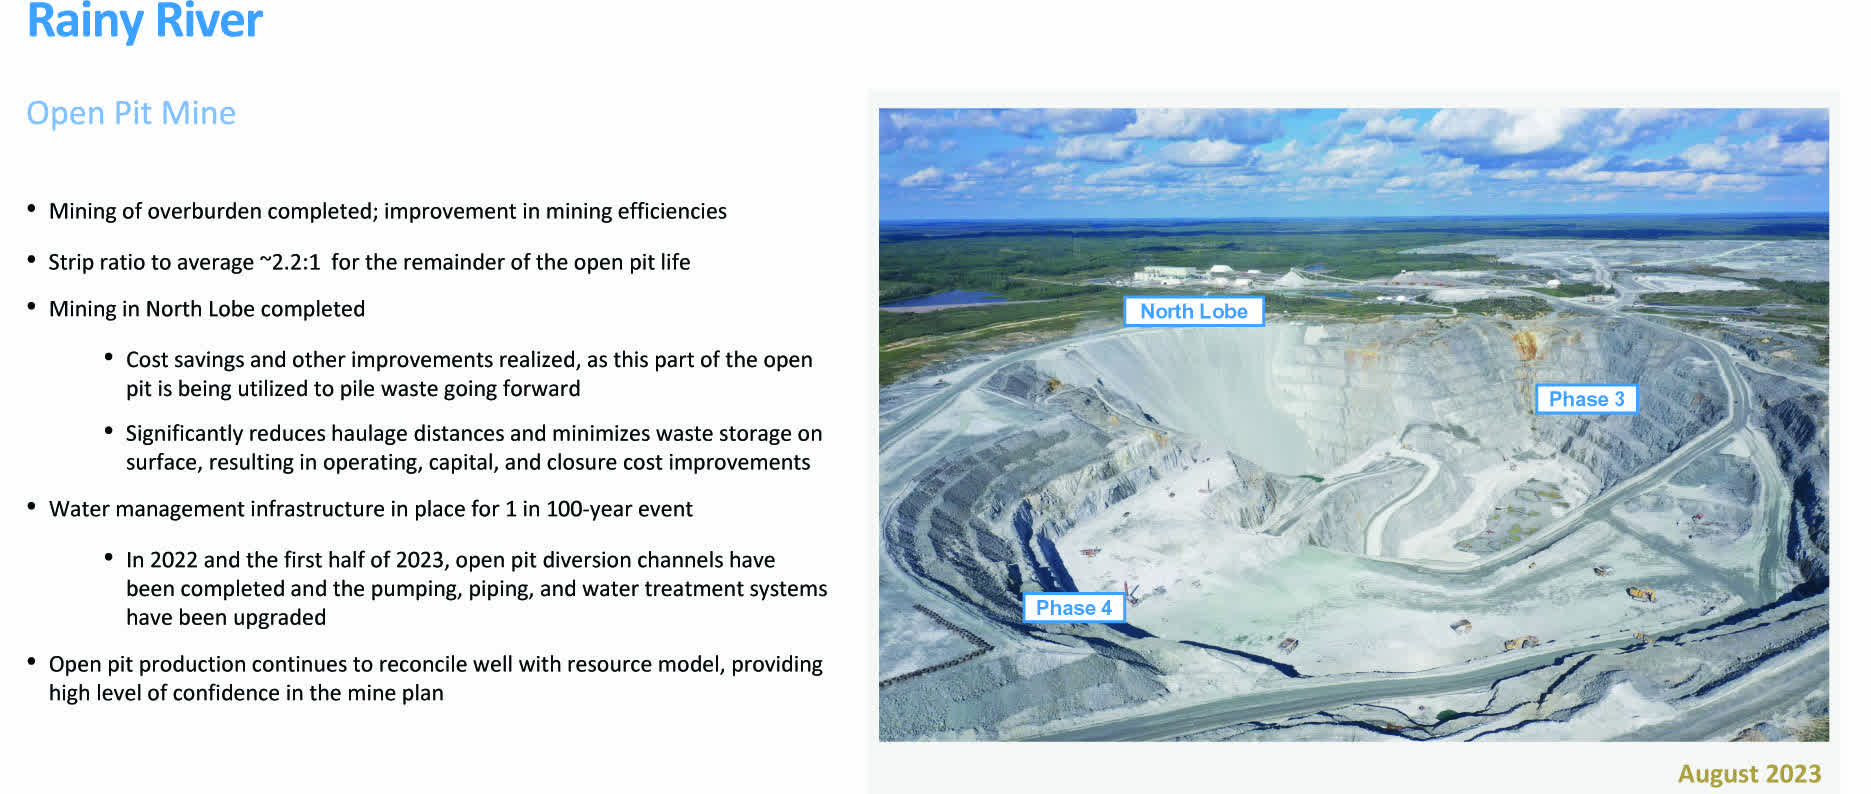
The Rainy River is an open pit and underground mine that has been producing gold and silver since 2017. It is located in Fort Frances, NorthWestern, Ontario, Canada.
The mine was affected by 14-day voluntary suspended operations due to COVID-19 on March 20, 2020, and also suffered heavy rainfall and flooding on September 15, 2022.
Rainy River is gradually transitioning from open-pit mining to underground operations, with the addition of an access ramp to reach two gold zones (e.g., the Intrepid underground zone...).
NGD Rainy River (NGD Presentation)
COO Yohann Bouchard said in the conference call:
Through operational discipline, the operation is hovering on expectations and achieving a stable and reliable production quarter-over-quarter. The operation is well positioned to continue this trend into 2024.
The open pit costs are expected to reduce significantly or after 2024 with the completion of the waste tripping, while speed grade our plan to increase as underground production ramp up to supplement high grade from the pit.
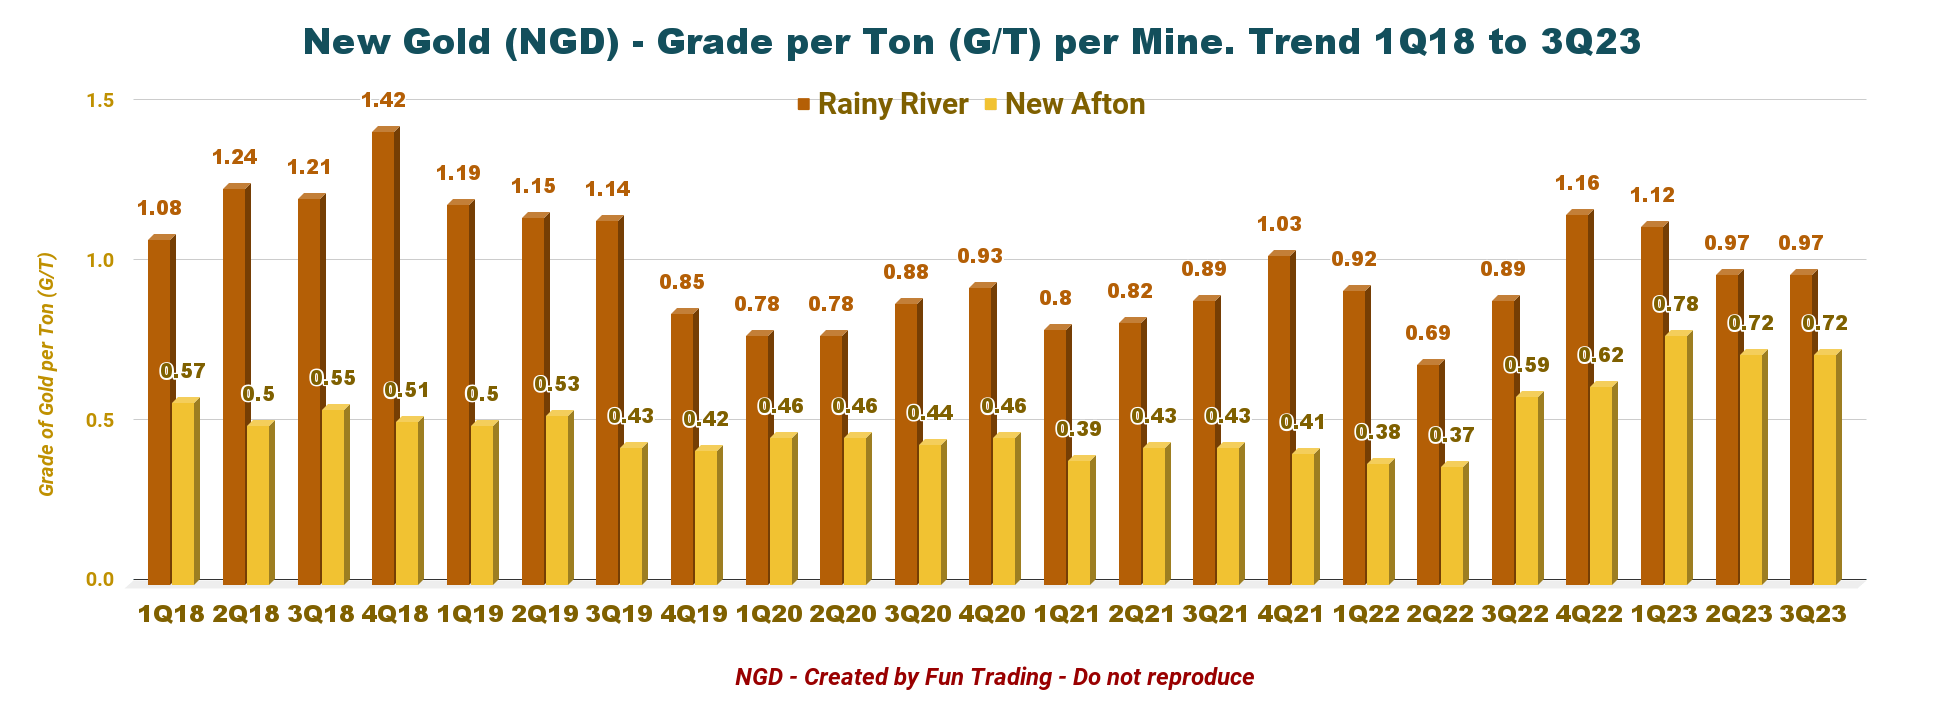
The gold grade is now improving and is up 8.9% YoY, albeit still under 1 gr/Ton. The company said that it expects an increase in underground production in the second half of 2024.
NGD Quarterly Grade per Ton per Mine History (Fun Trading)
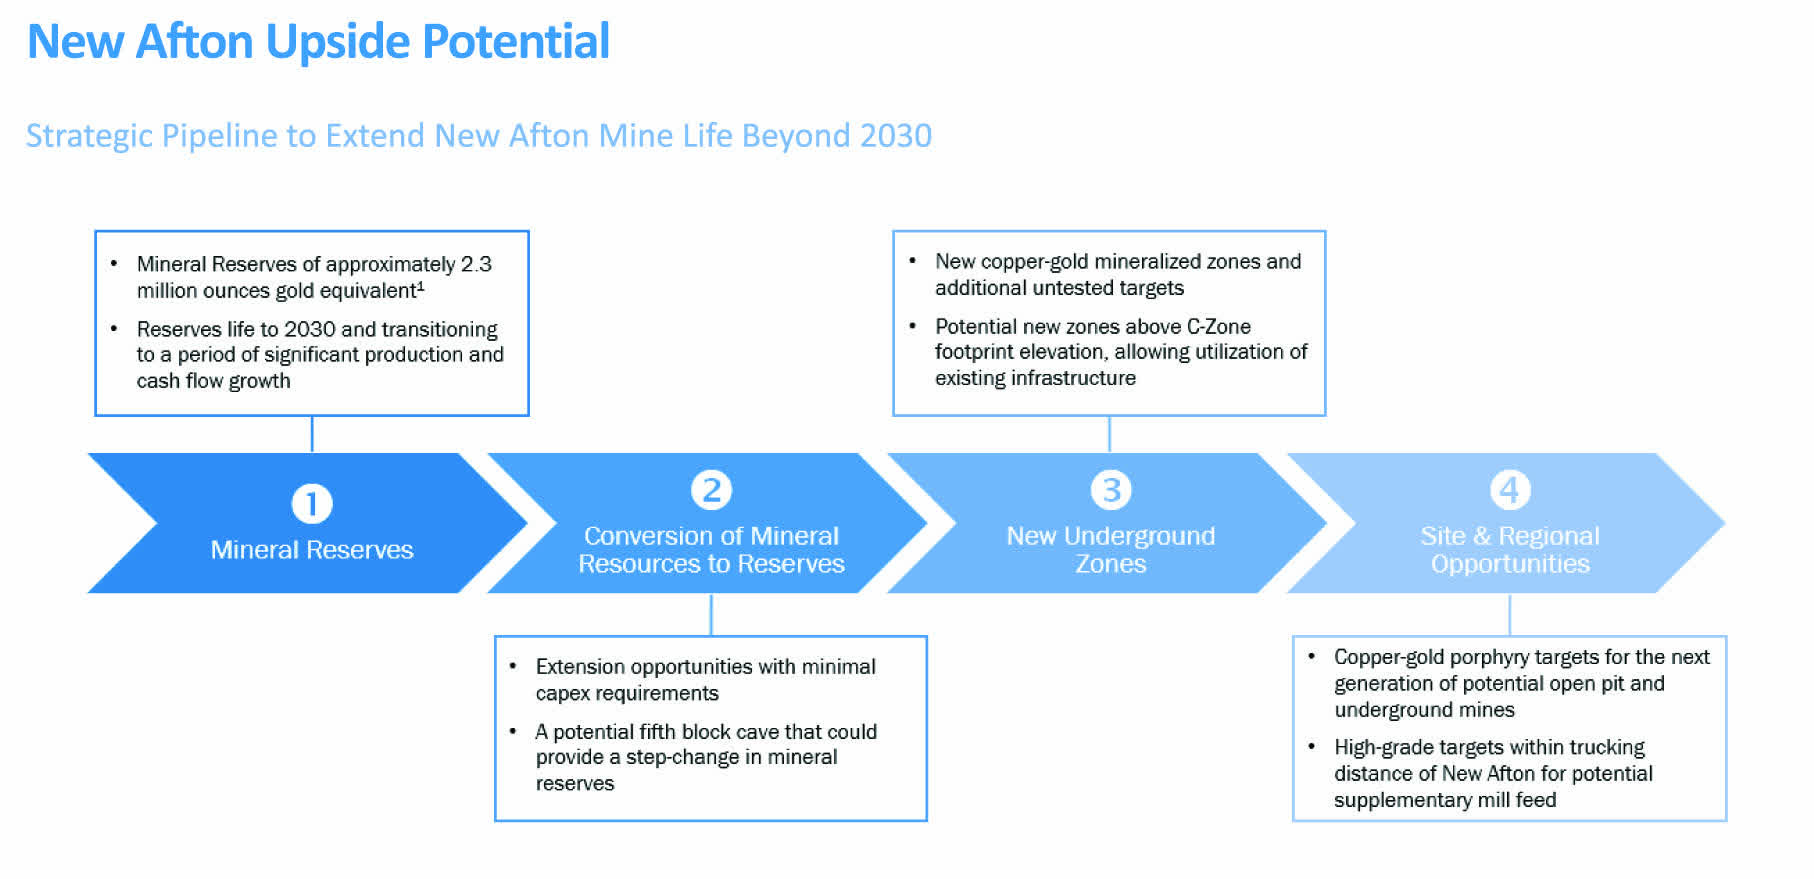
The New Afton mine has been more problematic, with an issue that has significantly affected the stock price. The share fell abruptly on August 10, 2023. It kept declining even though doubts about the structural integrity of the mine tailings storage facility were quickly fixed. This unfortunate blip contrasted with the excellent mine performance in 2023. The company indicated new underground gold and copper mineralization extending the LOM beyond 2030.
NGD New Afton (NGD Presentation)
COO Yohann Bouchard said in the conference call:
The operation had an excellent third quarter achieving the highest quarterly production since 2021, mostly as a result of B3K [ph] continuing to exceed planned extraction rates. The exceptional performance over the first nine months puts New Afton in an excellent position to achieve the top end of 2023 production guidance and a bottom end of the cost guidance.
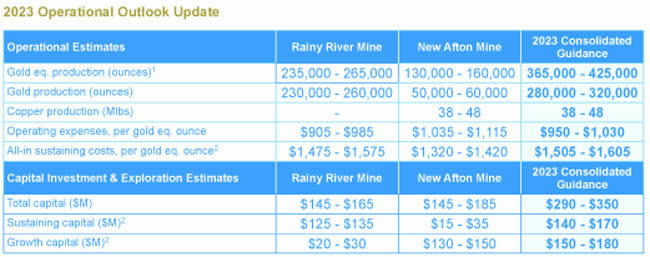
Another positive is that the company expects to track the top end of consolidated production guidance and the low end of all-in-sustaining cost guidance.
NGD 2023 Outlook (NGD Press Release)
Since October, the positive environment supporting the price of gold has helped NGD recover nicely. Both stocks are up slightly YoY.
As shown in the chart below compared to IAMGOLD:
Even if NGD's output during the third quarter showed some encouraging results, those persistent technical problems have seriously impacted the stock price, so I view the company as a risky and unpredictable gold miner.
With a single noteworthy difference pertaining to the company's nearly completed Coté Gold project, I consider New Gold to be very similar to IAMGOLD, at least in how we should invest and trade.
Thus, while long-term investing could be considered, you must also follow a short-term LIFO strategy to make your NGD investment profitable and, most importantly, less risky. The latest events indicated above are a helpful reminder. I suggest holding a core long-term position for a potential breakthrough while trading 60% of your overall holding.
1 - Third-quarter results and commentary
1.1 - Balance Sheet
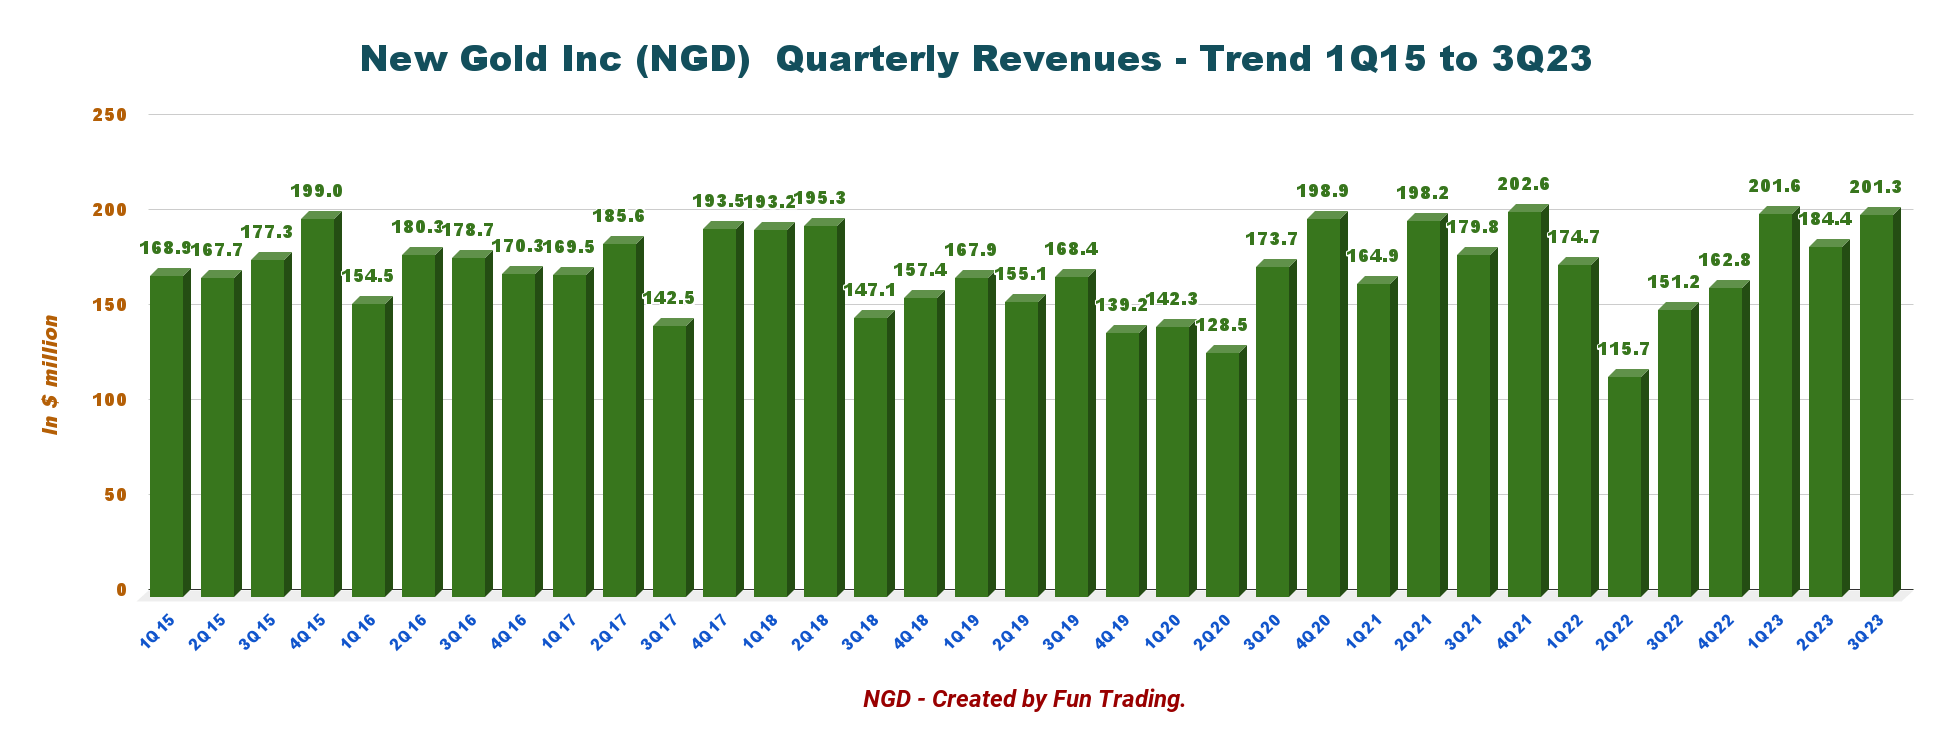
Revenue for the third quarter was $201.3 million , a considerable increase from $151.2 million in 3Q22. Production of gold equivalent and realized gold price increased by 22.2% and 11.4%, respectively. Operating expenses rose to $107.5 million this quarter, up from $99.2 million in 3Q22.
It was a good quarter, beating expectations with adjusted earnings of $23.1 million or $0.03 per share.
NGD Quarterly Revenue History (Fun Trading)
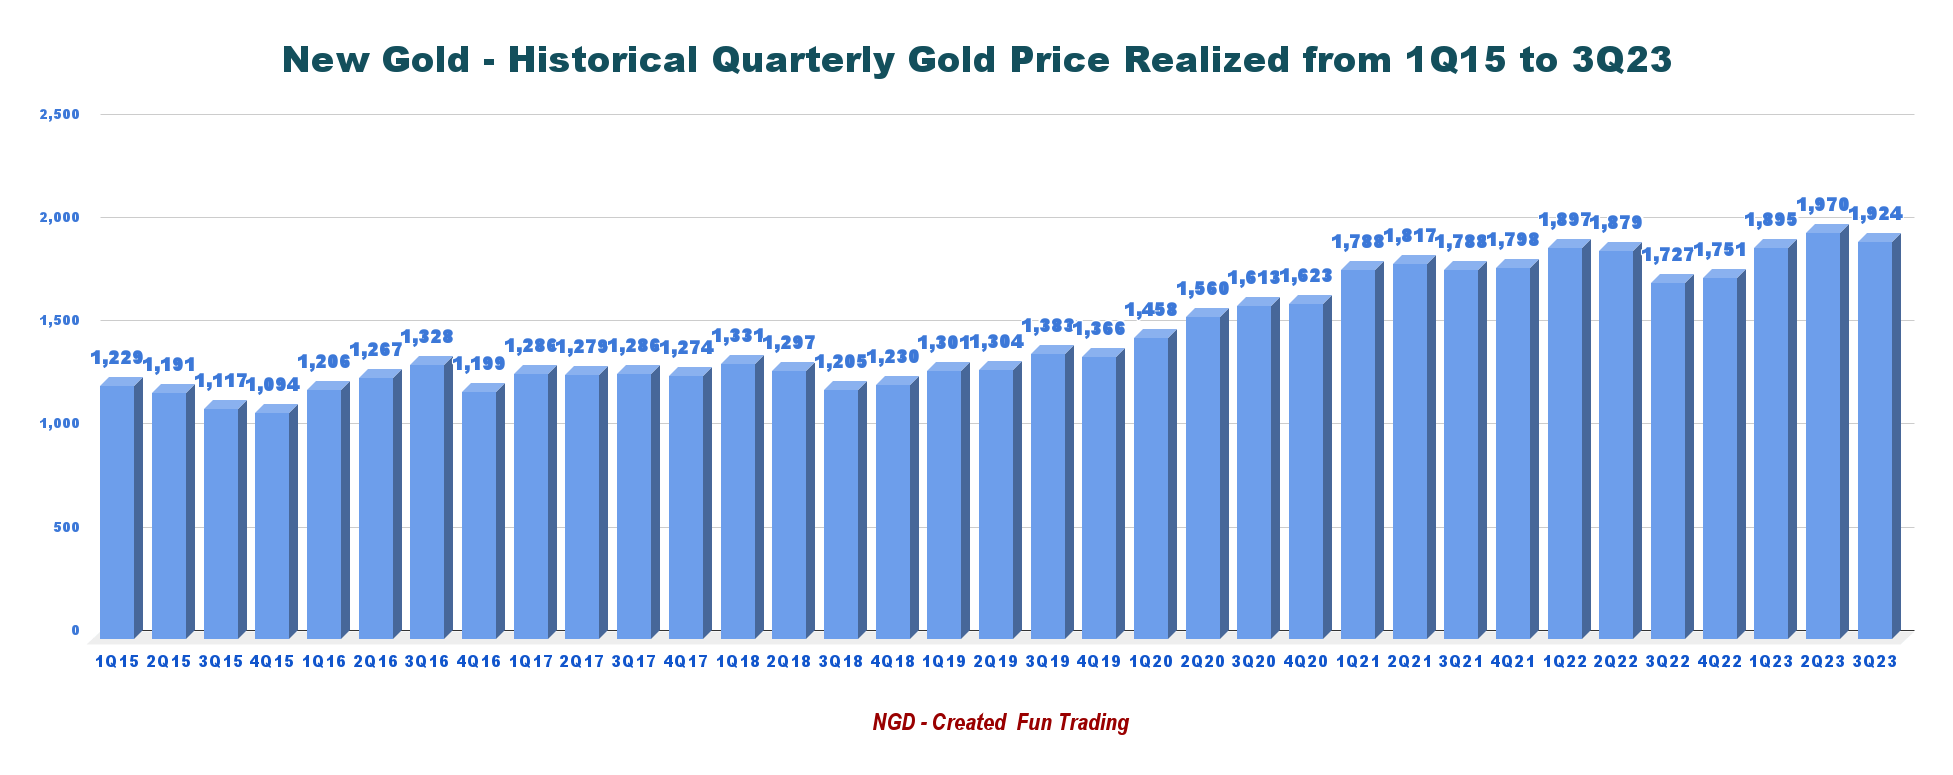
The gold price reached $1,924 per ounce in 3Q23, up significantly from $1,727 in 3Q22.
NGD Quarterly Gold Price History (Fun Trading)
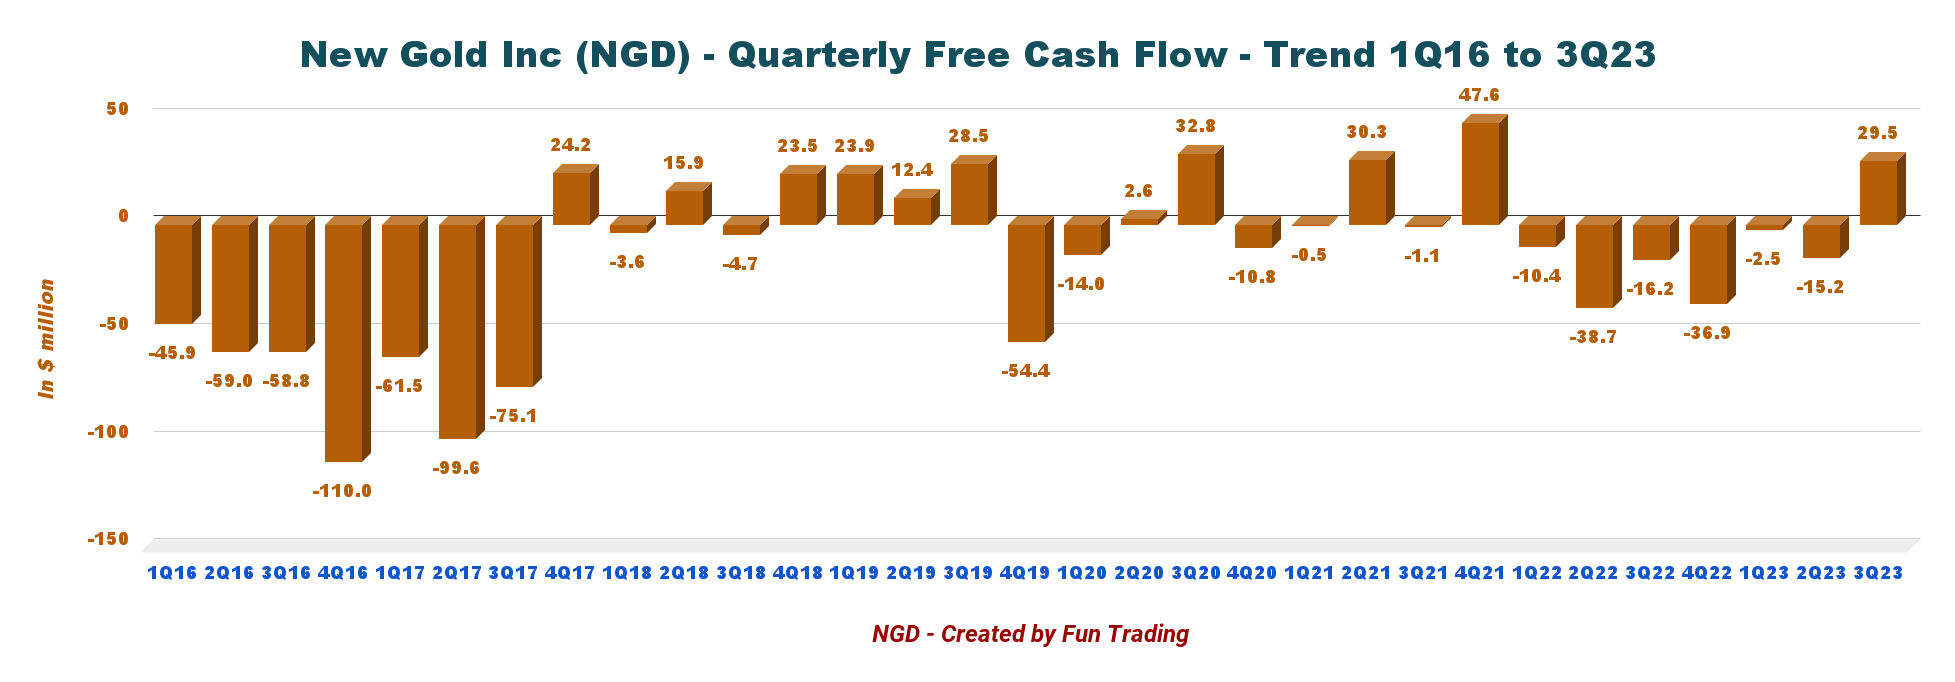
I was pleased with the cash flow from operations, reaching $100.1 million in 3Q23, whereas CapEx was $70.6 million , nearly unchanged year over year. This quarter, free cash flow was finally on the plus side, with $29.5 million and a trailing 12-month negative free cash flow of $25.1 million.
NGD Quarterly Free Cash Flow History (Fun Trading)
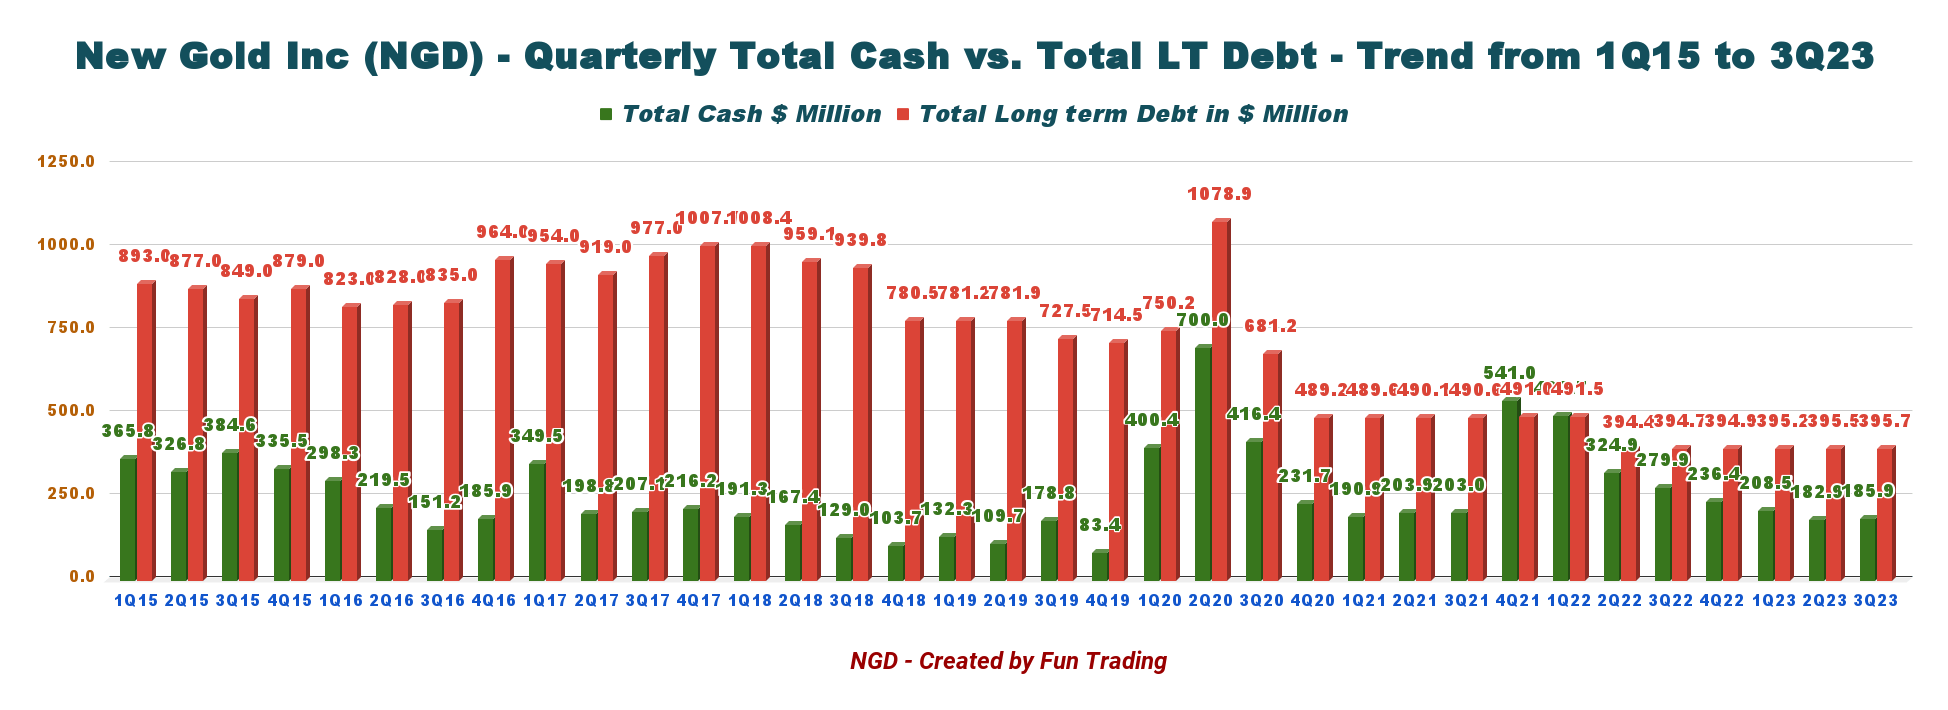
On the debt front, the company has a total debt of $395.7 million and a total cash of $185.9 million. The debt has been very stable since 3Q22, but the cash and cash equivalent/marketable securities were down to $185.9 million from $279.9 million in 3Q22.
NGD Cash versus Debt history (Fun Trading)
2.2 - Gold Equivalent Production Analysis
This segment has already been covered in my preceding article. However, more information has been updated regarding the price of gold and copper and the AISC for gold.
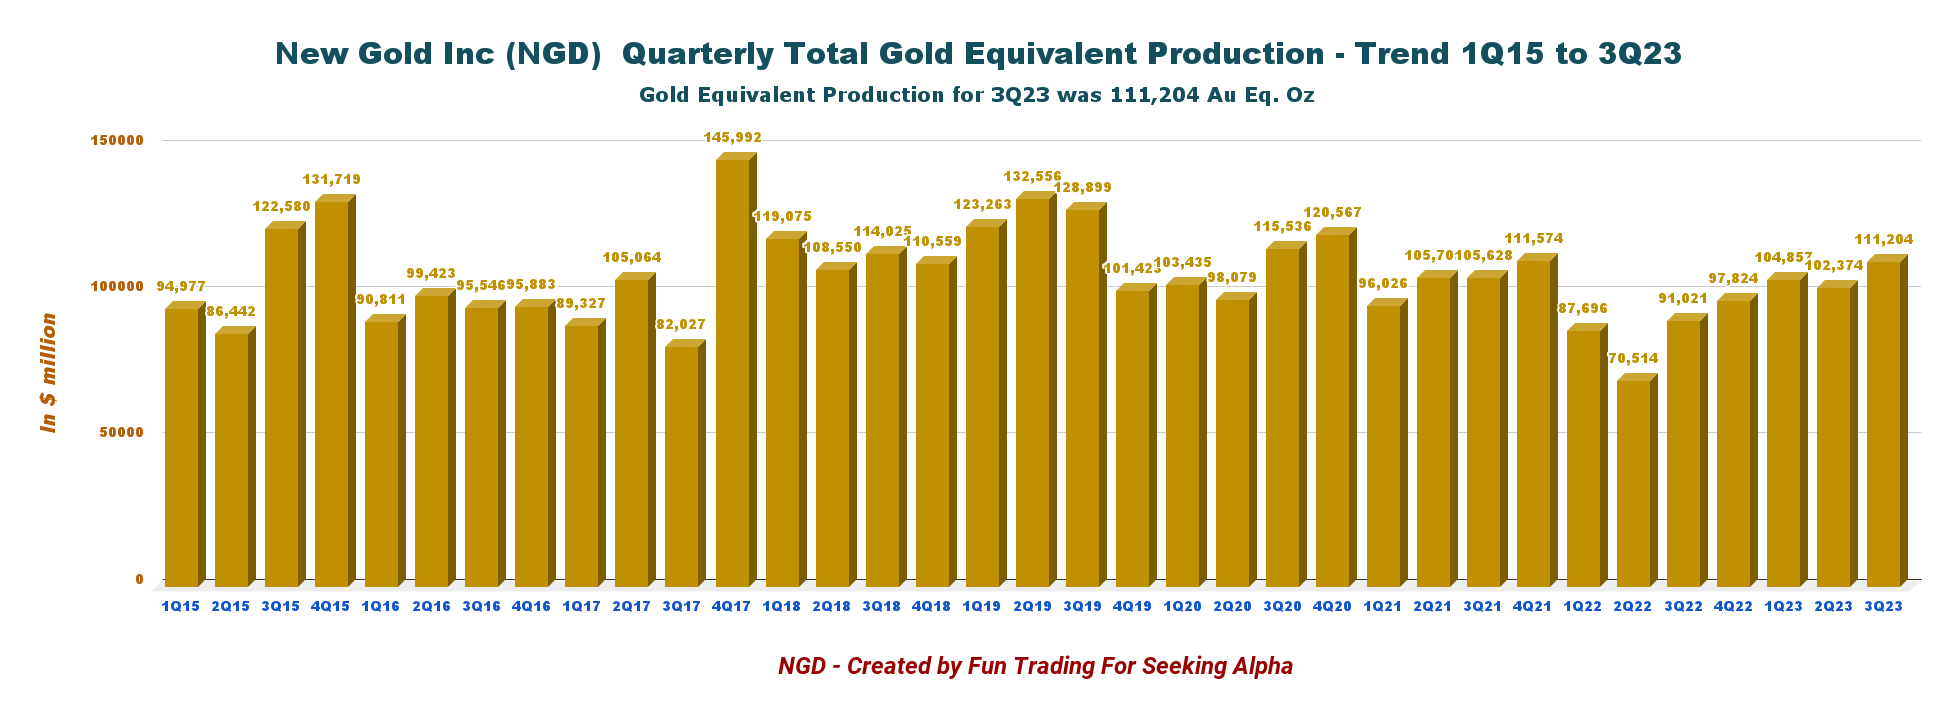
Gold equivalent production was strong this quarter, with 111,204 GEOs produced, up 22.2% from the 91,021 GEOs produced in the third quarter of 2022. The Production per GEO grew by 8.6% sequentially.
NGD Quarterly GEO Production history (Fun Trading)
Copper, silver, and gold are all produced in terms of gold equivalent ounces, or GEO.
Here are the specifics for 3Q23 from my earlier article:
Gold production: 82,986 Au oz, Sold 79,821 Au Oz
Silver production: 145,452 Ag oz, Sold 139,591 Ag Oz
Copper production: 13.2 M Pounds, Sold 13.0 M Pounds.
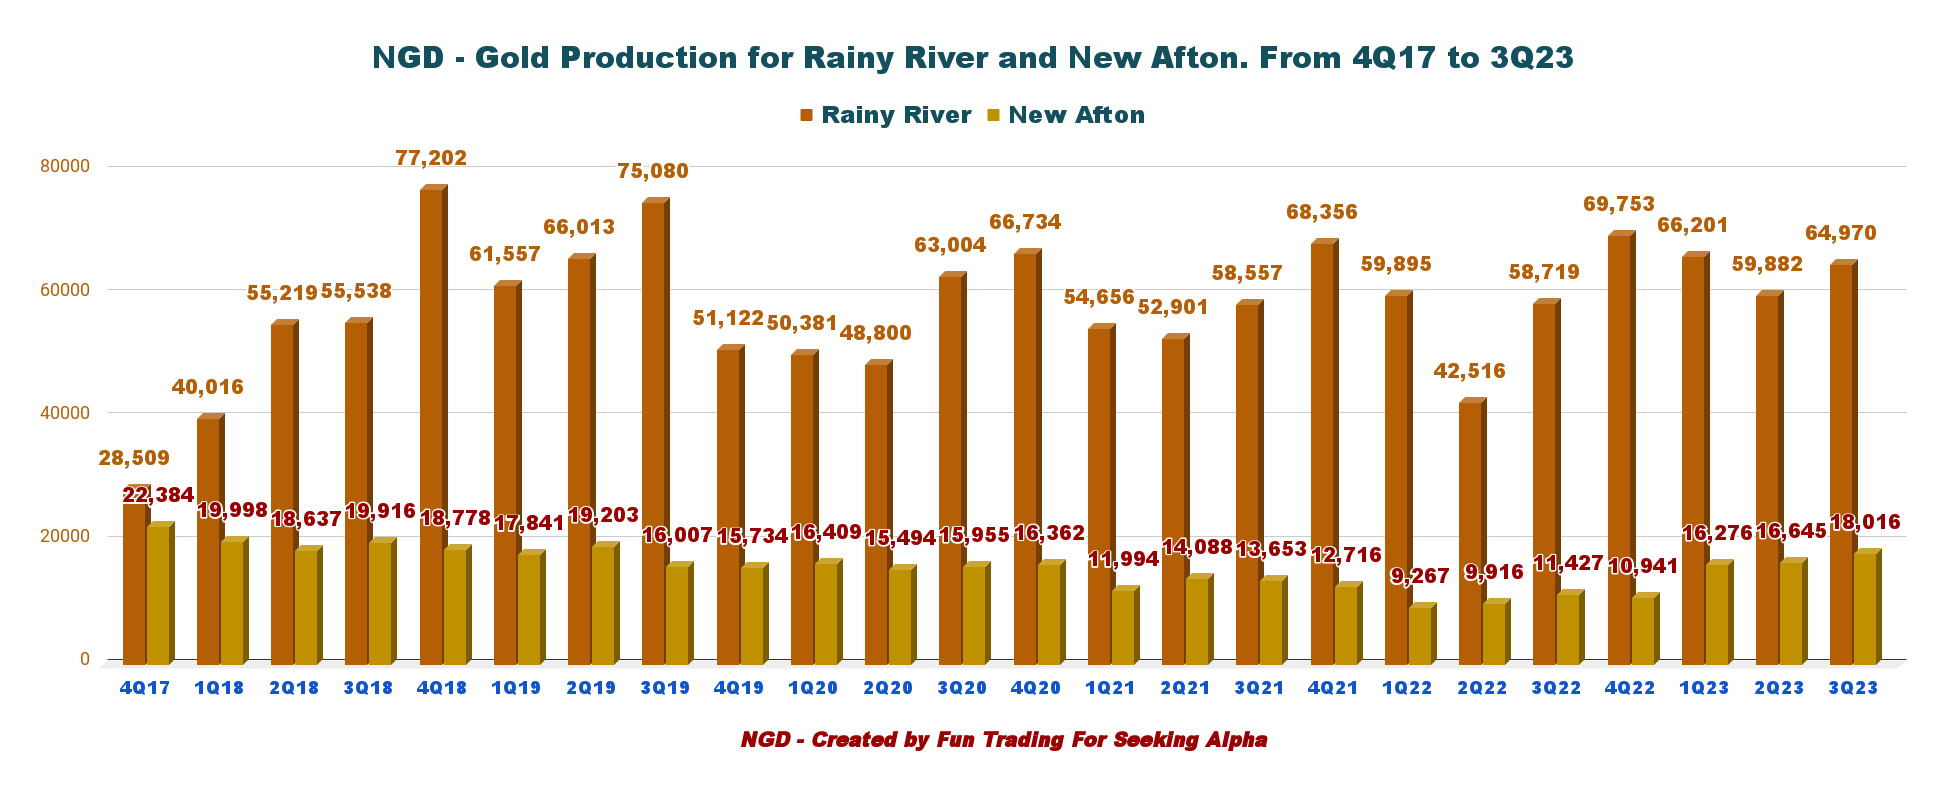
In my preceding article, I said that gold production for the Rainy River mine was 64,970 Au ounces and 18,016 Au ounces for the New Afton mine.
NGD Quarterly Gold Production per Mine History (Fun Trading)
At New Afton, gold, silver, and copper production improved nicely over the same period last year, as the operation's focus remained on steady-state mining of B3 and C-Zone development, which remains on track for first ore production in 4Q23. Tonnes mined per day (ore and waste) was 9,790 TPD. NGD indicated that it successfully blasted the first draw bell from C-Zone, an important milestone in delivering significant production growth in the coming years. The mine exceeded outlook as mining from B3 continues to perform above expectations.
At Rainy River, production was in line with the plan. The company indicated that it continues to advance the connection ramp to the underground Main Zone from called Intrepid.
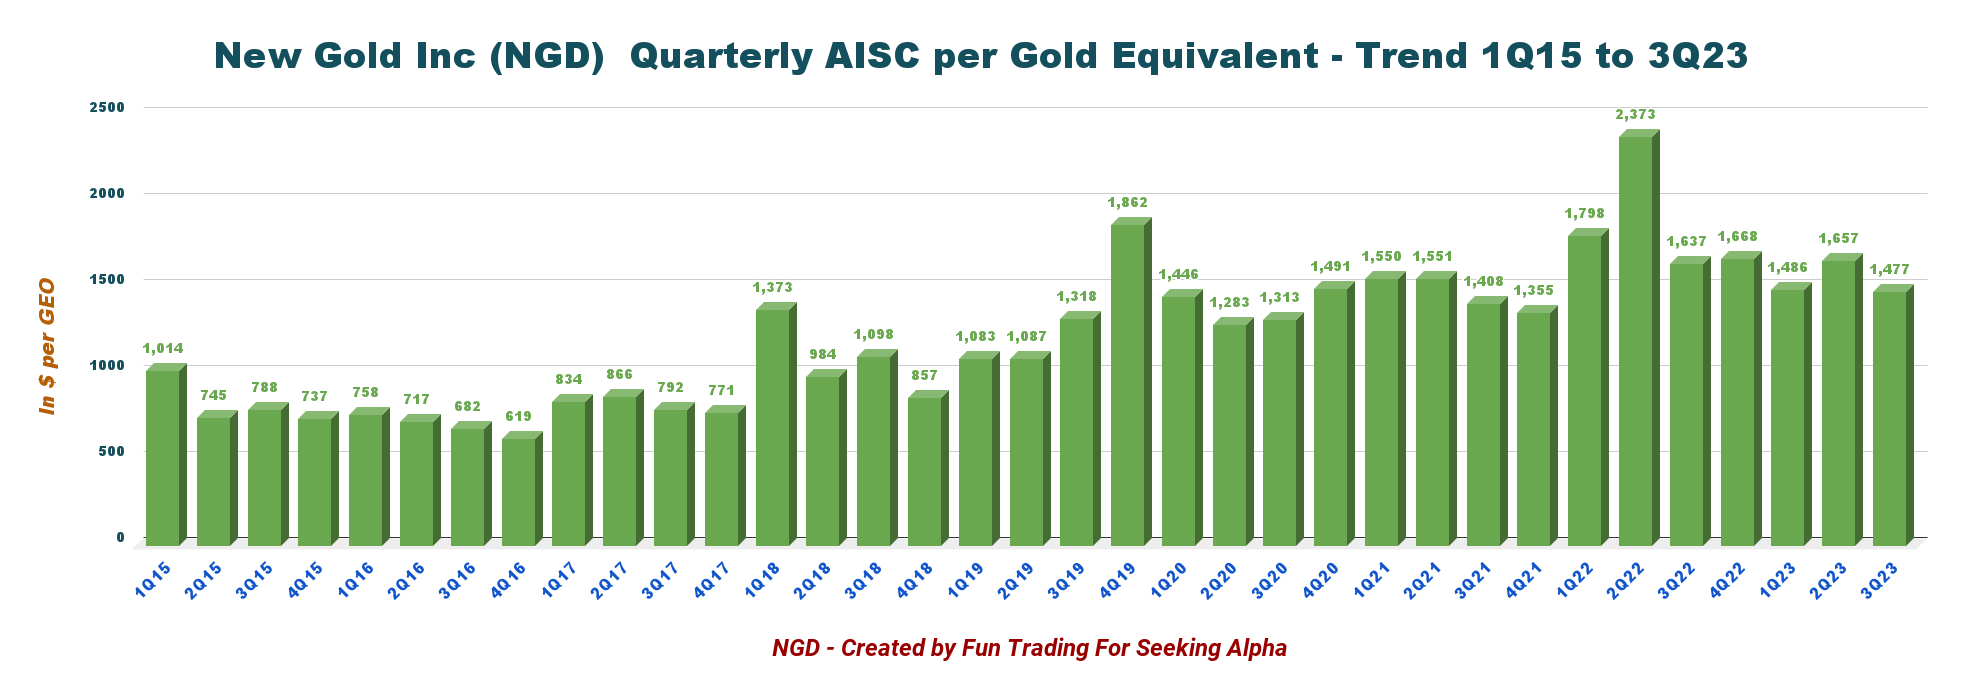
The AISC for gold decreased significantly from $1,637 per ounce in 3Q22 to $1,477 per ounce in 3Q23. It was mainly due to higher production. AISC is still high compared to the industry average of about $1,225 per ounce.
NGD Quarterly AISC History (Fun Trading)
Technical analysis and commentary
NGD TA Chart (Fun Trading StockCharts)
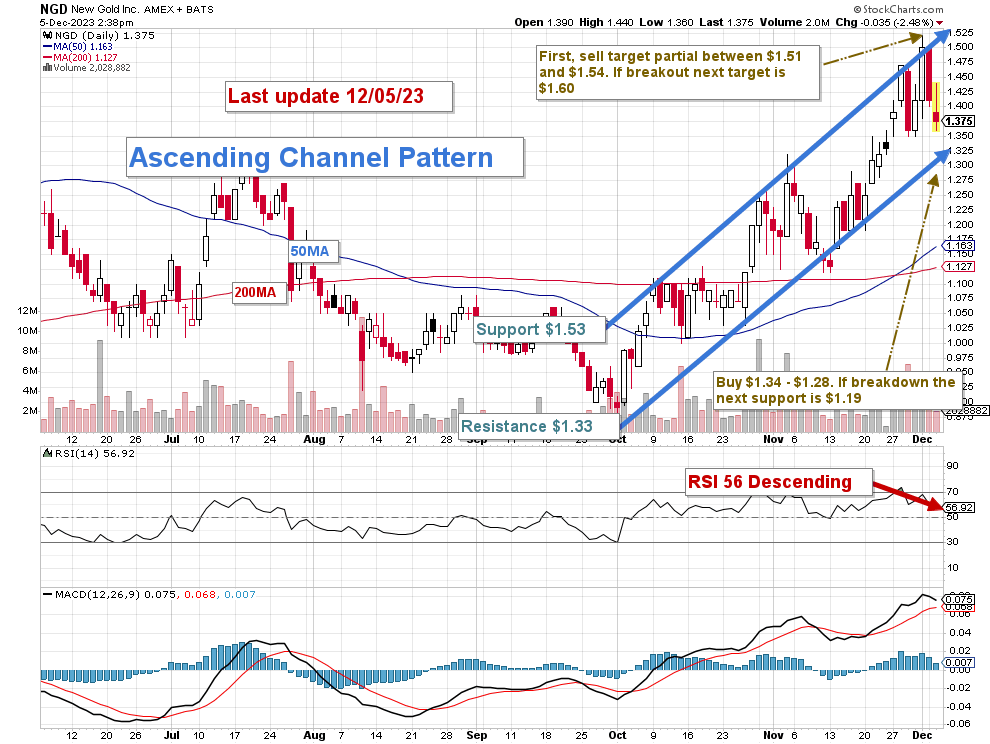
NGD forms an ascending channel pattern with resistance at $1.53 and support at $1.33 . RSI is now 56, which indicates that NGD could eventually reach $1.30 on an extreme consolidation.
An ascending channel is a typical pattern with a succession of higher and lower highs. It suggests a positive outlook for the market and a steady, gradual price rise. It does, however, generally end with a consolidation phase.
I recommend trading LIFO about 60% of your position and keeping a medium core long-term for a better payday above $1.85-$2, potentially in 2024.
I suggest an accumulation between $1.34 and $1.28 , with a lower support level, possibly at $1.19 . On the other hand, given higher resistance above $1.60 , I advise starting taking profits between $1.51 and $1.54.
Warning: The TA chart must be updated frequently to be relevant. It is what I am doing in my stock tracker. The chart above has a possible validity of about a week. Remember, the TA chart is a tool only to help you adopt the right strategy. It is not a way to foresee the future. No one and nothing can.
For further details see:
New Gold: A Better Outlook For 2024 But Mark Your Entry And Exit Prices