NGD:CC - New Gold: A Solid Start In 2023
2023-05-01 10:47:04 ET
Summary
- New Gold Inc. revenues for the first quarter of 2023 increased significantly from $174.7 million in 1Q22 to $201.6 million.
- New Gold produced 104,857 GEOs during the first quarter of 2023, up 7.2% sequentially. New Gold sold 107,931 GEOs at $1,890 per GEO.
- I recommend accumulating New Gold between $1.25 and $1.22, with possible lower support at $1.15.
Part I - Introduction
Canada-based New Gold Inc. ( NGD ) released its First-quarter 2023 results on April 26, 2023.
Note: This article is an update of my article published on April 13, 2023. I have followed NGD on Seeking Alpha since January 2019.
Note: New Gold operates two mines: The Rainy River and the New Afton mines, with 2022 reserves of 3.3 Moz of gold, 607 Mlbs of Copper, and 8.2 Moz of silver. Reserves went down over 10% YoY.1 -
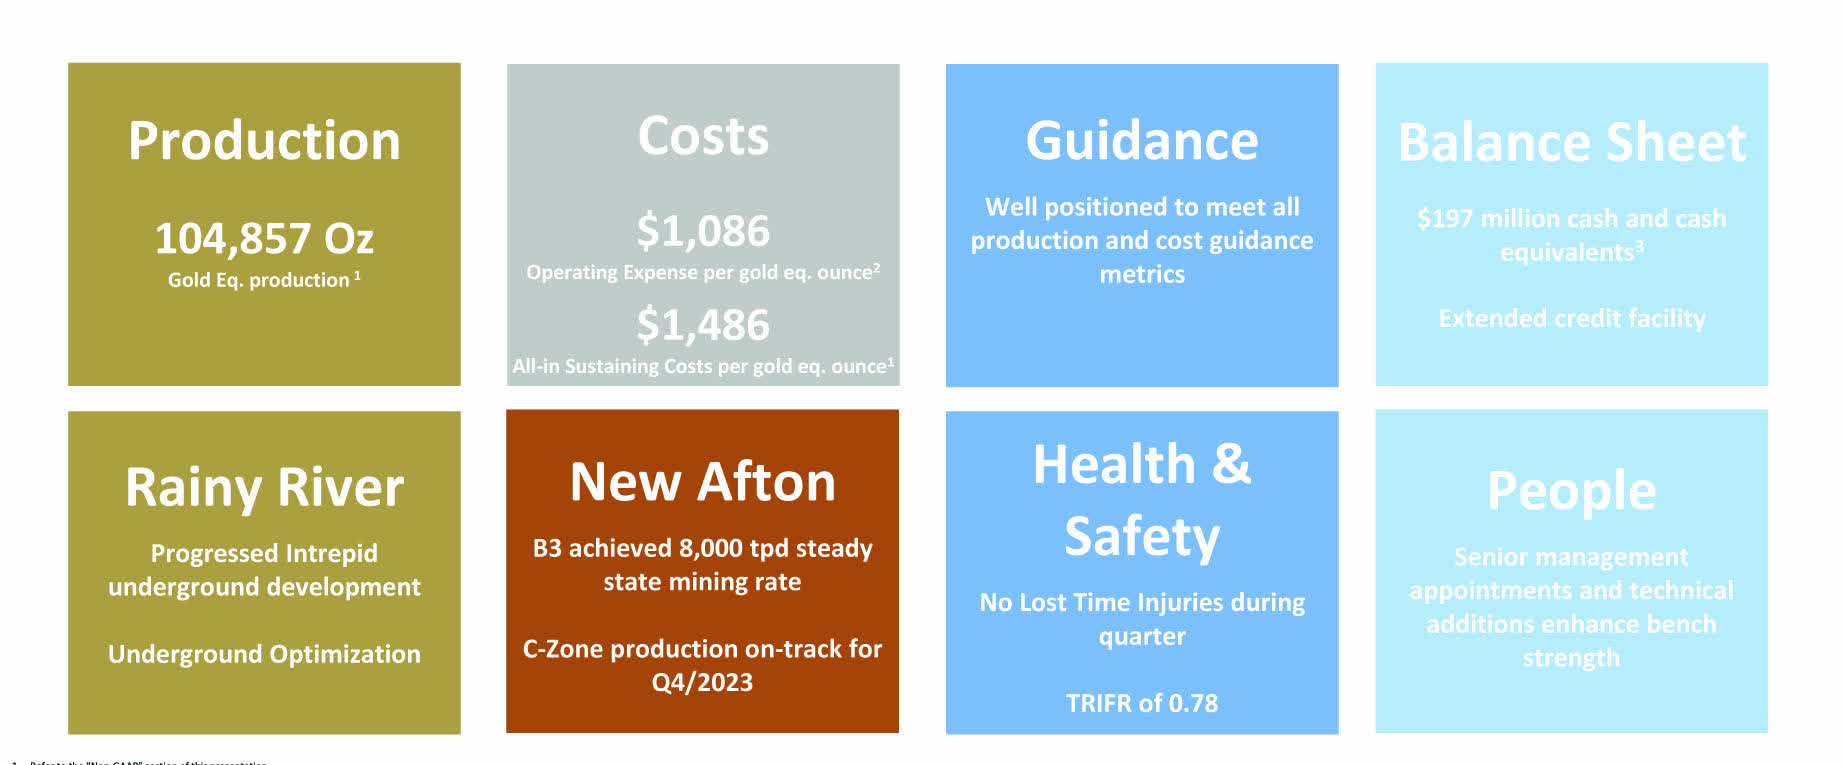
1Q23 Results highlights
NGD 1Q23 Highlights (NGD Presentation)
Revenues for the first quarter of 2023 increased significantly from $174.7 million in 1Q22 to $201.6 million.
The company said the revenue increased over the prior year due to higher gold and copper sales volume, partially offset by lower prices.
The company posted a net loss of $31.8 million compared to a loss of $7.8 million in 1Q22. Adjusted net income was $18.4 million from an income of $10.3 million in 1Q22.
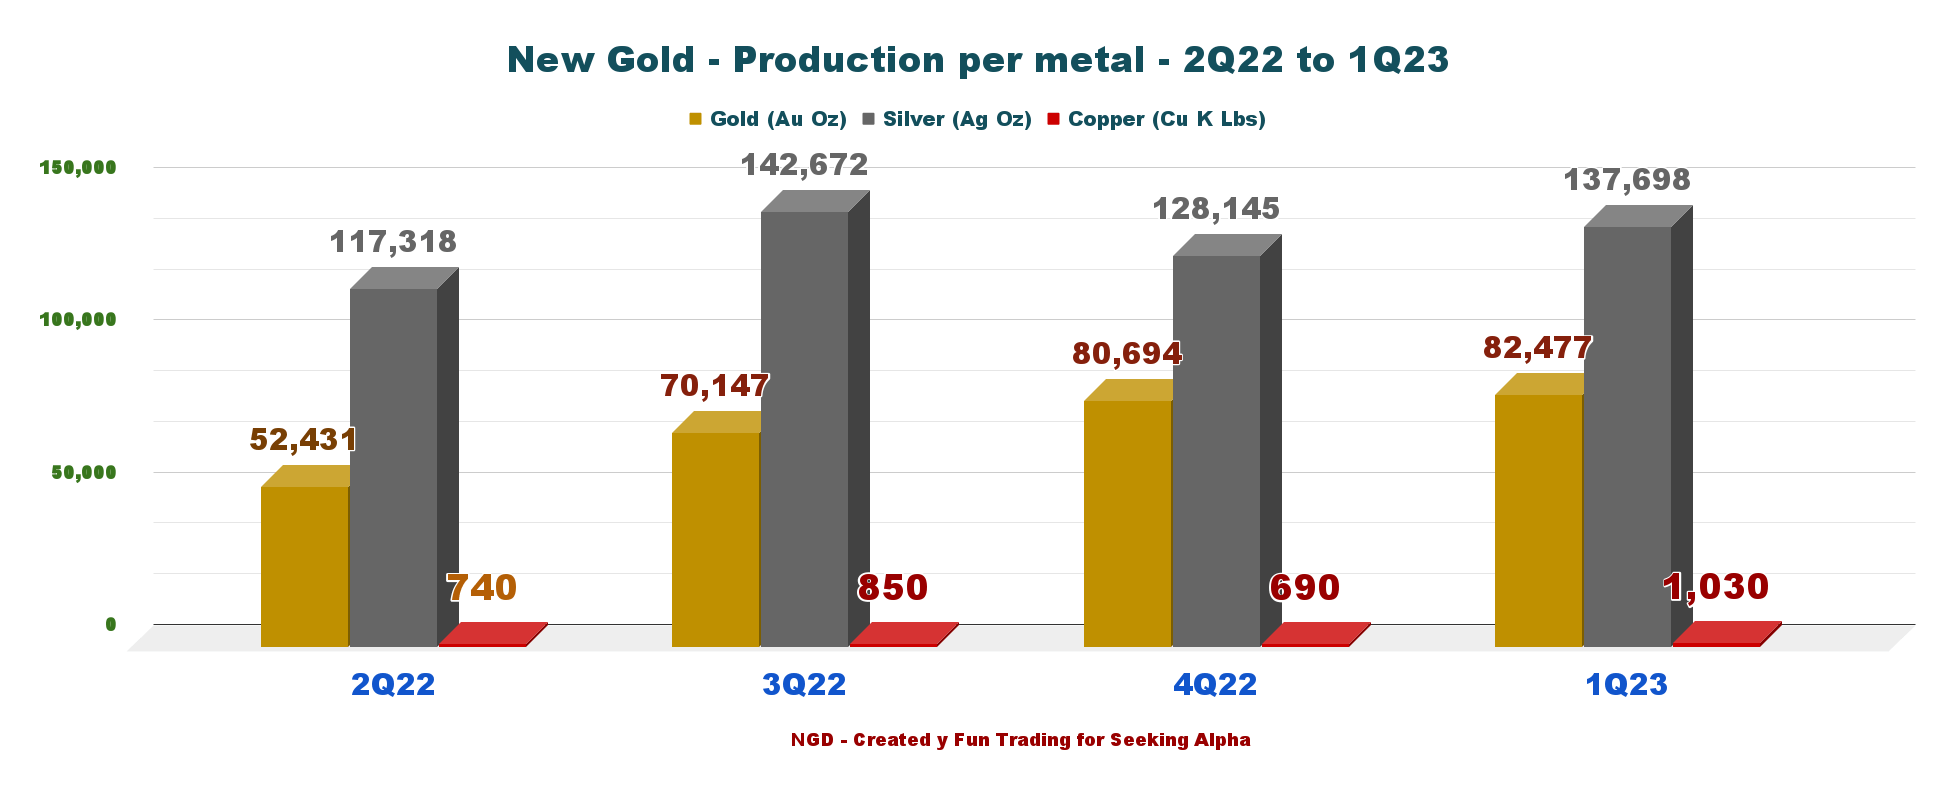
Gold equivalent production for the quarter was 104,857 ounces (82,477 ounces of gold, 10.3 million pounds of copper, and 137,698 ounces of silver).
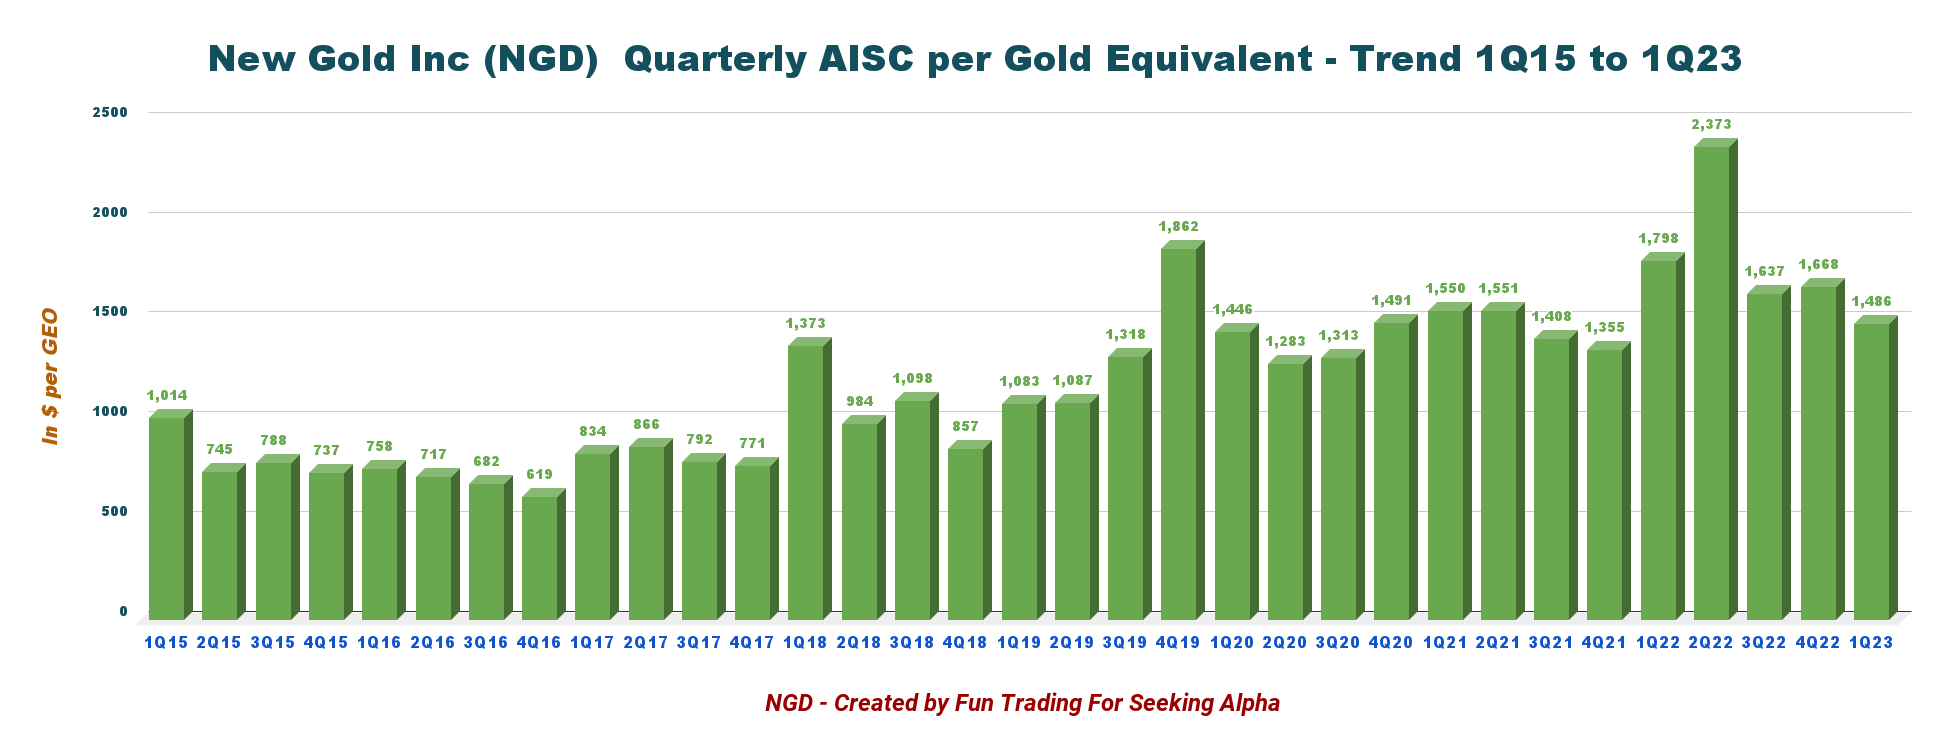
All-in sustaining costs AISC was $1,486 per GEO in 1Q23.
CEO Patrick Godin said in the conference call:
As I noted in our April production release, the first quarter of 2023 was our strongest start in four years. I cannot say enough how important safety is to our success. This was a core aspect of the impressive first quarter operating results. Q1 saw no lost time injuries at our operations. New Afton reached a big milestone and exceeded one million hours without lost time. Rainy River continue to operate safely and reached 1.6 million hours without lost time.
2 - Investment Thesis
The investment thesis is quite limited with New Gold Inc. due to its limited producing assets and the risk of serious hiccups that could affect the stock price significantly. I do not have to remind all of you what happened last year at the Rainy River and how bad it has been for the stock.
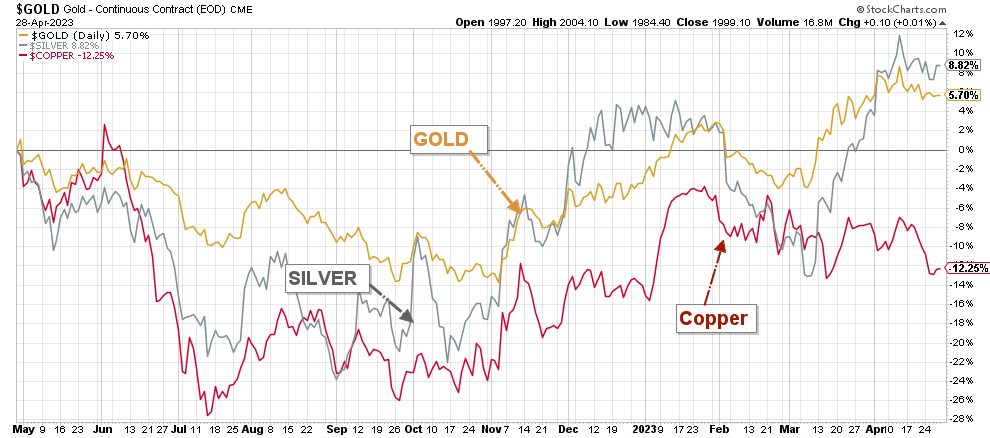
On the other hand, NGD has been an excellent trading tool and is easy to trade LIFO. The gold price is now trading at a solid range between $1,950 and $2,050 per ounce, and the stock could outperform the VanEck Vectors Gold Miners in H2 2023.
NGD 1-Year Chart Gold, Silver, Copper (Fun Trading StockCharts)
Thus, I recommend trading the stock and keeping a low long-term position in NGD. One possible positive outcome is that NGD gets acquired by another Canadian producer like Eldorado Gold ( EGO ) or even Newmont Corp. ( NEM ) at a good enough premium.
3 - Stock Performance
NGD has significantly underperformed the VanEck Vectors Gold Miners ETF ( GDX ). NGD is now down 12% on a one-year basis. As shown below, NGD recovered substantially from its low in September 2022.
New Gold Inc. - Balance Sheet history until 1Q23 - The Raw Numbers
| New Gold NGD |
| 1Q22 |
| 2Q22 |
| 3Q22 |
| 4Q22 |
| 1Q23 |
| Total Revenues in $ million |
| 174.7 |
| 115.7 |
| 151.2 |
| 162.8 |
| 201.6 |
| Net Income in $ million |
| -7.8 |
| -37.9 |
| -4.2 |
| -16.9 |
| -31.8 |
| EBITDA $ million |
| 47.6 |
| 7.9 |
| 43.1 |
| 49.7 |
| 26.3 |
| EPS diluted in $/share |
| -0.01 |
| -0.06 |
| -0.01 |
| -0.03 |
| -0.05 |
| Cash from Operating Activities in $ million |
| 67.8 |
| 37.4 |
| 53.7 |
| 31.8 |
| 60.6 |
| Capital Expenditure in $ million |
| 78.2 |
| 76.1 |
| 69.9 |
| 68.7 |
| 63.1 |
| Free Cash Flow in $ million |
| -10.4 |
| -38.7 |
| -16.2 |
| -36.9 |
| -2.5 |
| Total cash $ million |
| 494.7 |
| 324.9 |
| 279.9 |
| 236.4 |
| 208.5 |
| Total Long-Term Debt in $ million |
| 491.5 |
| 394.4 |
| 394.7 |
| 394.9 |
| 395.2 |
| Shares outstanding (diluted) In millions |
| 681.3 |
| 682.0 |
| 682.3 |
| 683.1 |
| 682.7 |
Data Sources: Company release .
* Estimated by Fun Trading.
Analysis: Balance Sheet Discussion
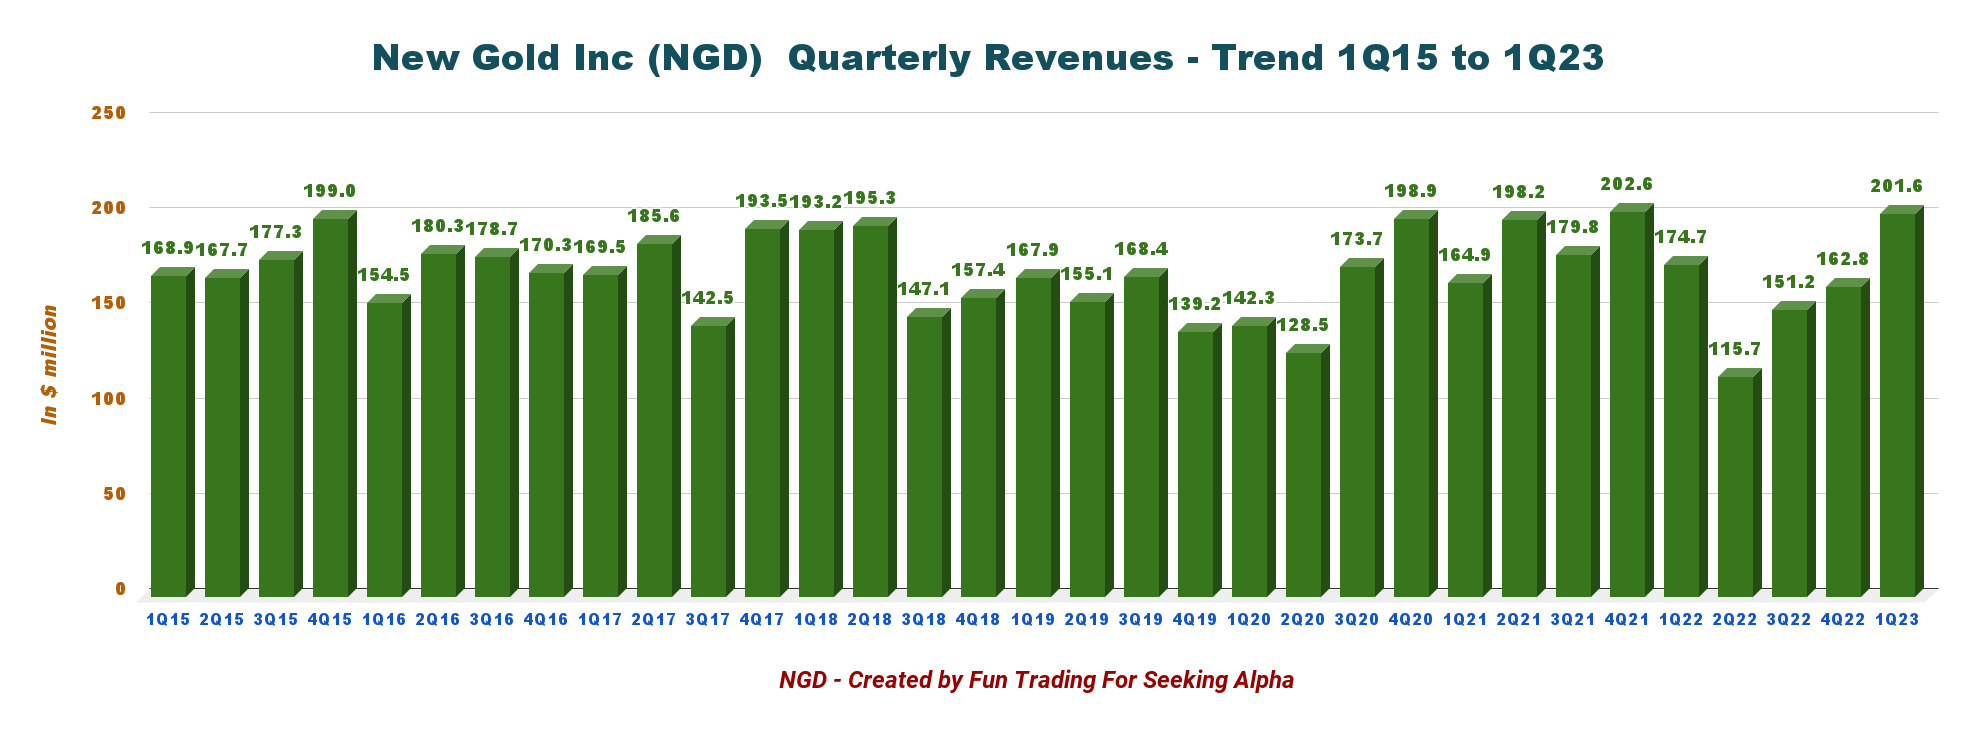
1 - Revenues of $201.6 million in 1Q23
NGD Quarterly Revenue History (Fun Trading) New Gold posted substantial revenue of $201.6 million for 1Q23, up 15.4% from the same quarter a year ago and up 23.8% sequentially. The company posted a net loss of $31.8 million compared to a loss of $7.8 million in 1Q22.
Revenue increased over the prior year due to higher gold and copper sales volume, partially offset by slightly lower prices.
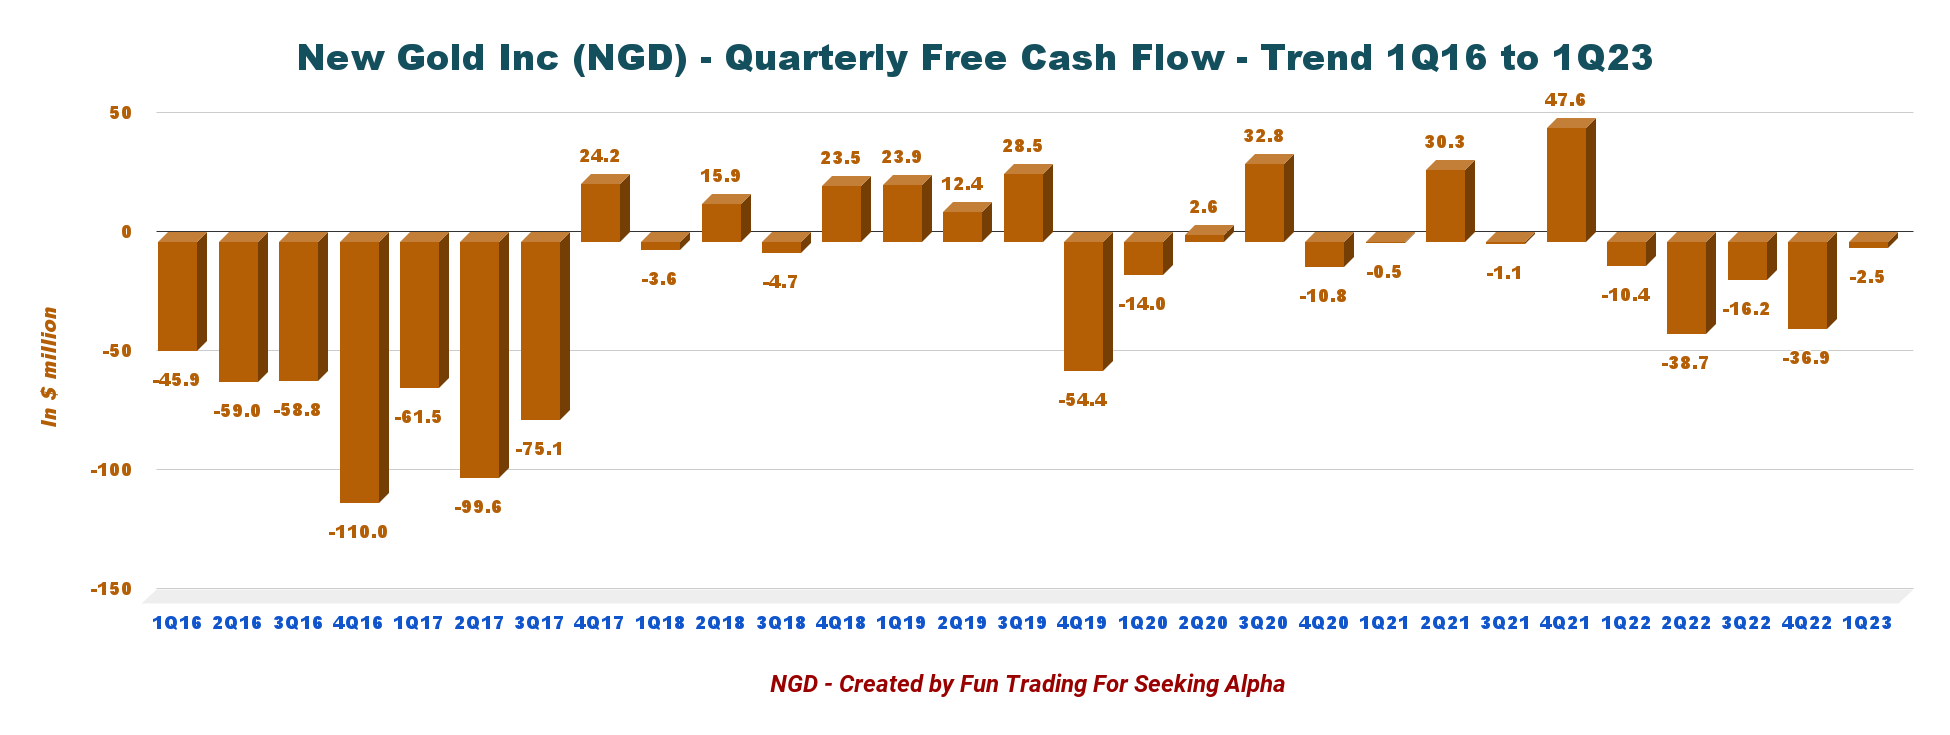
2 - Free cash flow was a loss of $2.5 million in 1Q23
NGD Quarterly Free cash flow history (Fun Trading) Note: The generic free cash flow is the cash from operating activities minus CapEx. The company has a different way of calculating Free cash flow, indicating $15.0 million.
The free cash flow for 1Q23 was a loss of $2.5 million, with a trailing 12-month free cash flow loss of $94.3 million.
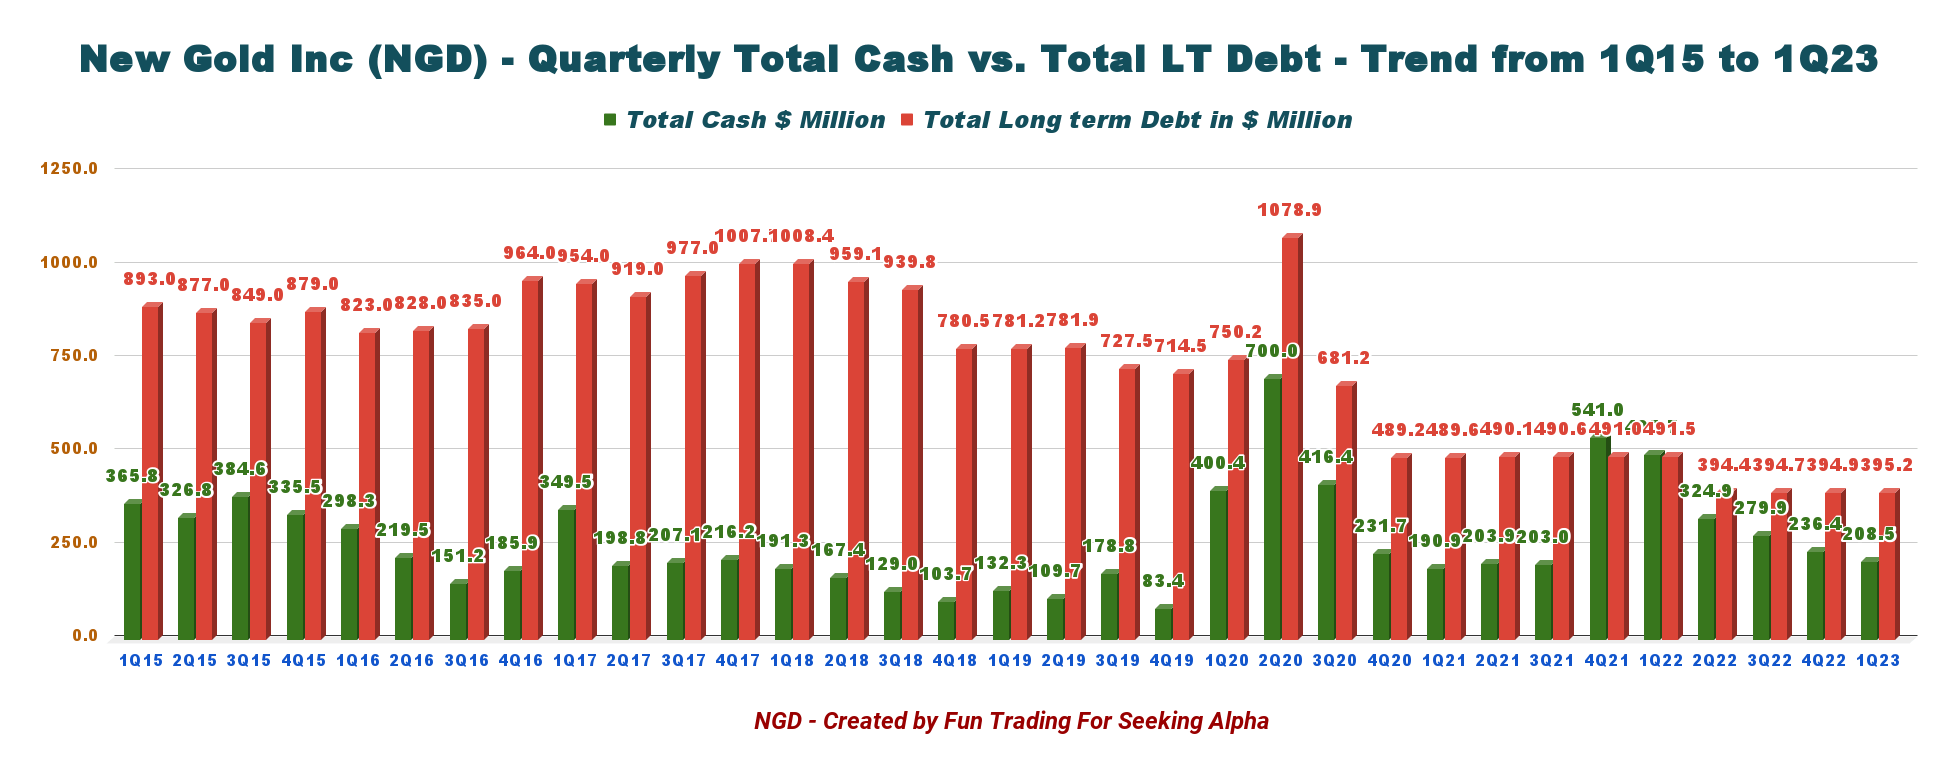
3 - Net debt is $186.7 million as of March 31, 2023
NGD Quarterly Cash versus Debt History (Fun Trading)
New Gold's net debt was $186.7 million this quarter. As of March 31, 2023, the debt was $395.2 million, and the total cash was $208.5 million.
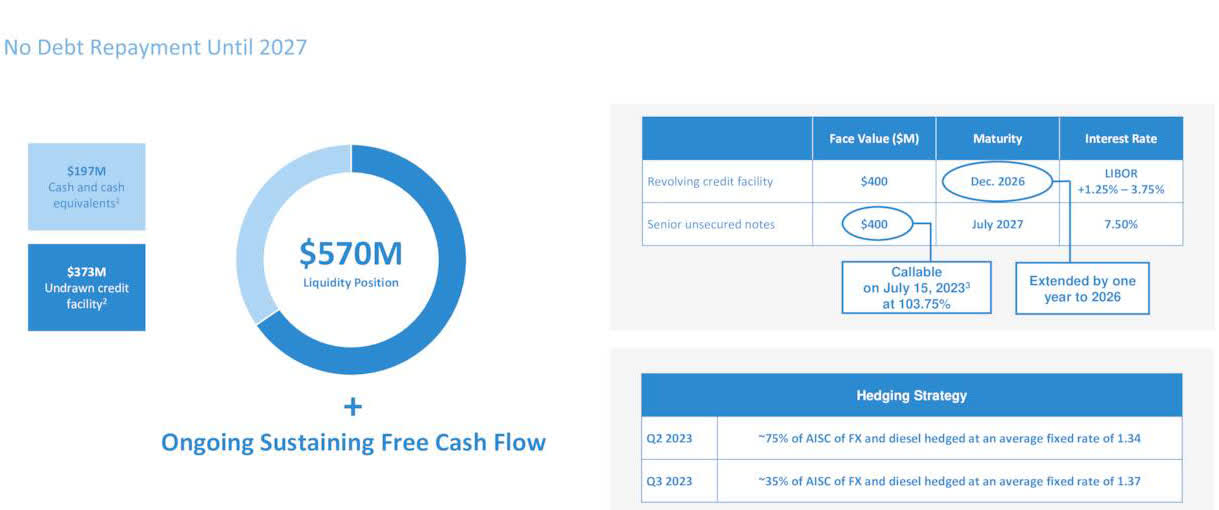
The total liquidity position was $570 million at the end of March 2023, including the recent sale of Artemis on January 16, 2023, for approximately $23 million. The company still owns Talisker Resources Ltd. and other marketable securities.
NGD Liquidity (NGD Presentation)
Note: After the quarter, on April 26, 2023, the Company amended its revolving credit facility, extending the maturity date to December 2026 from December 2025.
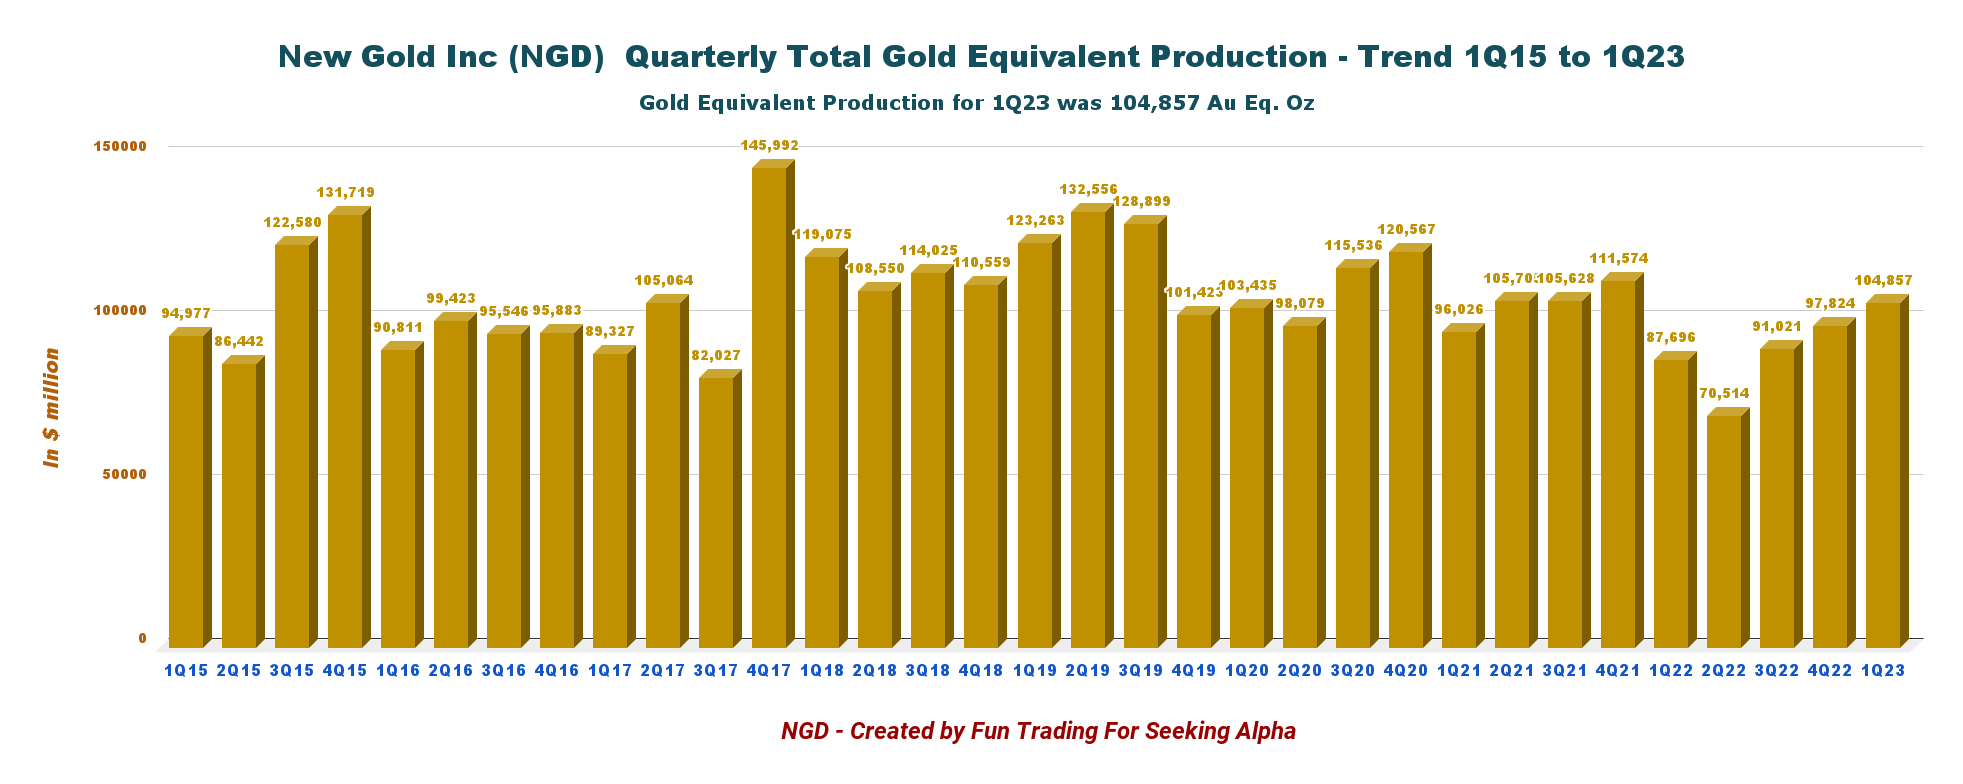
1Q23 Gold production analysis
1 - The raw numbers
NGD Quarterly GEO Production History (Fun Trading)
NGD produced 104,857 GEOs during the first quarter of 2023, up 7.2% sequentially. The production of gold equivalent ounces [GEO] includes gold, silver, and copper. Below are the details:
- Gold production was 82,477 Au oz
- Silver production was 137,698 Ag oz
- Copper production was 10.3 M Pounds.
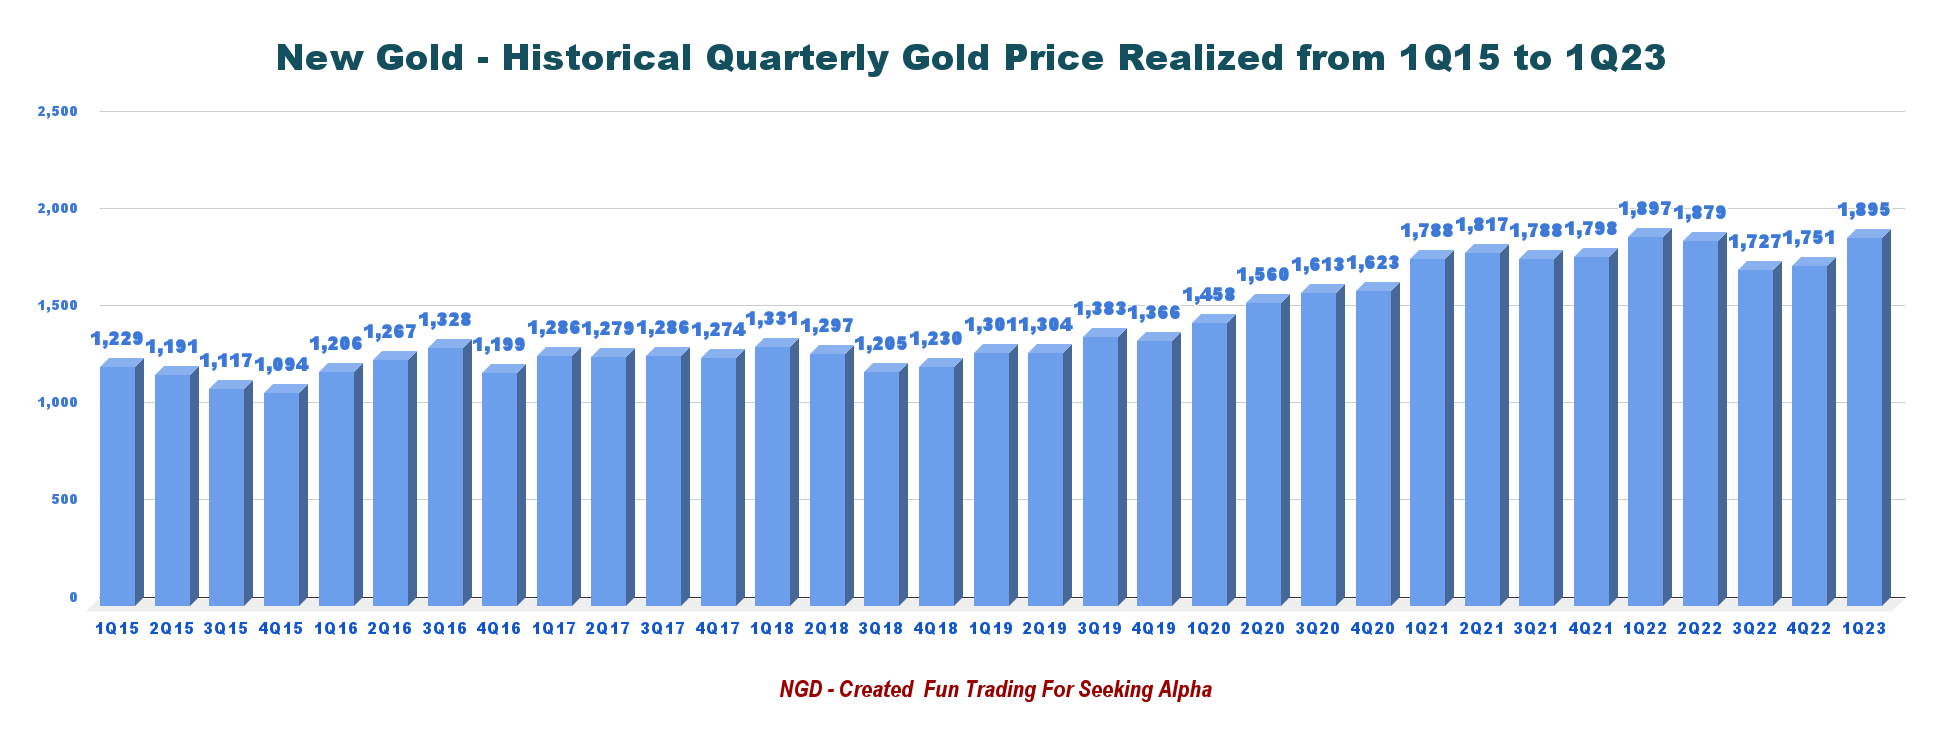
Note: The company sold 107,931 GEOs in 1Q23 at a gold price of $1,890 per ounce.
NGD Quarterly Gold Price History (Fun Trading)
Below is shown the production for the last four quarters and per metal:
NGD Quarterly production per mine history (Fun Trading)
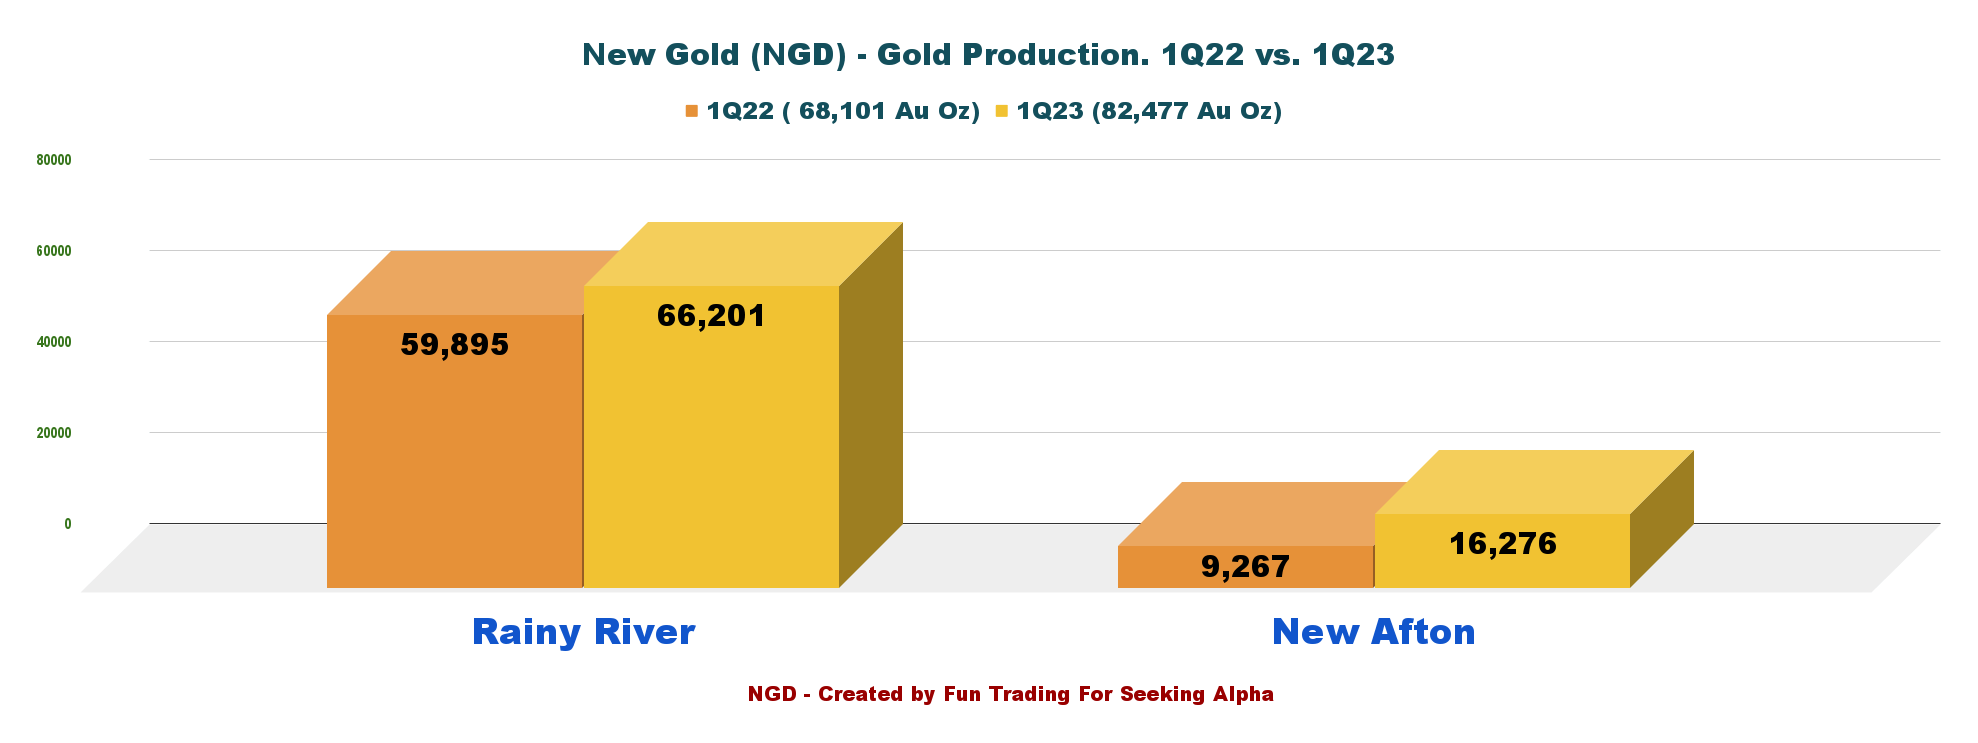
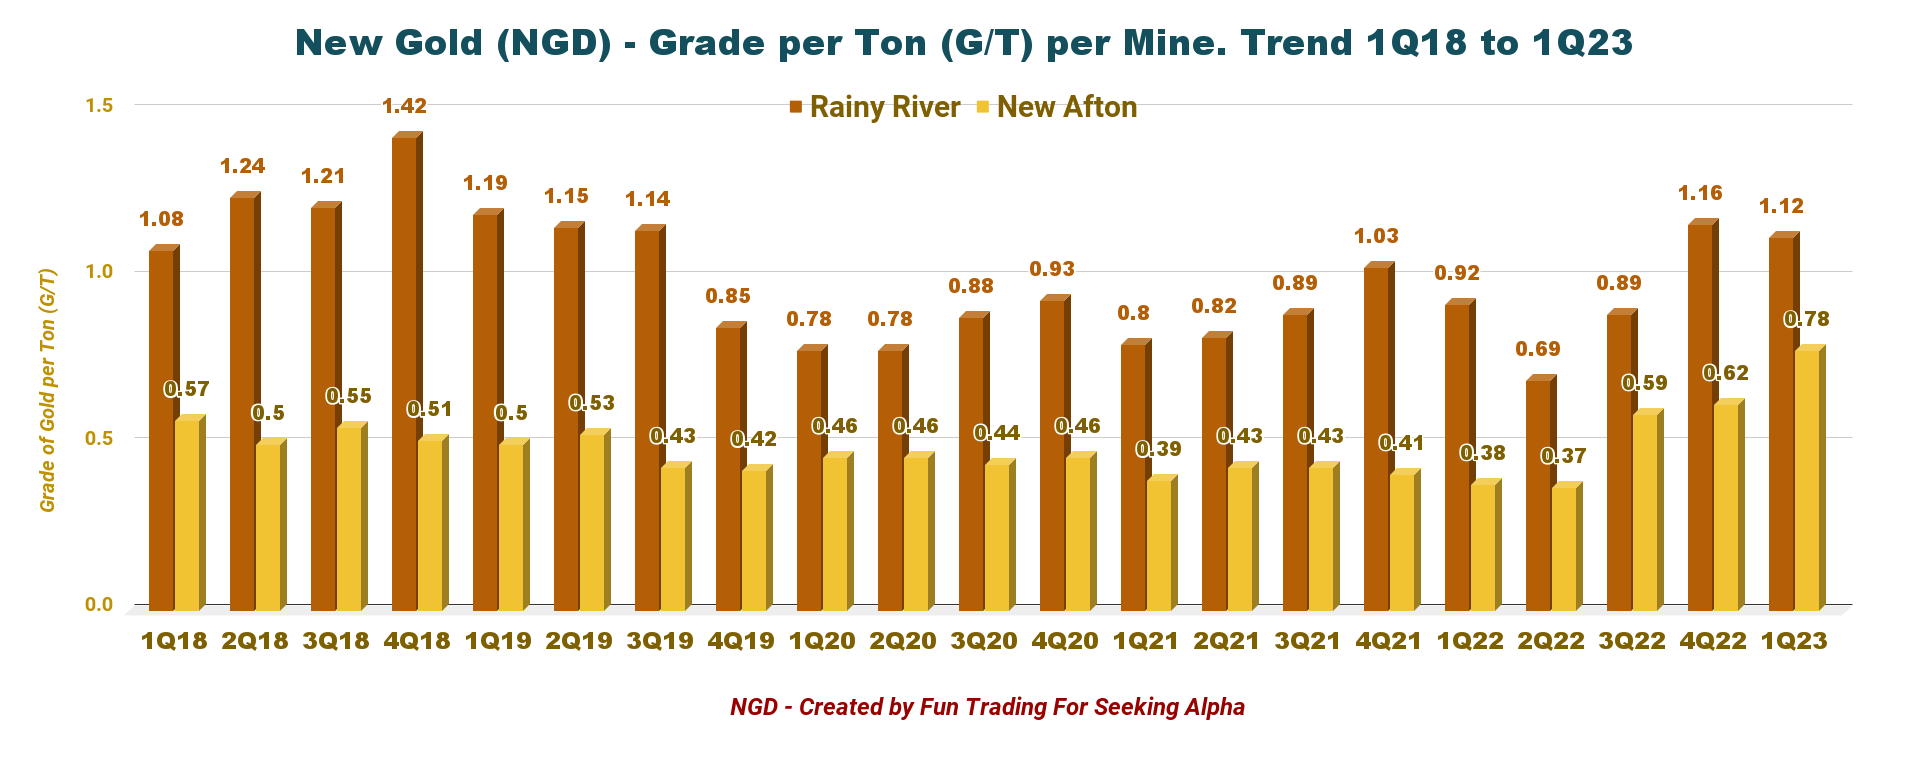
Gold production for the Rainy River mine was 66,201 Au ounces, and 16,276 Au ounces for the New Afton mine.
At New Afton, gold and copper production improved nicely over the same period last year, as the operation's focus remained on steady-state mining of B3 and C-Zone development. Tonnes mined per day (ore and waste) was 9,185.
NGD Production per mine 1Q22 versus 1Q23 (Fun Trading)
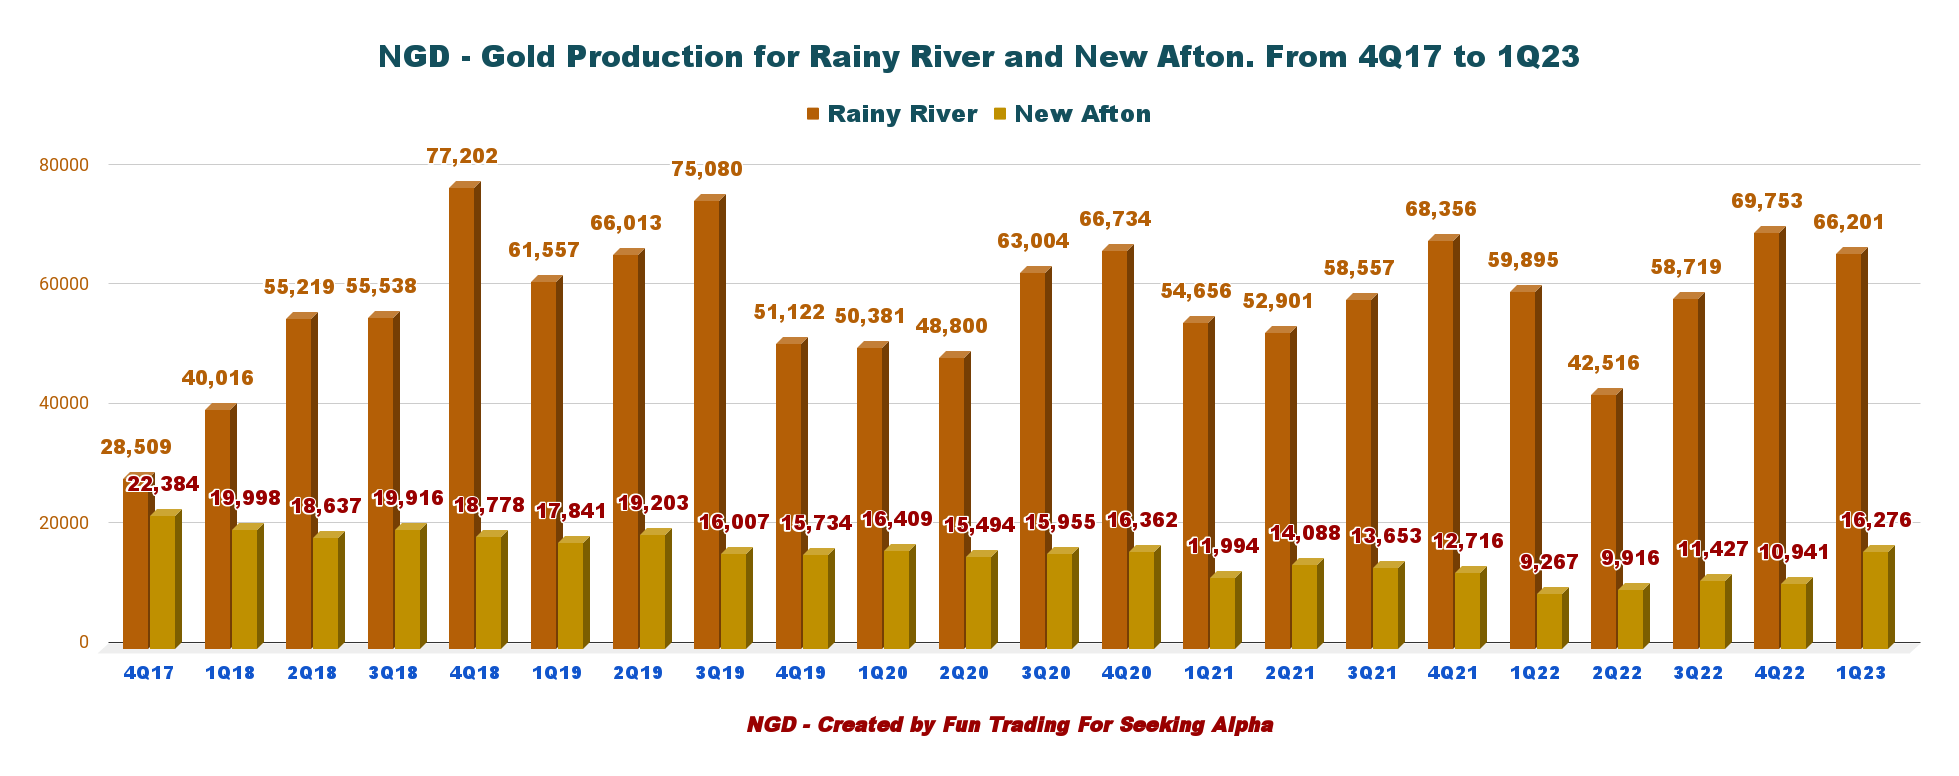
Gold production is back to a decent level, as shown in the graph below:
NGD Quarterly Production per Mine History (Fun Trading)
The company indicated an AISC of $1,486 per ounce this quarter.
NGD Quarterly AISC History (Fun Trading)
The gold grade was quite impressive this quarter.
NGD Quarterly Gold Grade history (Fun Trading)
2 - The company reaffirms 2023 Guidance
Gold equivalent production is expected to be between 365K to 425K ounces, approximately 13% higher than 2022 production, with 55% of the annual output expected in the year's second half.
AISC is expected to be $1,505 to $1,605 per GEO, down from the prior year due to lower sustaining capital spend and higher sales volumes.
Technical Analysis And Commentary
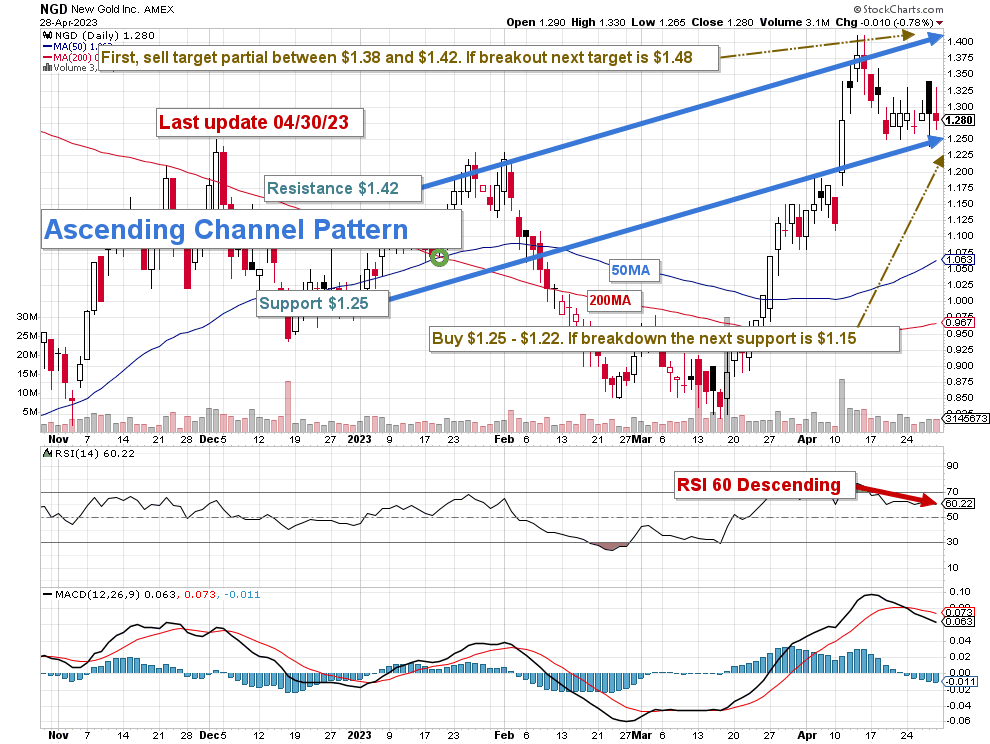
NGD TA Chart Short-term (Fun Trading StockCharts)
NGD forms an ascending channel pattern with resistance at $1.42 and support at $1.25.
A bullish or rising channel pattern forms when a price sets higher highs followed by the lower lows. The price remains within the channel support and channel resistance lines. Until the prices continue to advance and trade within the boundary of the channel, the trend remains bullish. When prices fall short of the resistance channel line, it signals an upcoming change in trend.
The overall strategy I promote in my marketplace, "The Gold And Oil Corner," is to keep a core long-term position and use about 60-70% to trade LIFO while waiting for a higher price target for your core long position between $1.60 and $1.75.
I suggest selling about 50% of your position between $1.38 and $1.42, with possible higher resistance at $1.48, and accumulating between $1.25 and $1.22, with possible lower support at $1.15.
Watch gold and silver prices like a hawk.
Warning: The TA chart must be updated frequently to be relevant. It is what I am doing in my stock tracker. The chart above has a possible validity of about a week. Remember, the TA chart is a tool only to help you adopt the right strategy. It is not a way to foresee the future. No one and nothing can.
For further details see:
New Gold: A Solid Start In 2023