NGD - New Gold: Not So Bad After All
Summary
- New Gold posted revenue of $151.2 million for 3Q22, down 15.9% from the same quarter a year ago and up 30.7% sequentially.
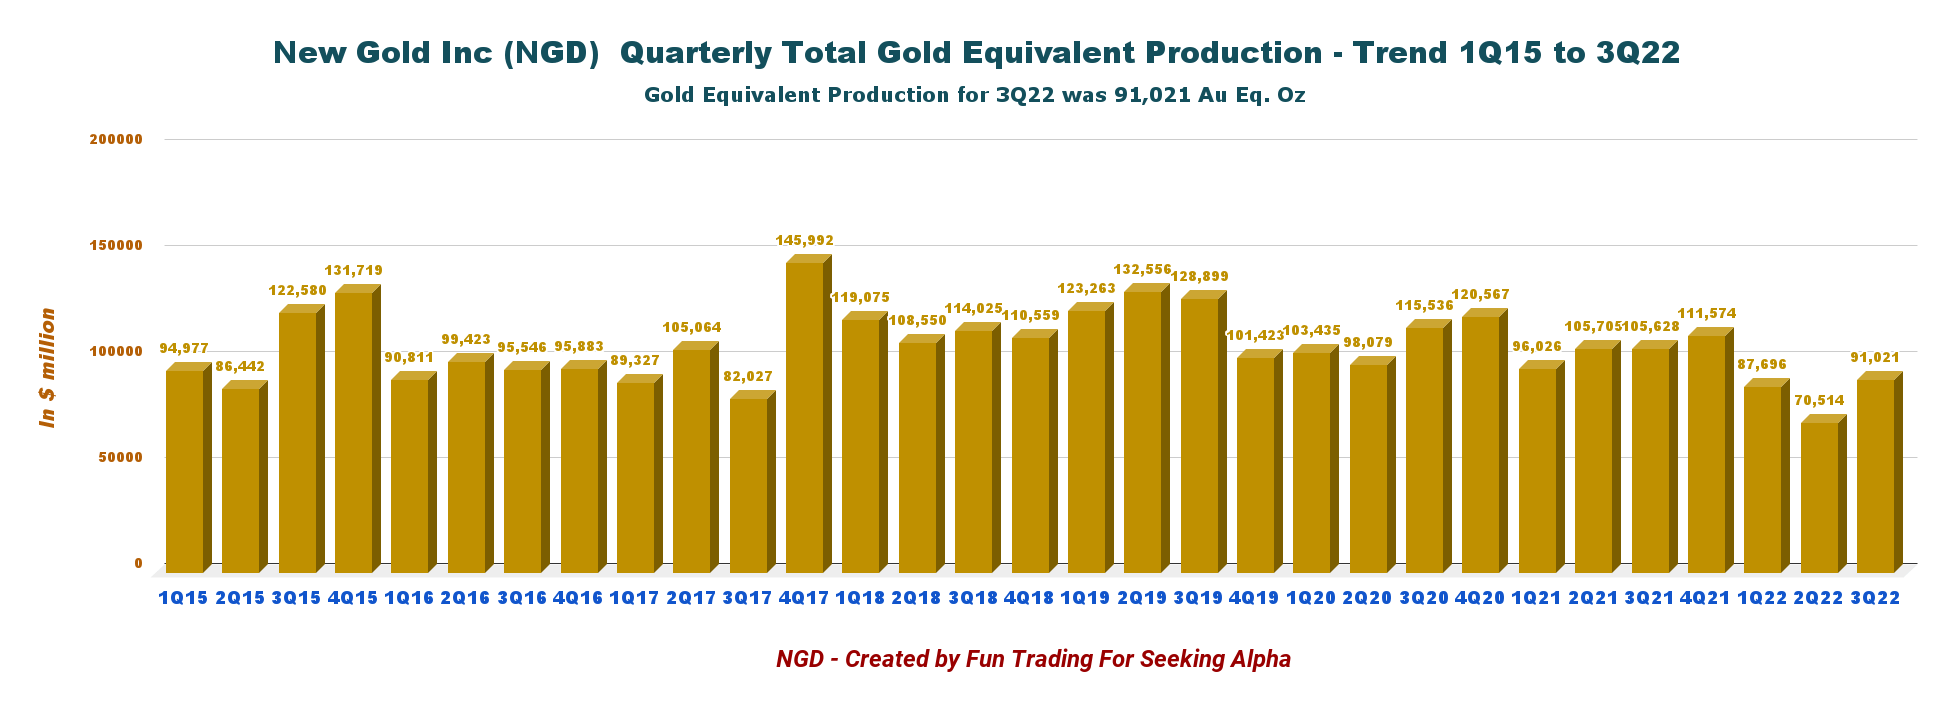
- NGD produced 91,021 GEOs during the third quarter. The production of gold equivalent ounces GEO includes gold, silver, and copper. Production in GEO sold was 92,634 ounces.
- I recommend buying NGD between $0.78 (50MA) and $0.85, with possible lower support at $0.72.
Part I - Introduction
Canada-based New Gold Inc. ( NGD ) released its third-quarter 2022 results on November 2, 2022.
Note: This article is an update of my article published on August 25, 2022. I have followed NGD on Seeking Alpha since January 2019.
New Gold operates two mines: The Rainy River and the New Afton mines.
NGD Map Presentation (NGD Presentation)
1 - 3Q22 Results highlights
Revenues for the third quarter of 2022 decreased significantly from $179.8 million to $151.2 million. The company said the revenues decreased over the prior-year periods due to lower copper sales volume and lower realized copper prices, partially offset by higher realized gold prices for the nine-month period that ended September 30, 2022.
The company posted a net loss of $4.2 million compared to a loss of $11.3 million in 3Q21. Adjusted net loss was $16.7 million from an income of $26.7 million in 2Q21.
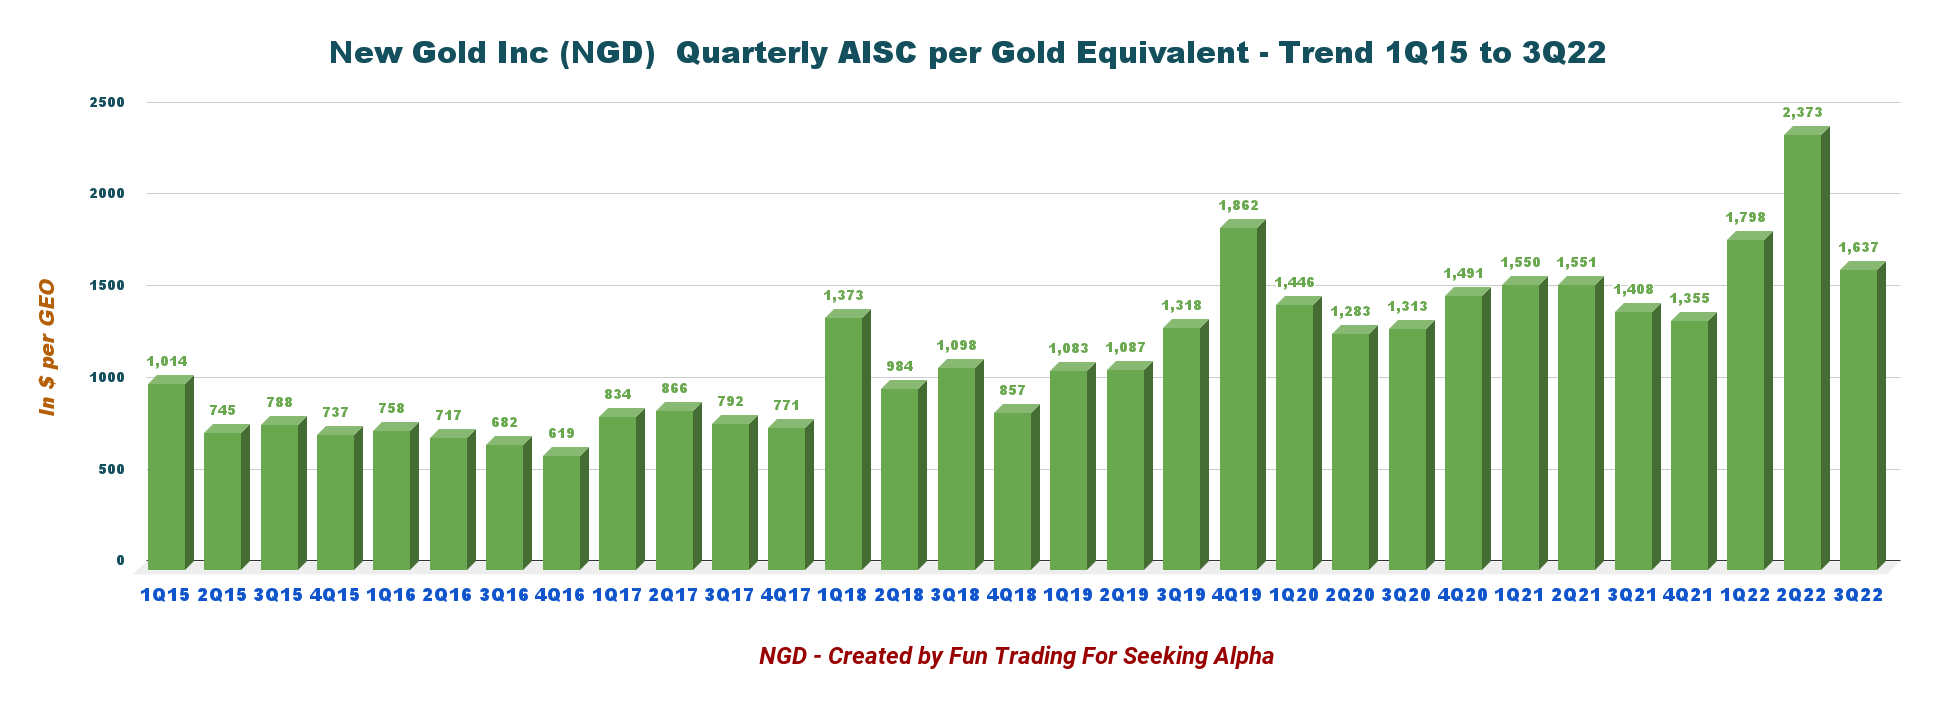
Gold equivalent production for the quarter was 91,021 ounces (70,147 ounces of gold, 8.5 million pounds of copper, and 142,672 ounces of silver). All-in sustaining costs AISC were $1,637 per GEO in 3Q22, including total cash costs of $1,114 per GEO.
The investment thesis has not changed since my last article. I believe the stock is essentially a trading opportunity but should not be considered a long-term investment due to the quality of the assets. New Gold's assets are weak and technical issues are recurring often, increasing the risk.
CEO Renaud Adams said in the conference call:
Lastly, the third quarter delivered to plan and significantly improved versus the second quarter in both production and costs and we are on track to achieve our 2022 undated guidance.
2 - Stock Performance
NGD has underperformed the VanEck Vectors Gold Miners ETF ( GDX ). NGD is now down 35% on a one-year basis.
3 - Gold Production Details For The Third Quarter Of 2022
Note: The gold production has been covered in my preceding article on October 24, 2022. This part is an update of the previous article on October 22.
3.1 - The raw numbers
NGD Quarterly GEO History (Fun Trading)
NGD produced 91,021 GEOs during the third quarter. The production of gold equivalent ounces GEO includes gold, silver, and copper. Production in GEO sold was 92,634 ounces. However, I was a bit disappointed because, during the second quarter of 2022, New Gold sold 11.6% less than it produced due to unfortunate timing in sales. Thus, I expected higher sales this quarter above 95K GEOs.
Below is shown the production for the past three quarters and per metal:
NGD Metals production last three quarters (Fun Trading)
Gold production for the Rainy River mine was 70,147 Au ounces, and 11,427 Au ounces for the New Afton mine.
It was a good jump sequentially to a more average production for both mines. Shareholders are feeling better now that the storm has passed.
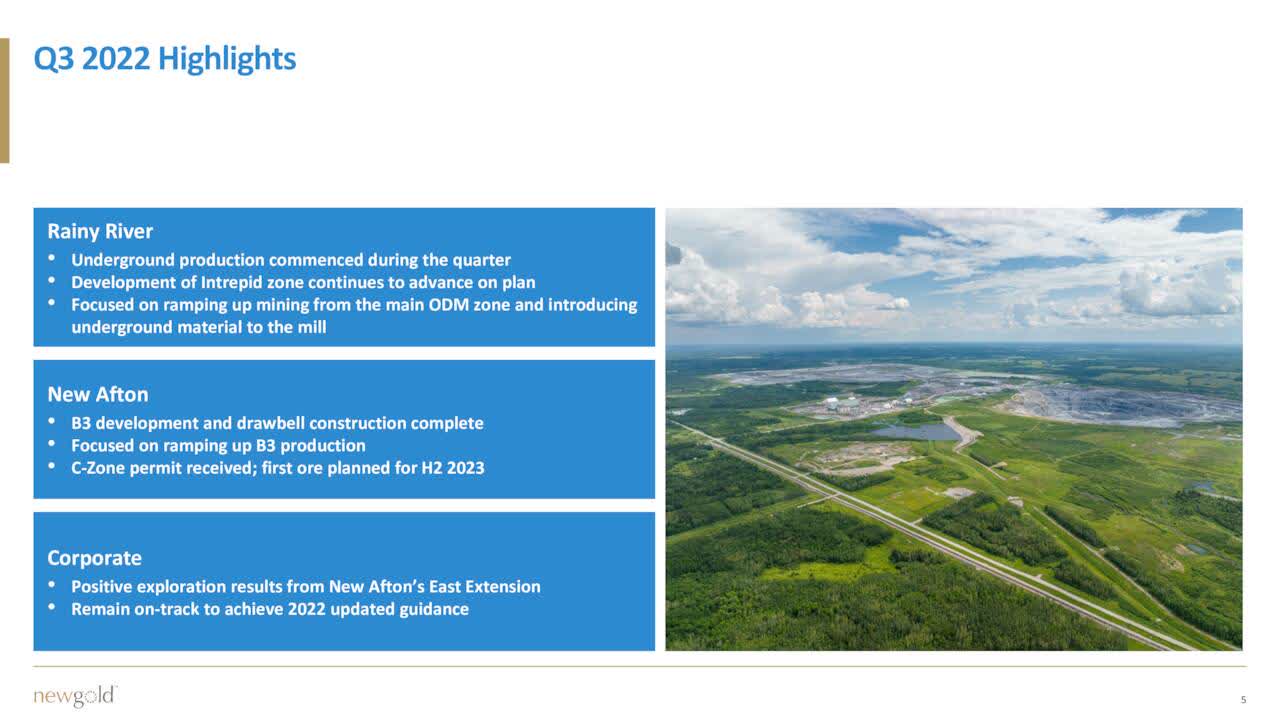
At Rainy River, underground mining commenced during the quarter, with underground material feeding the mill beginning in the fourth quarter. Mining of the open-pit main ODM zone continues its ramp-up.
At New Afton, NGD had solid production with the continued ramp-up of B3. New Gold received the C-Zone permit, an essential milestone for the mine.
NGD Quarterly Gold production per mine history (Fun Trading)
The gold production was 70,147 Au ounces, but the company sold 68,816 Au ounces. Also, the grade per tone G/T recovered from the disastrous second quarter with a record high at New Afton and a good grade at Rainy River.
NGD Quarterly Grade History (Fun Trading)
However, when we look at the tonnes mined per day, we notice a significant drop year over year. For Rainy River, the TPD dropped from 52,917 to 24,701; for New Afton, the TPD dropped from 13,068 to 7,764.
3.2 - All-in Sustaining Costs AISC
AISC decreased significantly sequentially, but it is still too high for comfort. However, CFO Rob Chaussé said in the conference call that high sustaining CapEx is pushing the AISC higher, which is a positive long-term.
We continue to invest in sustaining capital at our operations during the third quarter with the impact of sustaining capital spend per ounce being $460 in the quarter.
Also, inflationary pressures are pushing higher AISC. Rob Chaussé said in the conference call:
During Q3, we experienced inflationary challenges that have been experienced across the industry, particularly, with regards to fuel, electricity, grinding media and cyanide. The financial impact of these above-noted categories on inflation was approximately $100 per ounce or 6% on AISC for the quarter.
3. 3 - NGD remains on track to deliver on its updated 2022 guidance
In the conference call, Renaud Adams, President & CEO, said that the company remains on track to deliver on the updated guidance.
The company revised and lowered the Rainy River's gold equivalent production for 2022 in 2Q22. It is now expected to be between 230K and 250K GEOs from 265K and 295K GEOs.
Moreover, operating expenses per GEO are forecasted to be between $960 and $1,040 per GEO, from $730 and $810 per GEO. The increase is due to lower gold production and current inflationary cost pressures.
Finally, all-in-sustaining-costs AISC are expected to be between $1,620 and $1,720 per GEO, from $1,270 and $1,370 per GEO.
NGD 2022 Guidance (NGD Presentation)
New Gold Inc. - Balance Sheet In 3Q22 - The Raw Numbers
| New Gold NGD |
| 3Q21 |
| 4Q21 |
| 1Q22 |
| 2Q22 |
| 3Q22 |
| Total Revenues in $ million |
| 179.8 |
| 202.6 |
| 174.7 |
| 115.7 |
| 151.2 |
| Net Income in $ million |
| -11.3 |
| 150.9 |
| -7.8 |
| -37.9 |
| -4.2 |
| EBITDA $ million |
| 49.5 |
| 212.9 |
| 46.5 |
| 13.2 |
| 44.5* |
| EPS diluted in $/share |
| -0.02 |
| 0.23 |
| -0.01 |
| -0.06 |
| -0.01 |
| Cash from Operating Activities in $ million |
| 54.3 |
| 105.7 |
| 67.8 |
| 37.4 |
| 53.7 |
| Capital Expenditure in $ million |
| 55.4 |
| 58.1 |
| 78.2 |
| 76.1 |
| 69.9 |
| Free Cash Flow in $ million |
| -1.1 |
| 47.6 |
| -10.4 |
| -38.7 |
| -16.2 |
| Total cash $ million |
| 203.0 |
| 541.0 |
| 494.7 |
| 324.9 |
| 258.9 |
| Total Long-Term Debt in $ million |
| 490.6 |
| 491.0 |
| 491.5 |
| 394.4 |
| 394.7 |
| Shares outstanding (diluted) In millions |
| 680.8 |
| 687.5 |
| 681.3 |
| 682.0 |
| 682.3 |
Data Sources: Company release
* Estimated by Fun Trading
Note: More historical data are available for subscribers only.
Analysis: Balance Sheet Discussion
1 - Revenues of $151.2 million in 3Q22
NGD Quarterly Revenues history (Fun Trading) New Gold posted revenue of $151.2 million for 3Q22, down 15.9% from the same quarter a year ago and up 30.7% sequentially. The company posted a net loss of $4.2 million compared to a loss of $11.3 million in 3Q21. The adjusted net loss was $13 million or $0.02 per share.
Revenue decreased over the prior year due to lower copper sales volume and realized copper prices.
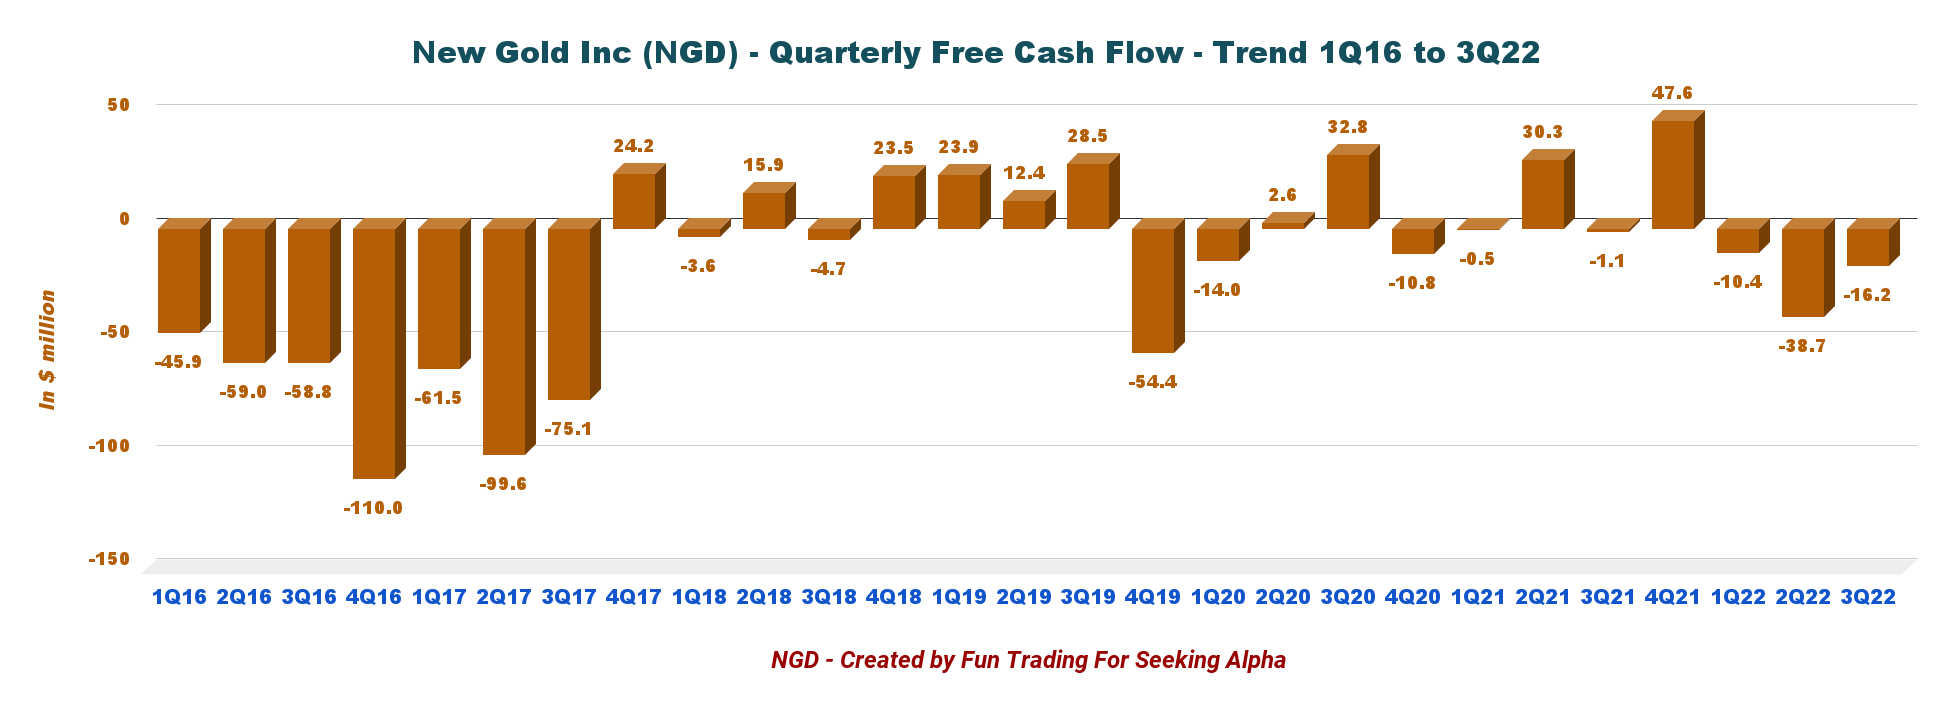
2 - Free cash flow was a loss of $16.2 million in 3Q22
NGD Quarterly Free cash flow history (Fun Trading) Note: The generic free cash flow is the cash from operating activities minus CapEx.
The free cash flow for 3Q22 was a loss of $16.2 million, with a trailing 12-month free cash flow loss of $17.7 million. The company is struggling.
3 - Net debt is $135.8 million as of September 30, 2022
NGD Quarterly Cash versus Debt history (Fun Trading)
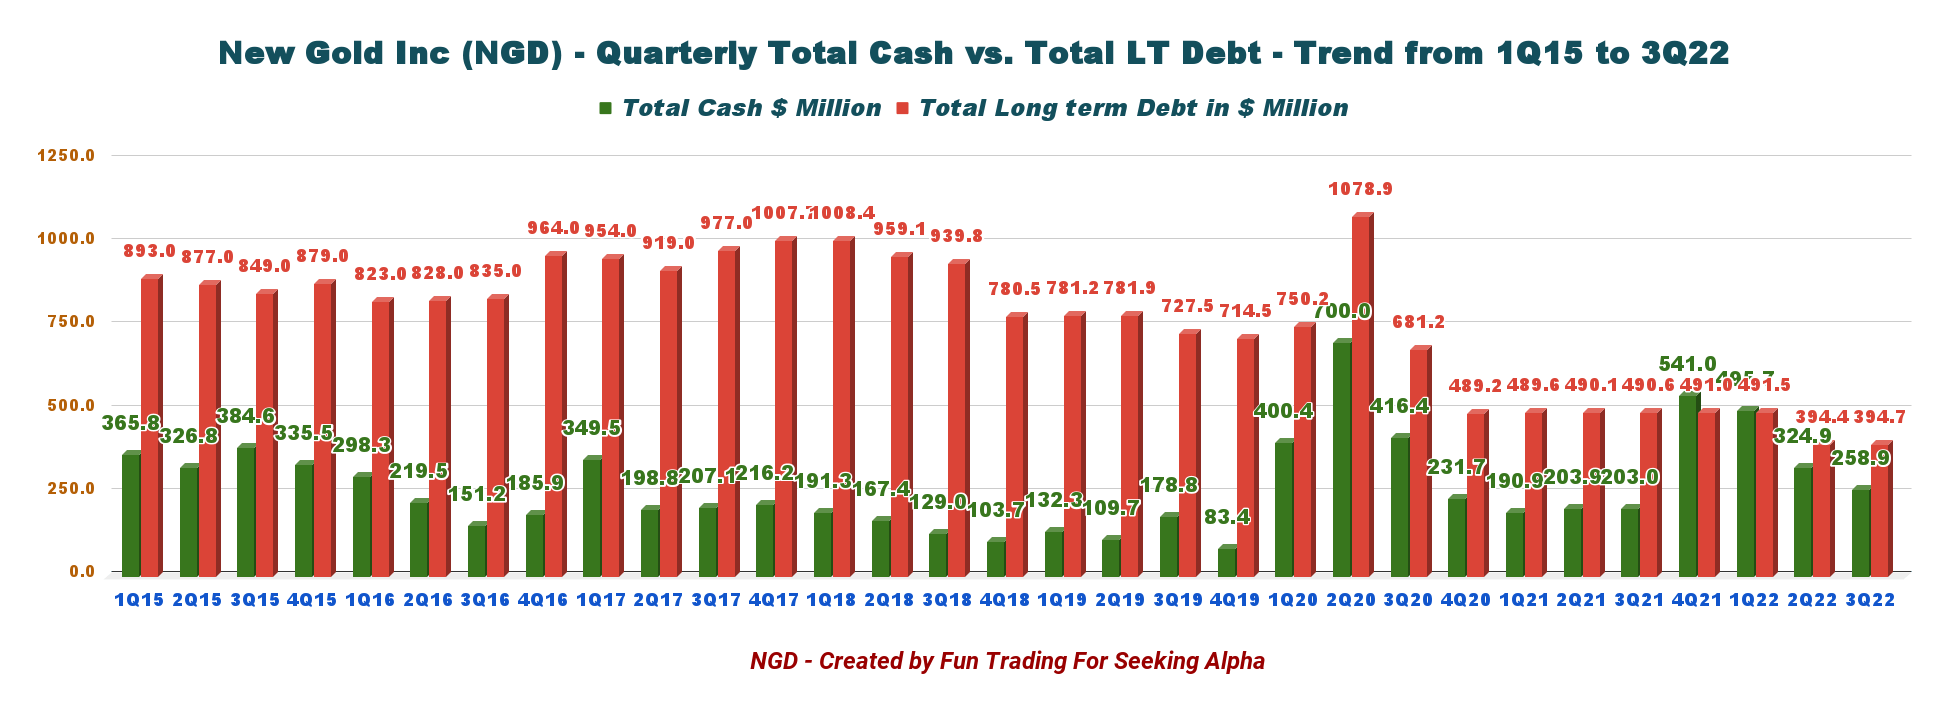
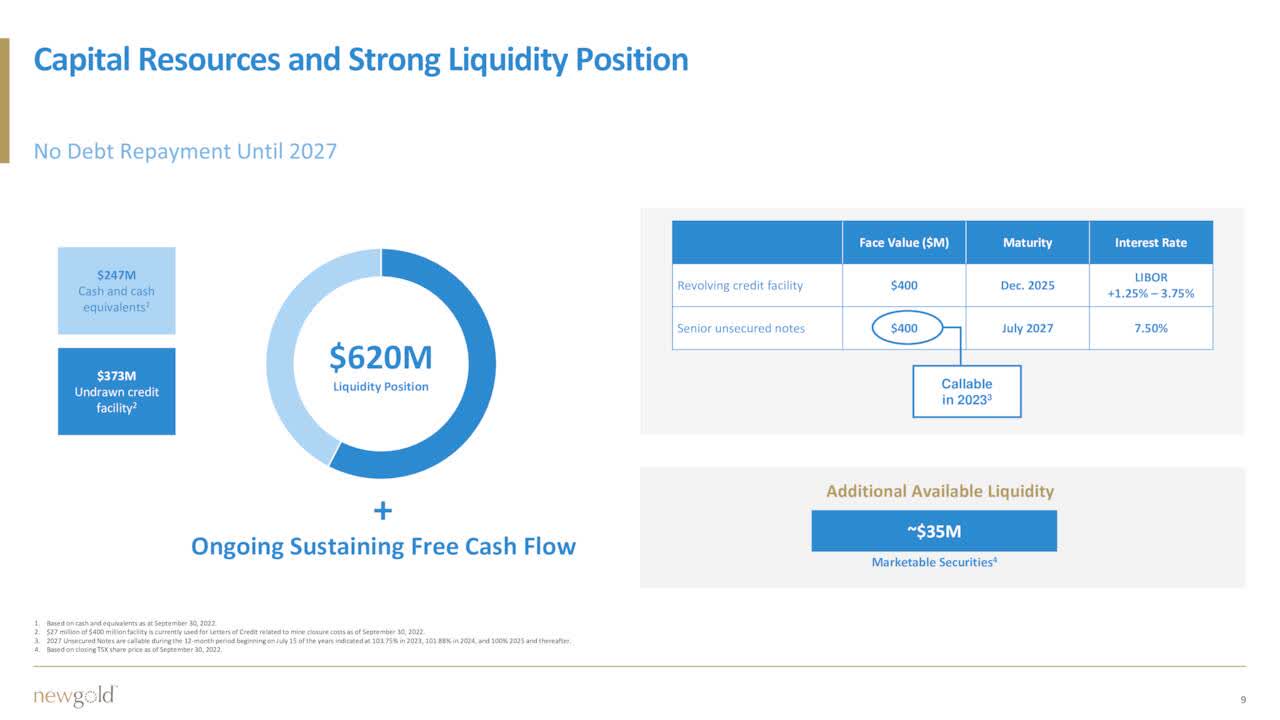
New Gold's net debt was $135.8 million this quarter. As of September 30, 2022, the debt was $394.7 million, and the total cash was $258.9 million. The total liquidity position was $620 million at the end of September 2022.
Note: New Gold's total investment in 3Q22 was worth $32.9 million compared to $59.5 million in 4Q21. The most significant investment is in Artemis Gold and the Blackwater project.
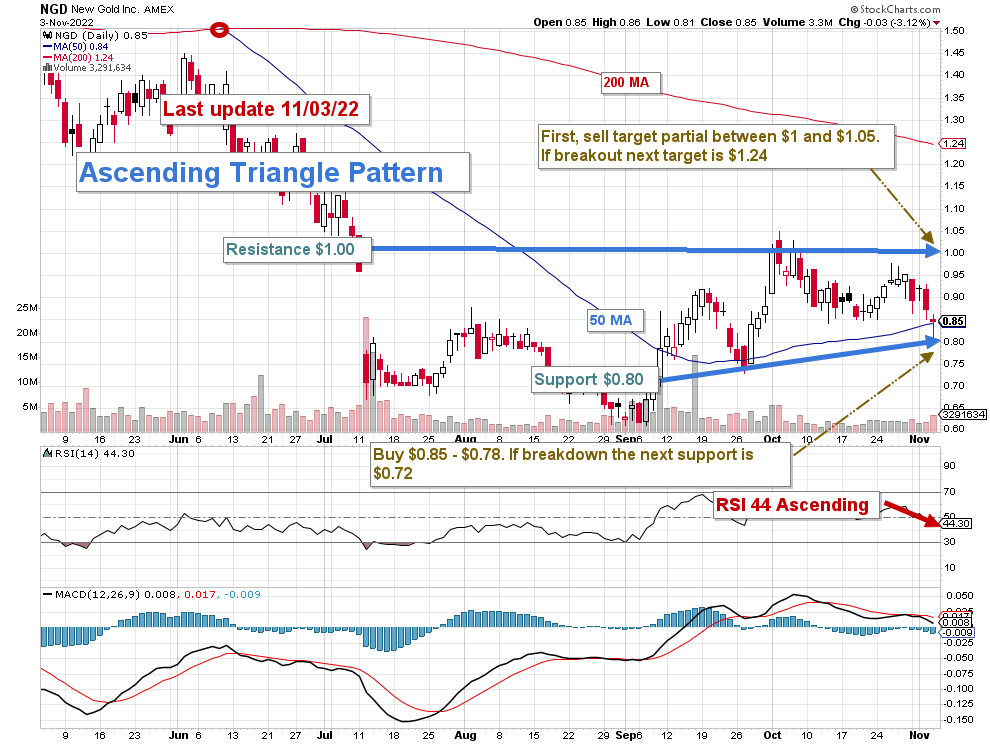
Technical Analysis And Commentary
NGD TA chart short-term (Fun Trading StockCharts)
Note: the numbers below are in US dollars.
NGD forms an ascending triangle pattern with resistance at $1.00 and support at $0.80.
The overall strategy that I promote in my marketplace, "The Gold And Oil Corner," is to keep a core long-term position and use about 55-65% to trade LIFO (see note below) while waiting for a higher price target for your core position between $1.20 and $1.25 which is the 200 moving average.
I suggest selling about 50% of your position between $1.00 and $1.05 and accumulating between $0.78 (50MA) and $0.85 with possible lower support at $0.72.
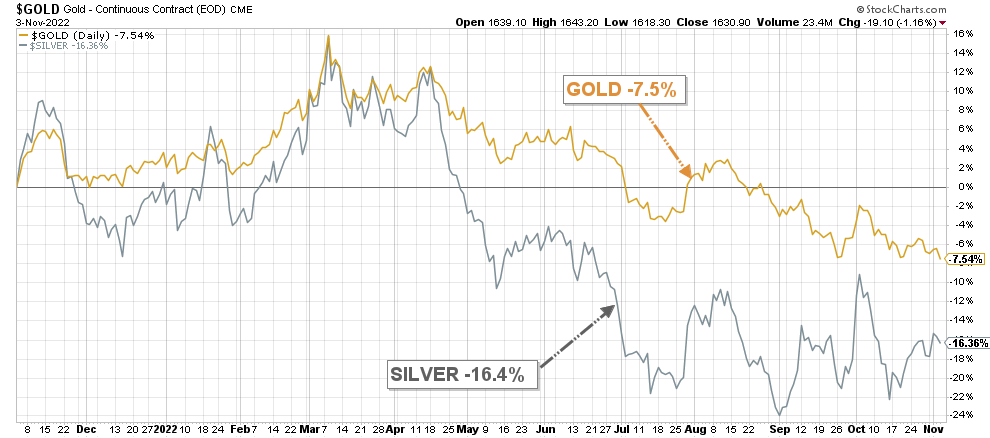
The gold price is again struggling to stay above $1,610 per ounce due to the Fed's action against the rampant inflation that threatens the world economy. The Fed raised the interest rate by 75-point yesterday and has indicated that it is not done yet, implying a potential 75-point in December.
NGD Gold and Silver variations 1 Year (Fun Trading StockCharts)
If it is the case, the gold price will struggle to stay above $1,610, and NGD could drop to lower support around $0.63-0.65.
Watch gold and silver prices like a hawk.
Note: The LIFO method is prohibited under International Financial Reporting Standards (IFRS), though it is permitted in the United States by Generally Accepted Accounting Principles (GAAP). Therefore, only US traders can apply this method. Those who cannot trade LIFO can use an alternative by setting two different accounts for the same stock, one for the long term and one for short-term trading.
Warning: The TA chart must be updated frequently to be relevant. It is what I am doing in my stock tracker. The chart above has a possible validity of about a week. Remember, the TA chart is a tool only to help you adopt the right strategy. It is not a way to foresee the future. No one and nothing can.
Author's note: If you find value in this article and would like to encourage such continued efforts, please click the "Like" button below as a vote of support. Thanks.
For further details see:
New Gold: Not So Bad After All