NMFC - New Mountain Finance: A BDC Value Buy
2023-07-16 23:46:28 ET
Summary
- New Mountain Finance is a business development company that primarily targets loans to middle-market companies.
- NMFC is currently trading at a 7% discount to NAVPS and has been covering its dividends with net investment income, yielding just under 10%.
- Analysis of NMFC's industry holdings suggests the company is on track to post a solid Q2 2023 earnings report in a few weeks.
Investment Thesis
Despite strong yield and NAVPS performance over the last 12-18 months, NMFC continues to trade at around a 7% discount to NAVPS, which warrants further examination of what is going on under the hood. I acknowledge modest concerns with NMFC's loan and equity portfolio, but ultimately believe NMFC remains slightly undervalued and will post solid Q2 2023 results.
Overview
New Mountain Finance Corp. ( NMFC ) is a business development company ""BDC"" subsidiary of New Mountain Capital, a New York-based private equity and credit practice chaired by private equity icon Steven Klinsky. New Mountain Capital - which reports ~$37 billion in AUM - has historically focused its investments on defensive companies, and its BDC is no different. NMFC is a closed-end fund that primarily targets loans to (but also invests in) middle-market companies, which it defines as companies reporting annual EBITDA of between $10 million and $200 million. NMFC's investment size is generally in the range of $10 million to $125 million.
NMFC maintains a diversified portfolio that has traded at a discount to NAV for the better part of two years now. Before continuing into further analysis, it may be helpful to explain more generally how BDCs (are supposed to) work.
About BDCs
Created by Congress in 1980, BDCs were designed to provide a source of capital for small-to-medium sized, usually private, businesses that would otherwise have trouble accessing traditional financing. BDCs typically invest in the debt or equity of these companies and are increasingly pitching themselves as value-add partners, advising the companies on strategic growth plans. In the case of debt investments, BDCs generate income by borrowing money from a major bank at a relatively low-interest rate and lending that money out to a portfolio company at a considerably higher rate (perhaps between 9% and 11%).
BDCs - like REITs - are required by law to distribute 90% of their taxable income as dividends to investors, making them attractive for income-focused investors. Since BDCs are publicly traded, they provide retail investors with access to privately held companies that would otherwise only be accessible to institutional investors. And since they're registered with the SEC, investors get a level of transparency not usually available to investors in traditional private equity or venture capital.
There are a lot of moving parts with BDCs - they may hold well over 100 companies in their debt/equity portfolios and often operate in niche markets or industries, some of which may be higher risk than others (and may be considerably higher risk than the S&P 500). Investors want to see BDCs generate enough annual income (called net investment income, or NII) from these assets to cover the annual dividend bill without having to dip into the asset base. A BDC investor would be wise to consider credit quality and debt-to-equity ratio in addition to all the normal things an S&P 500 equity investor might consider when analyzing an investment (the management team, general market conditions, etc.)
How I'm Analyzing NMFC
To analyze NMFC, I'll look at its recent performance, the characteristics of its lending portfolio, and the S&P 500 indices to make inferences about the company's performance in each sector.
Recent Performance
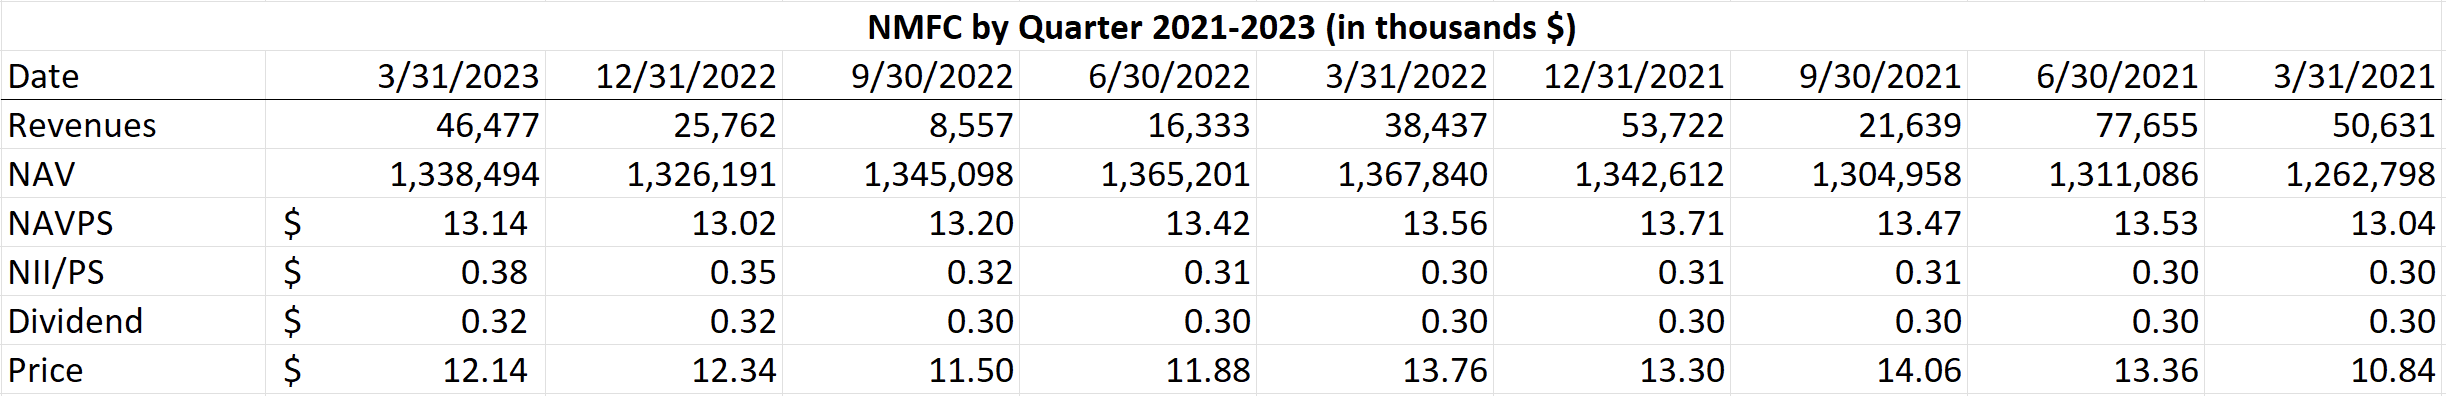
Some interesting things have gone on with NMFC the past two years - the company saw a substantial drop in revenue in 2022 as compared to 2021 (shown below) and saw a rebound in Q1 2023, up to $44 million from $25 million in Q4 2022. The drop in revenue in 2022 can likely be attributed to the lightening up of new loan originations due to the increased cost of borrowing in the market.
During this time, however, NMFC's NAV, NAVPS, and trading value have all remained relatively stable. In fact, NMFC is, at the time of writing (6/28/23), trading at a 7% discount to NAVPS and has spent the better part of the last two years trading right around NAVPS or at a discount.
NMFC Fundamentals (Created by author with data from NMFC SEC filings)
In the charts above, you can see that quarterly NAV remained relatively stable, not deviating by more than ~3.8% in any quarter. You can also see that NMFC has been trading relatively flat, hovering right around NAV despite the massive drop in revenue in 2022 and the stark rebound in early 2023. The stock is only up about .72% YTD, and about 2% TTM.
NMFC has traded flat even though it was able to cover its dividend payments with its net investment income every quarter in 2022 and again in Q1 2023. NMFC even raised its quarterly dividend from $0.30 to $0.32 for Q4 2022 and still had no trouble covering it.
With the raised dividend, NMFC is yielding a solid 9.95% and has again announced a $0.03 special dividend to be paid in Q2 2023.
So, in the last year or so, NMFC has maintained stable NAV and NAVPS, has been raising its dividends and covering them with its net investment income despite 2022's dip in revenue. For a BDC, where consistent income and a steady or increasing NAV are paramount, these are encouraging trends. NMFC's trading at a discount suggests that investors may be overlooking NMFC's otherwise solid fundamentals and income potential.
Breakdown by Investment Type
Next, I'll want to consider what's going on under the hood at NMFC to see if there is anything alarming here that might explain why NMFC continues to trade at a discount despite solid fundamentals and positive recent performance.
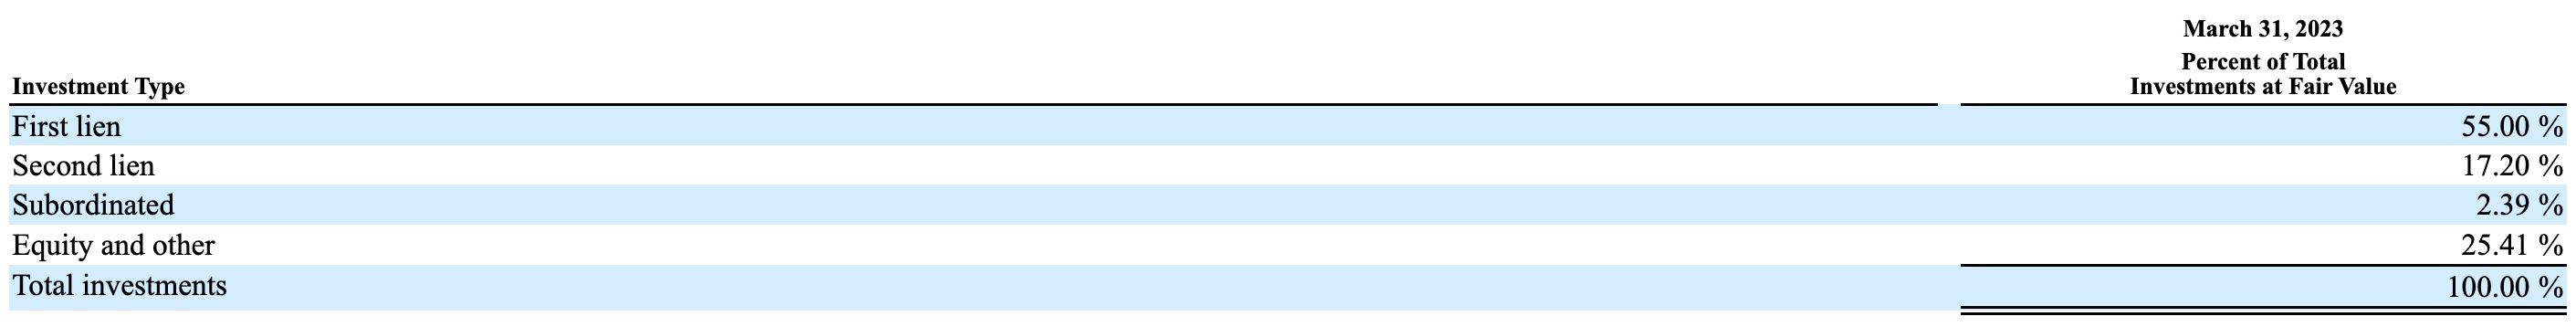
NMFC's type of investment as a percentage of its portfolio is shown in the table below. You can see that NMFC holds 55% of its portfolio in first lien debt, which is the most senior (read: safest) debt they hold (but again, not necessarily "safe").
NMFC Breakdown by investment type (NMFC Q1 2023 10-Q)
Consistent with its defensive investment thesis, NMFC holds 89% of its debt portfolio at a floating rate, meaning that NMFC will continue to avoid getting pummeled by rising interest rates and is likely to actually benefit. Such a high percentage of floating rate debt (in which the interest collected by NMFC from its portfolio companies rises as the prevailing rates rise) may be taking a toll on some of the companies, as NMFC reported a relatively high non-accrual ratio of 1.8% in Q3 and Q4 2022 and 1.7% in Q1 2023. The estimated fair value of the nine companies in non-accrual status at the end of Q1 2023 was just under $60 million.
That being said, NMFC is likely to come out ahead from the rise in interest rates. The defensive nature of its investments means that many of its portfolio companies likely do not rest on razor-thin margins and will be able to reasonably absorb the increased interest payments brought about by floating rate agreements with NMFC. After two down quarters of loan originations at the end of 2022, NMFC originated $46 million in loans in Q1 2023, indicating that NMFC again senses opportunity.
Interestingly, NMFC holds ~25% of its portfolio in "equity and other investments," of which about 14% (or $302.2 million, as reported by NMFC) is true equity. This gives NMFC exposure to considerable valuation upside. It is worth noting, however, that about 78% of the company's common equity position is tied up in just three companies: Edmentum, an online learning platform; UniTek, an infrastructure company; and Benevis, a dental services organization that entered Chapter 11 in 2020. Though NMFC reports their loans to each of these companies as healthy, I'm not terribly optimistic about their equity positions in each.
Finally, I note that, as of 3/31/23, NMFC values the cost of its portfolio at $3.333 billion versus the portfolio's estimated fair market value of $3.287 billion, good for a coverage ratio of 98.6%. Ideally, the cost of the portfolio would be less than the portfolio's fair value, but 98.6% coverage is not a disaster. I will be closely monitoring this metric and would become concerned if the ratio continues to creep away from 1.
Next, I'll estimate portfolio performance to determine if there are any specific holdings or industries that I am worried about having adversely affected NMFC during the quarter.
Portfolio Analysis in Between Reporting Periods
Since NMFC doesn't report Q2 results for another few weeks, I want to estimate the fair values they'll announce in their next quarterly report. This method assumes that BDC performance can be roughly linked to the performance of industry and sub-industry S&P 500 indexes, and essentially involves tracking the indexes of the industries held in the BDC portfolio and calculating betas to estimate the fair value (read: performance) of the BDC's holdings during the period.
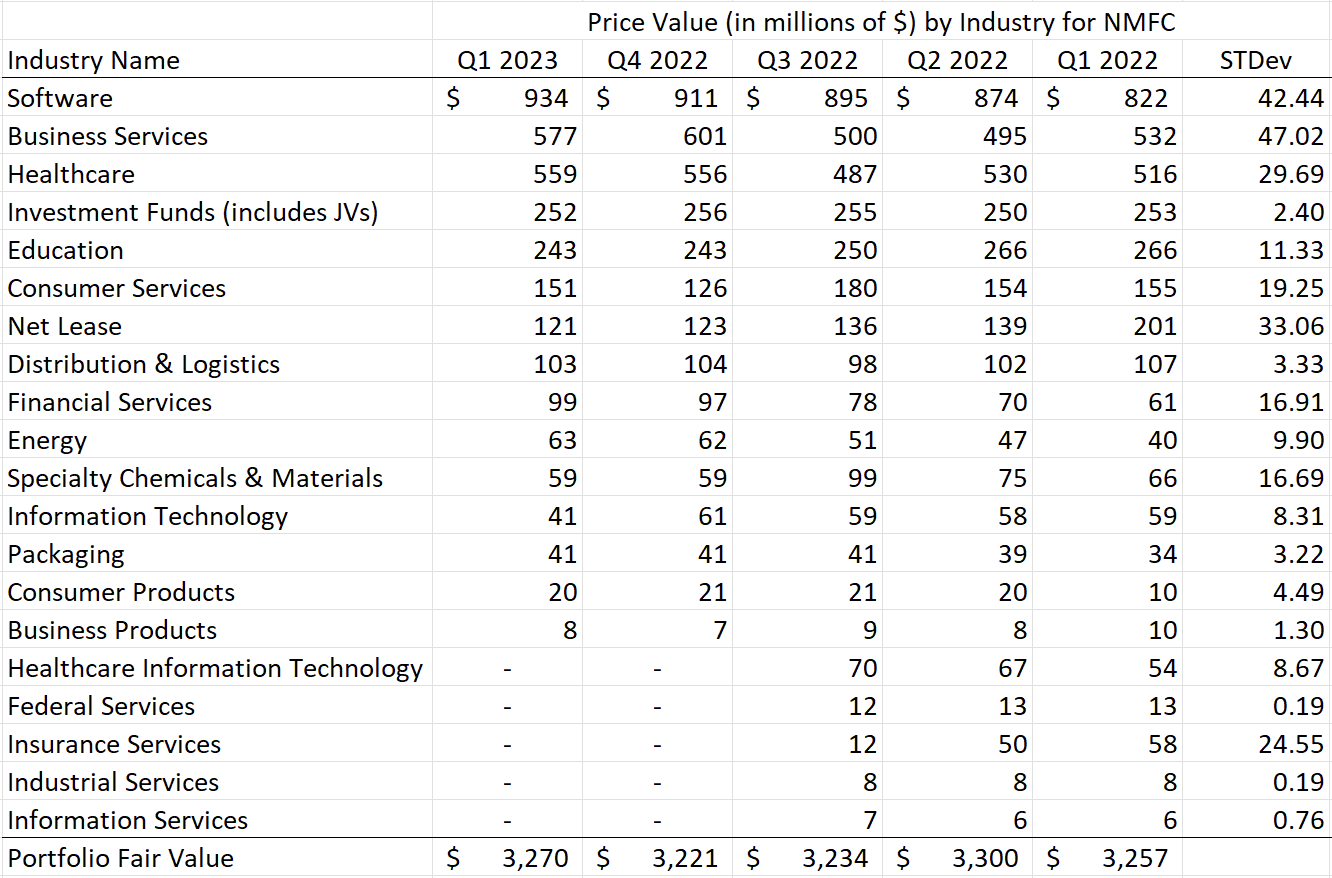
Industry breakdown expressed as price levels (Created by author with 10-Q data)
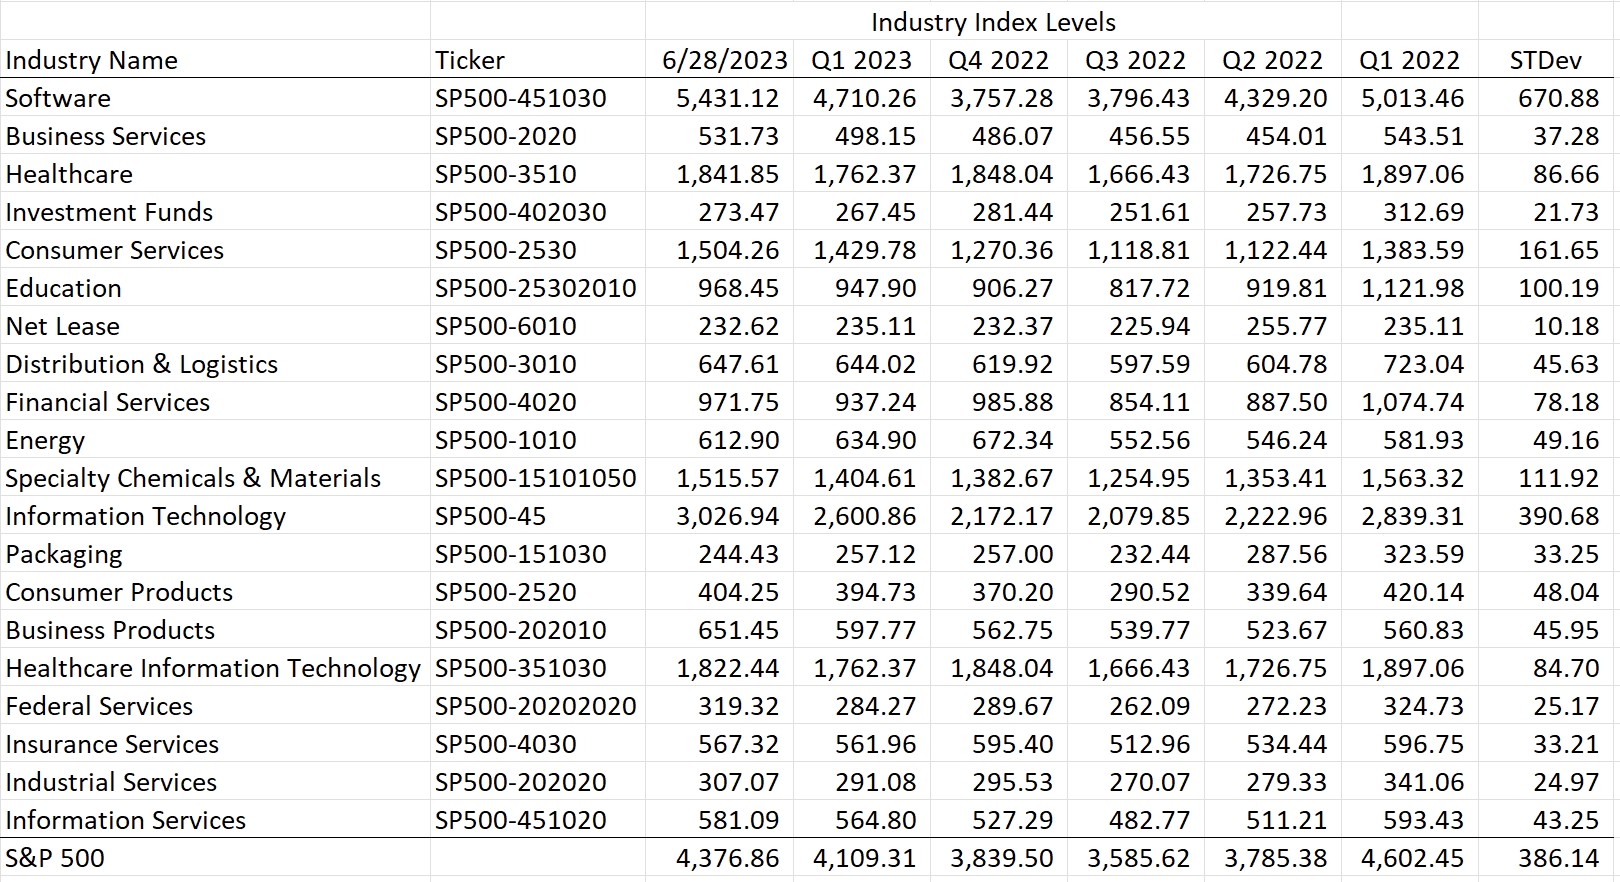
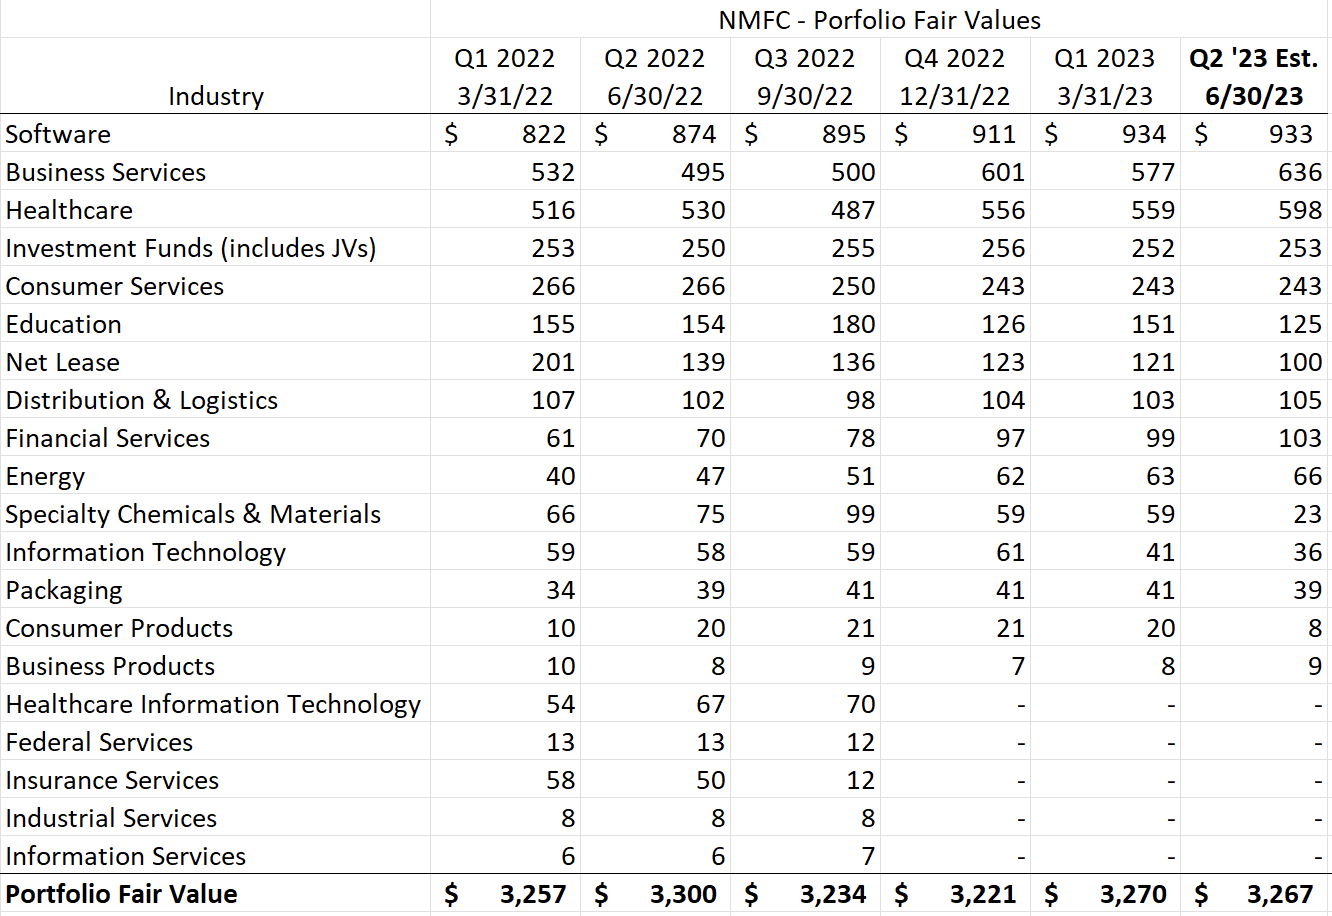
First, I calculated the fair values of the holdings in each industry in the NMFC's portfolio (shown above). Some firms report dollar amounts, but NMFC reports these figures as a percentage of total portfolio fair value, so I had to calculate these values. I then retrieved price levels from the corresponding S&P 500 industry or sub-industry index for the corresponding period (shown below). I want to compare how the industry performed in the BDC's portfolio to how it performed at the macro level.
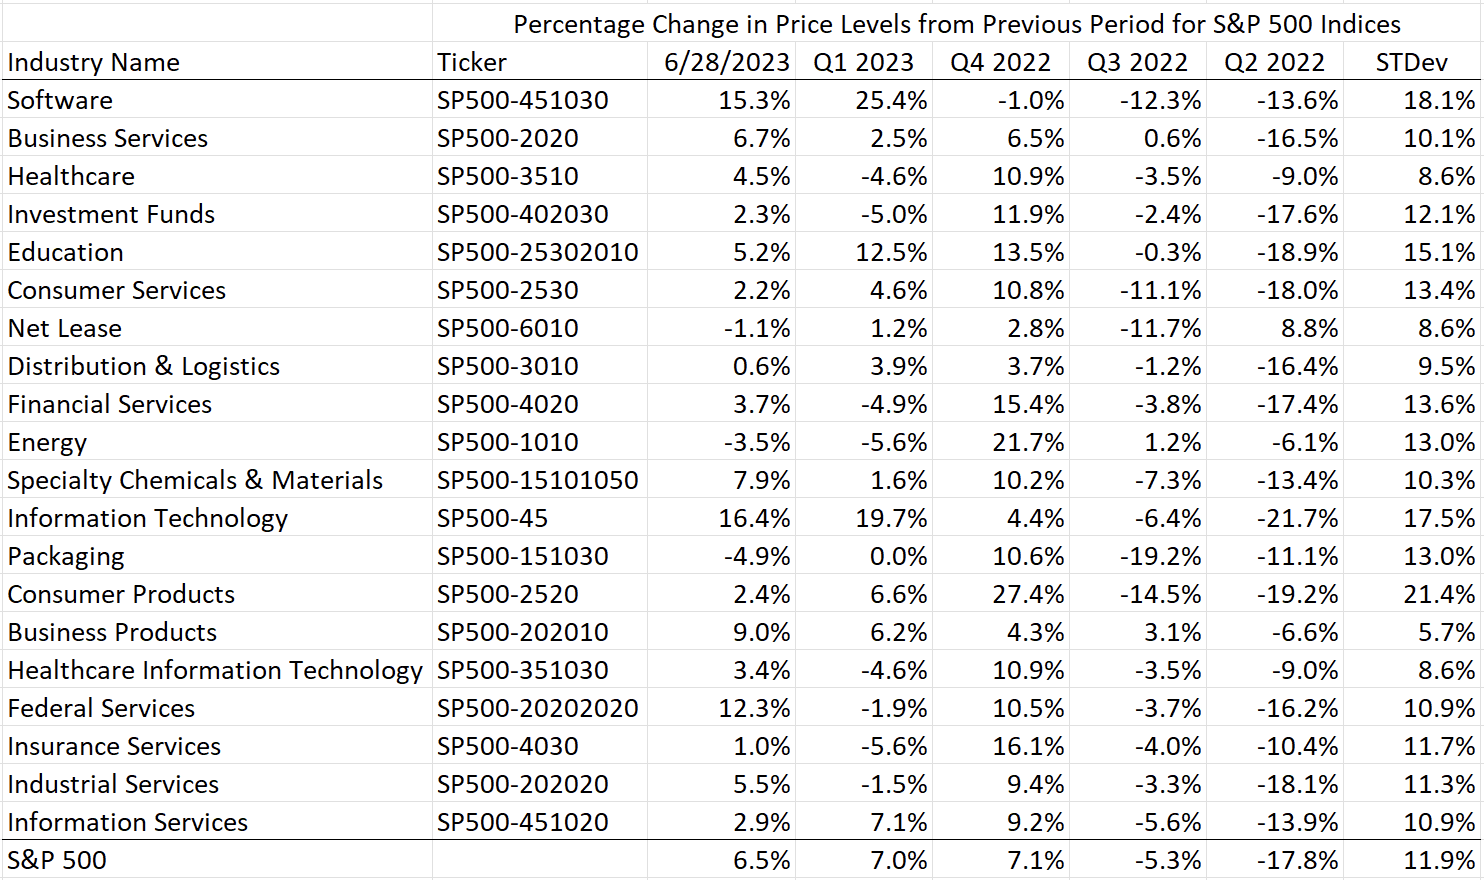
S&P 500 industry & sub-industry price levels (Created by author using S&P 500 index data from Yahoo! Finance)
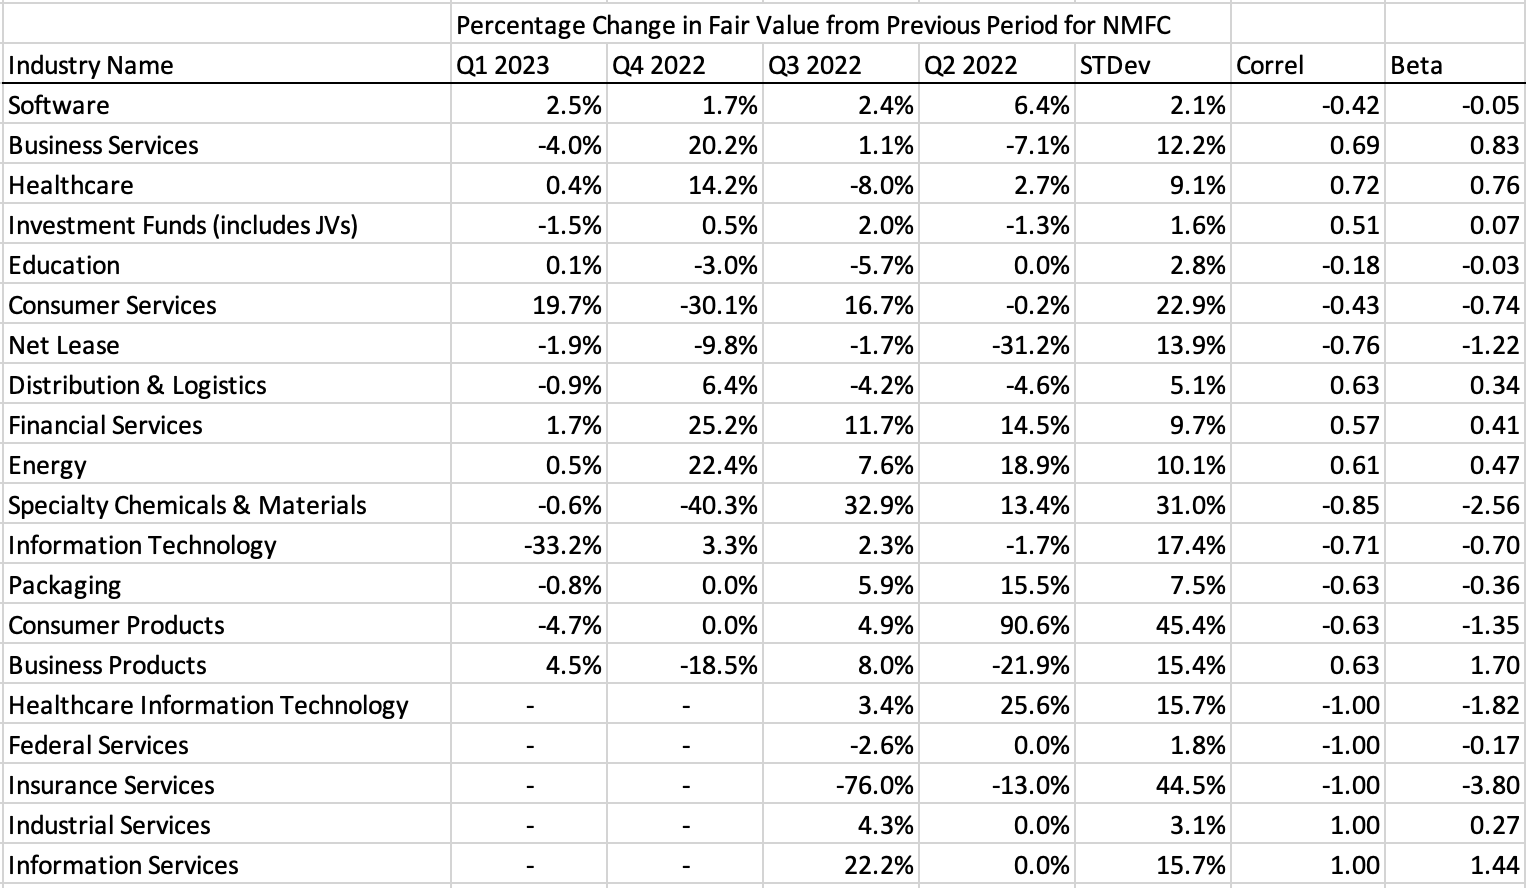
I then calculated percent changes from the previous period for each industry as it exists in a) NMFC's portfolio and b) the S&P 500 industry indices. I also calculated standard deviations and a correlation score between the BDC and S&P 500 index percent changes in order to estimate a beta value.
Percentage Change in Price Levels from Previous Period for S&P 500 Indices (Created by author with data from Yahoo! Finance) Percentage Change in Fair Value from Previous Period for NMFC, Correlation to S&P 500, Beta ((Created by author with data from Yahoo! Finance))
From there, I multiplied the beta by the standard deviation that corresponds to the industry performance in the NMFC portfolio, arriving at the percentage change that we might expect the fair value of NMFC's industry holdings to go up or down by. Using NMFC's software industry holdings as an example, I might expect the fair value to decrease by .10% in any given period (2.1% STDev * -0.05ß = -.10%)
Then I took the last reported fair value and multiplied it by the expected percent change. For NMFC's software industry holdings, the calculation would be $934m * (1+ -.10) = $933m. Based on this analysis, I might expect the fair value to only decrease by about $1 million.
NMFC - Estimated Portfolio Fair Values (Created by author using data from NMFC SEC filings, data from Yahoo! Finance)
We'll carry that the whole way through and arrive at an estimated fair value of $3.267 billion for NMFC's entire portfolio, a decrease of about .10% or $3 million dollars from the end of Q1 2023. That's obviously not much movement and is probably a rounding error in terms of NMFC's entire portfolio. More on how I'm interpreting this in a bit.
Issues with this Technique
There are a few caveats to keep in mind with this technique, particularly around beta interpretation. To start, remember that beta is all about measuring market risk for different industries. The mid-sized companies in NMFC's portfolio (or any BDC's portfolio, for that matter) are smaller and operate differently than their larger counterparts in the S&P 500. As a result, they might not reflect broader market trends as accurately.
Additionally, it's generally not advisable to only consider four data points when calculating beta, as the beta can be materially thrown off by one-time aberrations in the portfolio. A thorough analysis should consider many data points over a period certainly longer than one year - ideally long enough to capture bull and bear market behavior.
Finally, it's important to factor in the company's investment strategy. For NMFC, which prefers investing in defensive companies and has a sizable chunk of its portfolio in first-lien debt (the safest type of debt a BDC will invest in, though "safe" here is relative) and about 25% in equity and other investments, this consideration is especially crucial. These aspects might lead to some intriguing beta results. Defensive investments and first-lien debt may nudge the beta closer to zero, while equity investments could push the beta above 1.
Interpreting Estimated Fair Value Between Periods
Keeping in mind the concerns listed above, I generally use this technique only to sense whether there may have been dramatic fluctuations in the portfolio's fair value during the period. This quick-and-dirty technique, especially when only four points are used to calculate beta, shouldn't be used to make precise estimates about fair value. This technique is more likely to sense dramatic movements and provide insight as to the general direction of the portfolio's fair value.
Considering that this technique estimated a minuscule change in the overall fair value of the portfolio, I will say that I am not especially concerned about the fair value deviating substantially from its current value. Had my analysis resulted in a deviation of, say, 5% or more in either direction, this would catch my attention and warrant deeper consideration of what is going on in the portfolio.
Risk Discussion
As touched on earlier, the general BDC business model does not exactly make BDCs the safest instruments on the market. There are a few considerable risks at play that could upend NMFC's recent history of maintaining a stable NAVPS and covering dividends. They include the following, not necessarily in order:
- Floating rate agreements that really squeeze the companies in NMFC's loan portfolio. A high interest rate environment theoretically benefits NMFC, but not if rates climb too high or stay too high for too long. An extended period of high interest rates could eventually hurt NMFC's portfolio companies enough that they become delinquent and require markdowns and/or restructurings (though, NMFC likely wouldn't loan to companies it thought might flame out in a high interest rate environment)
- The coverage ratio could continue to trend in the wrong direction, for any reason (systematic or nonsystematic).
- The three companies that make up a substantial portion of the firm's equity investment could suffer and have an outsized effect on the rest of the portfolio.
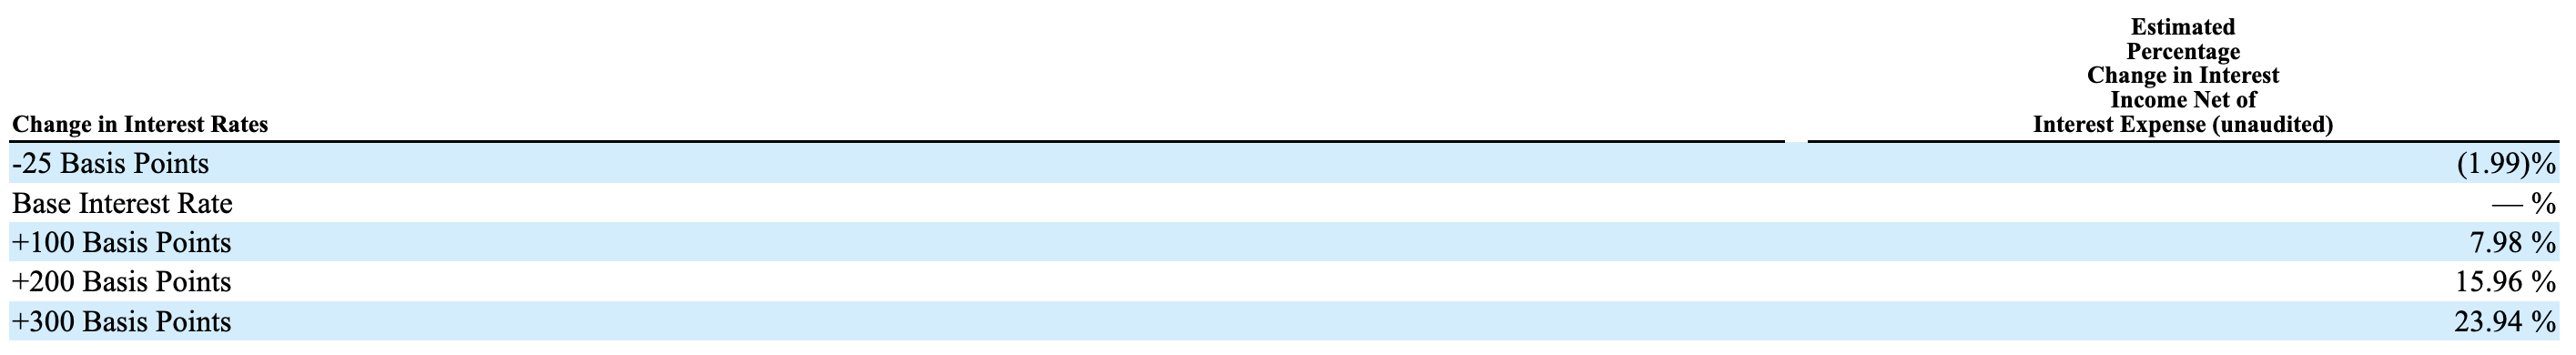
- Any period of easing by the Federal Reserve will decrease NII, perhaps to the point of NMFC needing to adjust its dividend strategy. NMFC states this clearly in their 10-Q (shown below). Remember that NMFC needs interest rates to be high enough to boost NII but not so high that they crush business in its portfolio companies.
NMFC estimated effect of interest rate changes (NMFC Q1 2023 10-Q)
Conclusion
NMFC has certainly done well to pick up the slack in a relatively quiet traditional lending environment, though the firm's strong recent yield and NII coverage performance aren't enough to keep it from trading at a discount to NAV. Perhaps some investors are unsettled by what they perceive as loans and equity investments of middling quality, the company's < 1 coverage ratio, or a total reliance on a high interest rate environment, despite the steady NAV and revenues and loan originations tracking toward the firm's 2021 levels. While I will monitor each of these concerns about NMFC's business and might be more concerned if I were interested in holding NMFC long term, I do not believe these issues are severe enough to significantly damage NAV or prevent NMFC from covering its dividend with NII in the near future. Thus, I think NMFC currently presents a strong value opportunity and would consider the stock a buy right up until we see price/book around .97, as we haven't seen NMFC rise significantly above that level in a while.
For further details see:
New Mountain Finance: A BDC Value Buy