QVMM - New Volatility Lows For 2023 Indicate A Coming Overdue Small Correction
2023-11-27 23:45:00 ET
Summary
- While I have seen the VIX fall under 10 in more normal times, I don’t believe the present times could be considered normal.
- Why do I think this correction would be small? Because investors have been looking for dips to buy and dips have not been coming this month.
- The market will likely make further gains by the end of the year, if the present situation does not escalate past its elevated status and we don’t see truly bad economic data.
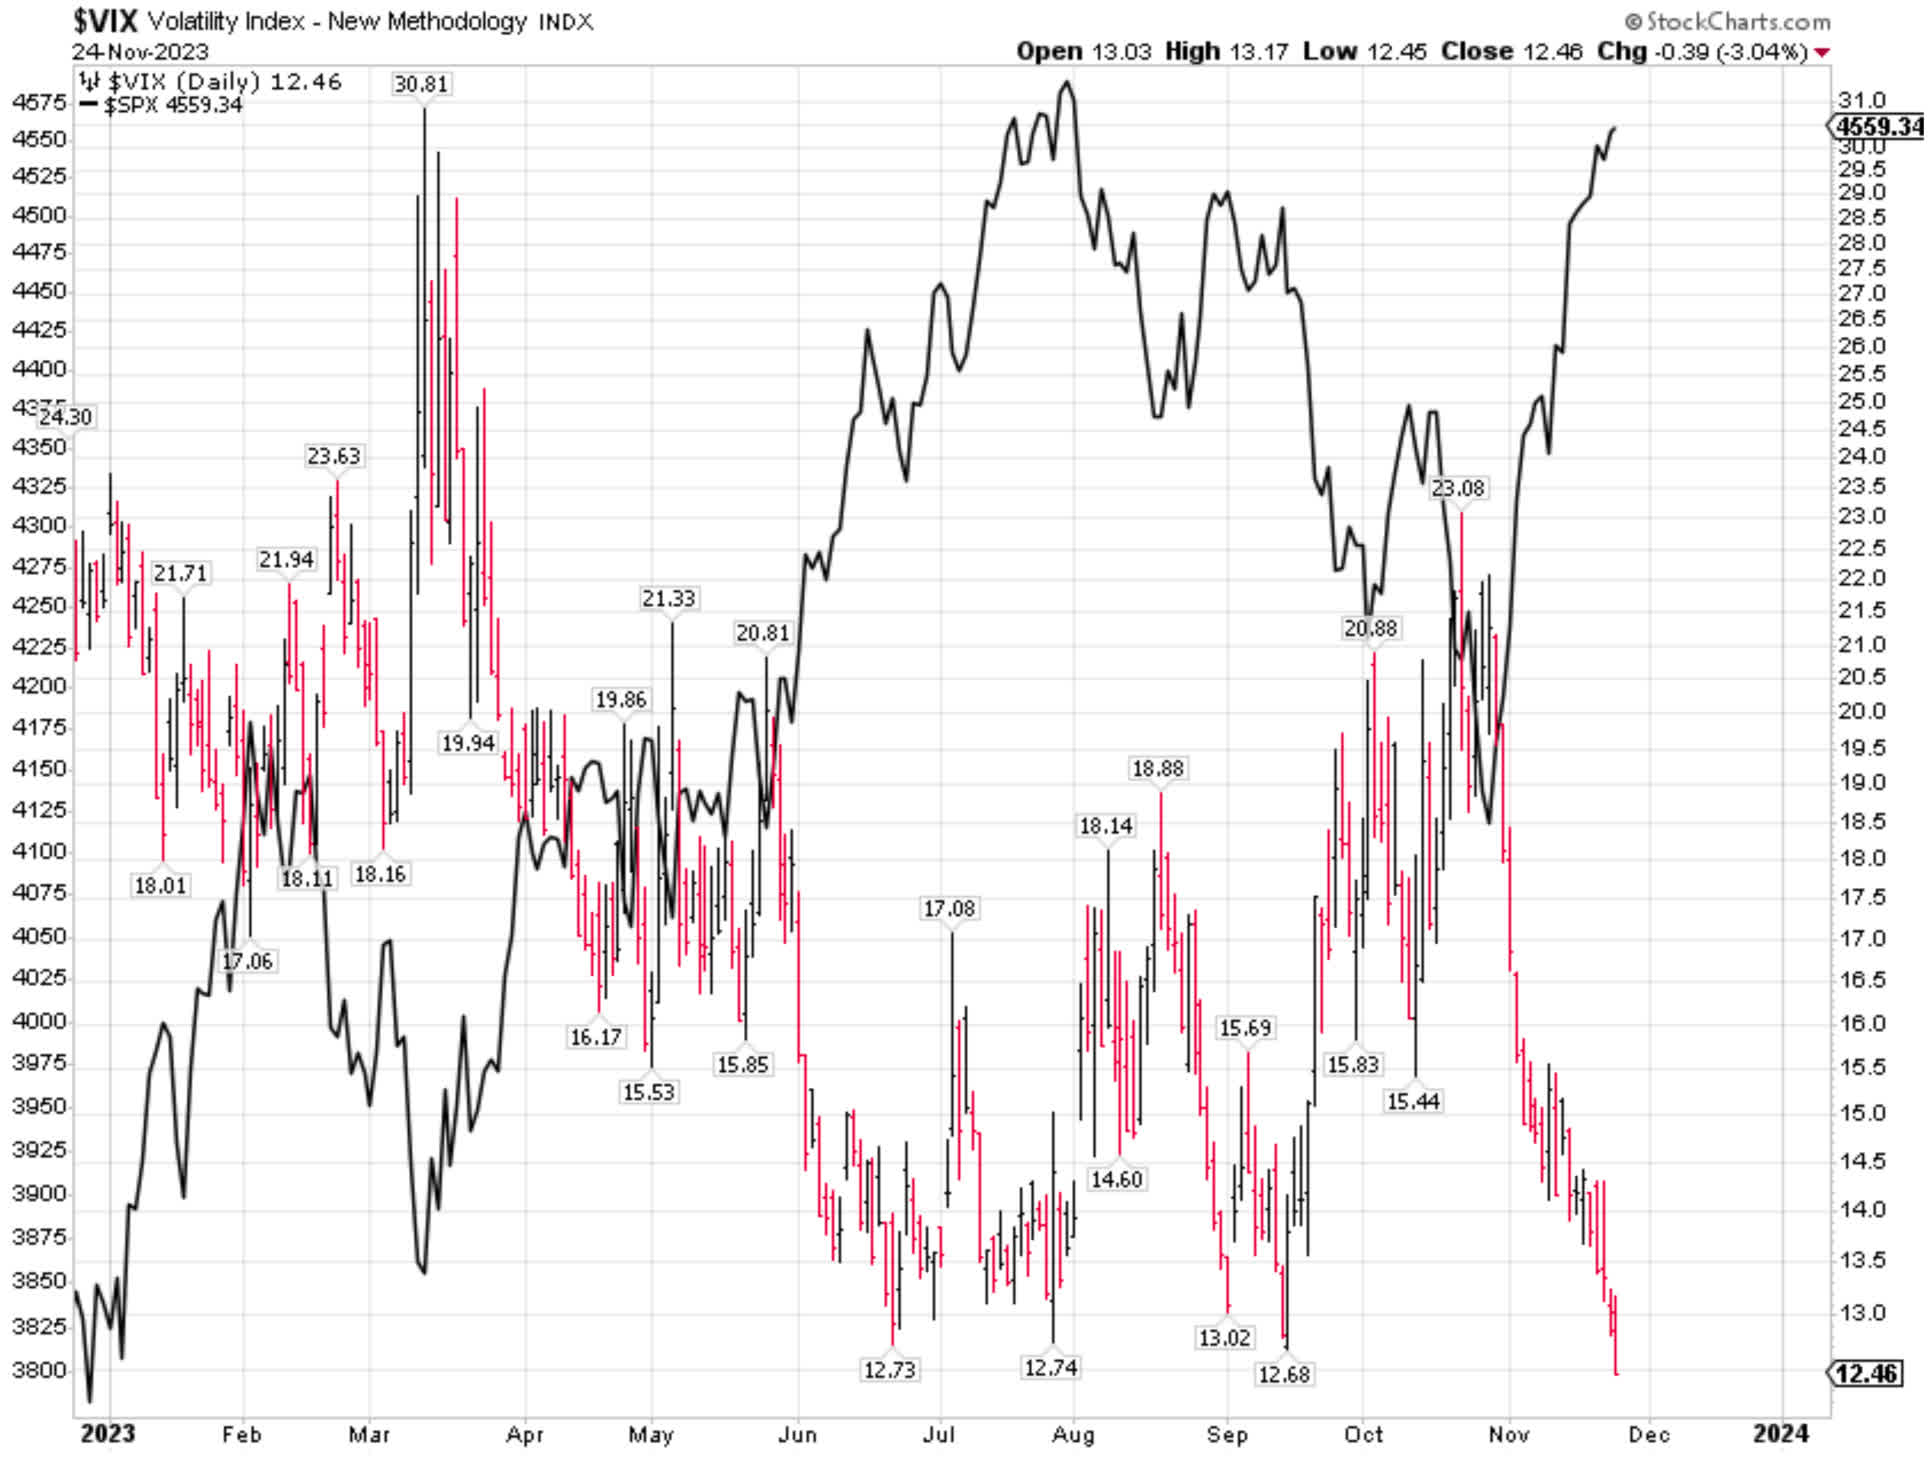
The VIX (market volatility index) closed on Friday at 12.46, one tick above its annual low for 2023.
While I have seen the VIX fall under 10 in more normal times, I don’t believe the present times could be considered normal. We have a war in the Middle East, another war in Europe, and an economy that has endured the fastest rate-hiking cycle in 40 years.
Also, November has seen a sharp market rise, with no corrections, and there are signs of rotation out of the technology sector, which is arguably overstretched.
Since the tech sector is home to the biggest mega-cap stocks, which have driven the market’s gains this year, a tech correction would provide enough gravitational pull to push the indexes a little lower.
Why do I think this correction would be small? Because investors have been looking for dips to buy and dips have not been coming this month. This is the time of the year to chase performance, but the rubber band has been stretched too far to the upside.
As I write, on Sunday, I am not looking for anything more than 1-3 days of a pullback, most likely concentrated in the technology sector. The market will likely make further gains by the end of the year, if the present situation does not escalate past its elevated status and we don’t see truly bad economic data, other than the more benign slowdown we have seen of late.
Graphs are for illustrative and discussion purposes only. Please read important disclosures at the end of this commentary.
In the chart above, it is surreal to see how the present VIX levels correspond to an S&P 500 correction of one, three or six weeks. While there are no guarantees in this business, I don’t believe any selling will last more than a week, if that.
Long-term investors should not really worry about an overdue pullback, but experience tells me that investors like to put money to work on pullbacks, and they don’t like buying near the high ticks, even though that happens more often than not.
The present rally is more extreme than anything we saw in June/July, as November has delivered the same magnitude of gains in half the time, but without any meaningful pullbacks.
Simply put, a normal pullback is overdue. The smallest of the prior three corrections in June was about 120 S&P points. This magnitude of a pullback is possible, but because of the seasonally strong time of the year, we may not even get that.
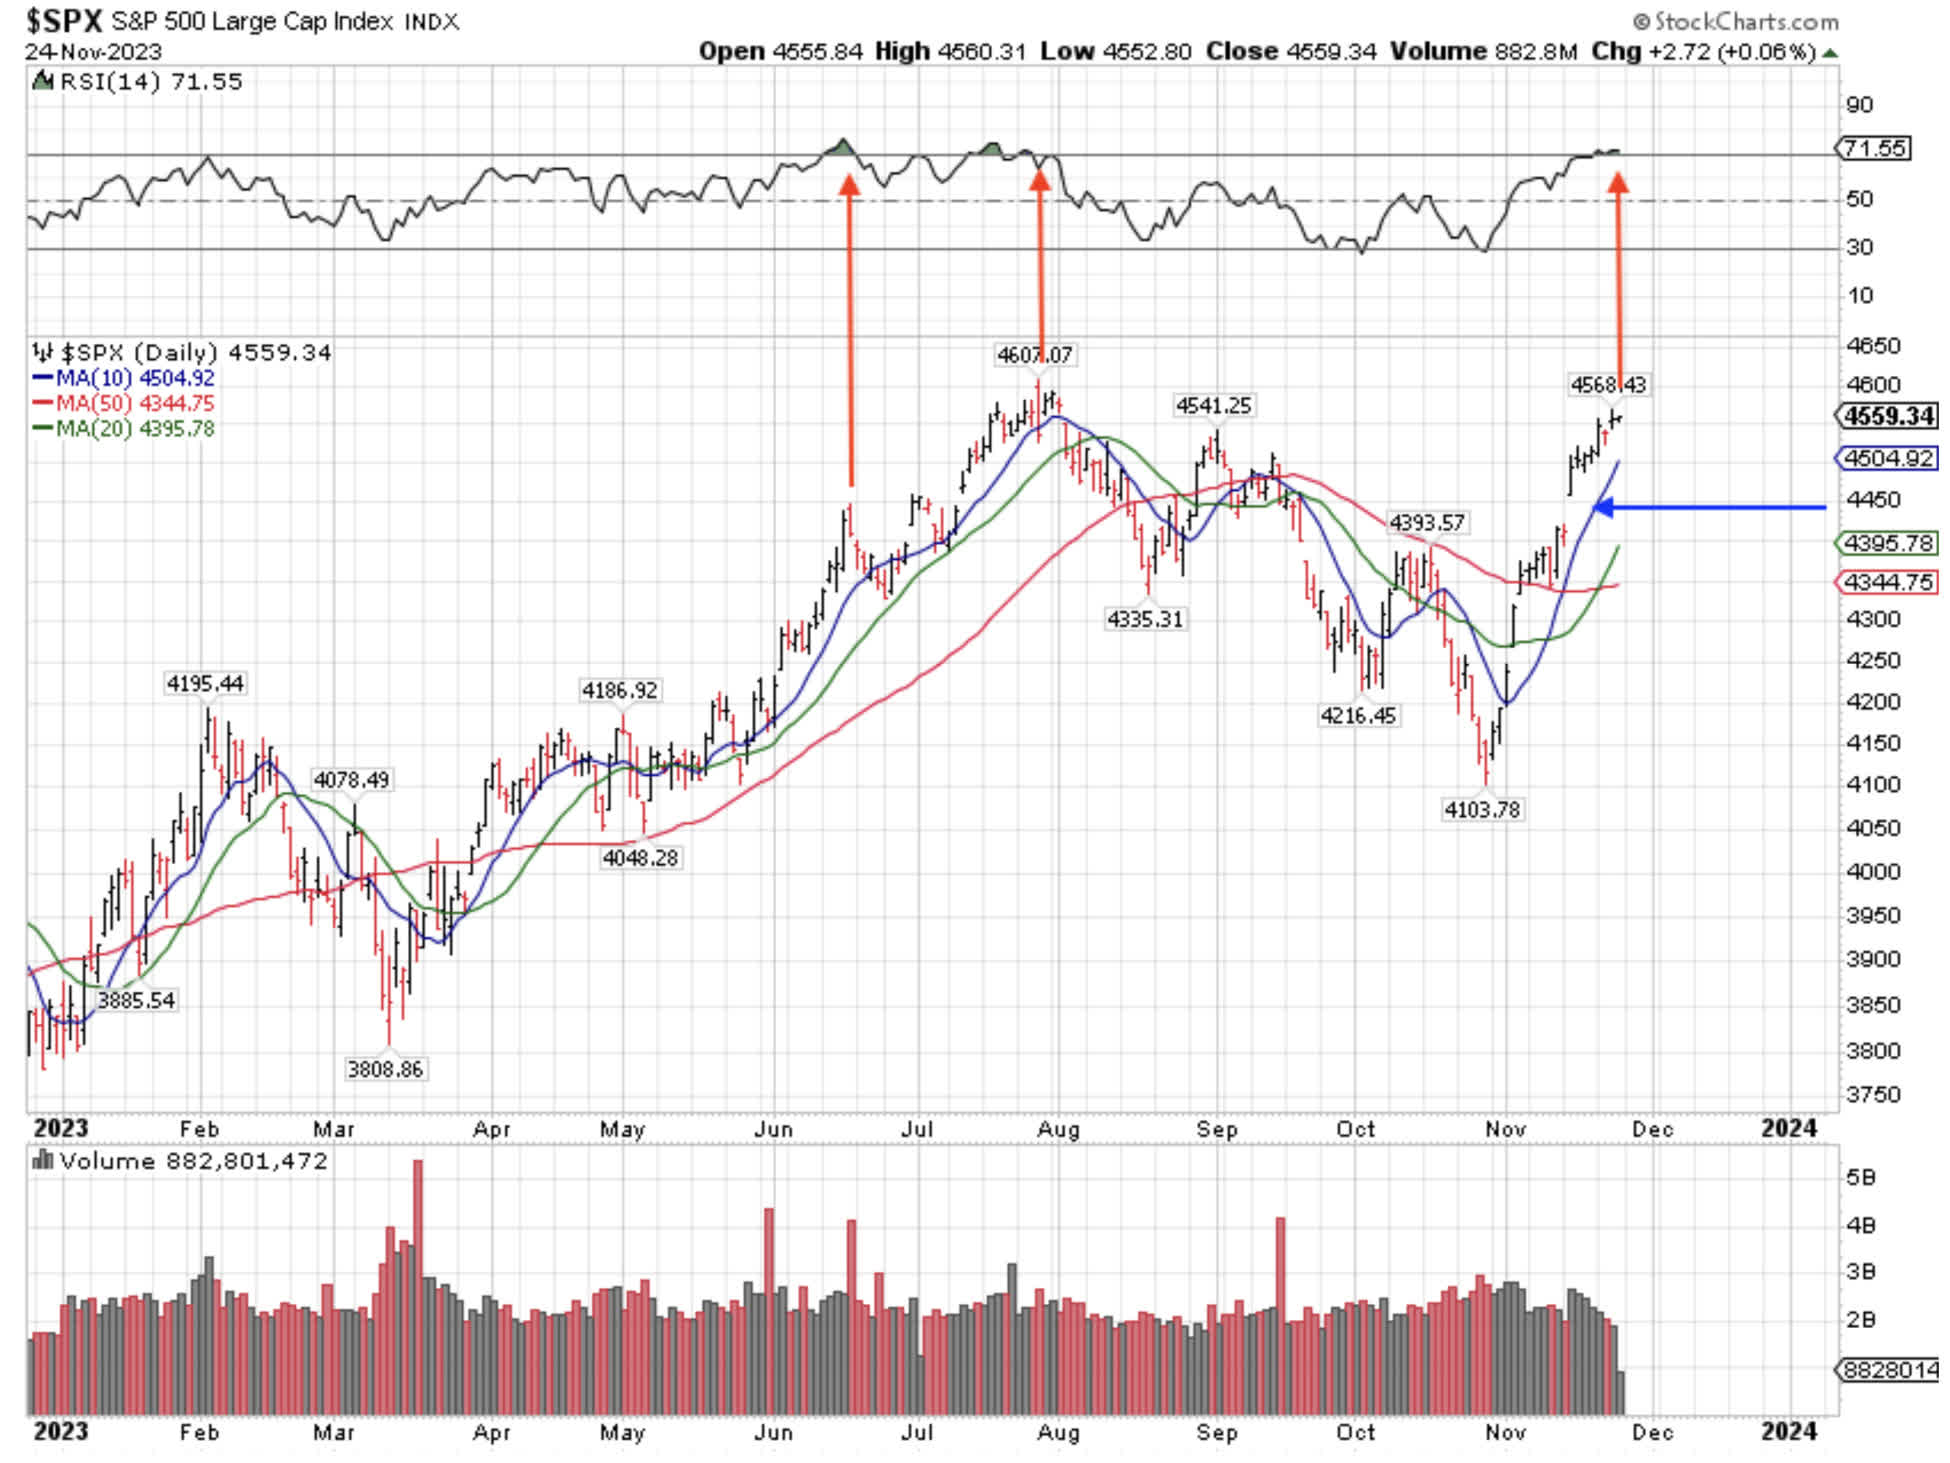
In addition to the Bollinger Bands I mentioned last week, another indicator of being overbought is the more commonly used Relative Strength Index ((RSI)).
RSI is near the same level we saw in the first and smallest such correction that corresponds to the same VIX level I described earlier.
Note (below) that RSI doesn’t stay above 70 for very long without a pullback, nor does it stay below 30 long without a rebound.
Graphs are for illustrative and discussion purposes only. Please read important disclosures at the end of this commentary.
RSI is an oscillator, and as such it offers no guarantees, but rather an indication that a pullback is overdue. Plus, we have way too many gaps in the rally.
Some traders say that all gaps are meant to be filled, but they don’t often say that sometimes they aren’t filled right away and many times it takes a while to do so.
The only truly suspicious gap that begs to be filled, is the gap above S&P 4430 on the cash index, which would correspond to the smallest S&P 500 correction in a similar setup we saw in mid-June.
Any correction at this point would be normal. Actually, as I mentioned last week, if you get a correction, it may actually mean that the market will ultimately rise further later on, as it will be a more sustainable rally. As things stand right now, going straight up with many gaps and no normal pullbacks is not healthy.
All content above represents the opinion of Ivan Martchev of Navellier & Associates, Inc.
Disclaimer: Please click here for important disclosures located in the "About" section of the Navellier & Associates profile that accompany this article.
Disclosure: *Navellier may hold securities in one or more investment strategies offered to its clients.
Editor's Note: The summary bullets for this article were chosen by Seeking Alpha editors.
For further details see:
New Volatility Lows For 2023 Indicate A Coming Overdue Small Correction