AEM - Newmont: A Solid Gold Miner Facing Strong Headwinds
2023-03-09 10:53:00 ET
Summary
- Despite a revenue beat, Newmont Corporation Q4 2022 earnings results slightly missed analysts' expectations this quarter.
- Newmont's attributable gold production in the fourth quarter increased slightly year over year to 1.630 Moz compared to 1,618 Moz last year.
- I recommend accumulating Newmont Corporation on this weakness between $41 and $42, with possible lower support at $39.75.
Introduction
Newmont Corporation ( NEM ) released its fourth-quarter and full-year 2022 results on February 23, 2023.
Note: This article is an update of my article published on September 26, 2022. I have followed NEM on Seeking Alpha since Dec. 2014.
1 - Fourth Quarter of 2022 Highlights
Despite a revenue beat, the 4Q22 earnings results slightly missed analysts' expectations this quarter.
NEM Balance sheet metrics (NEM Presentation)
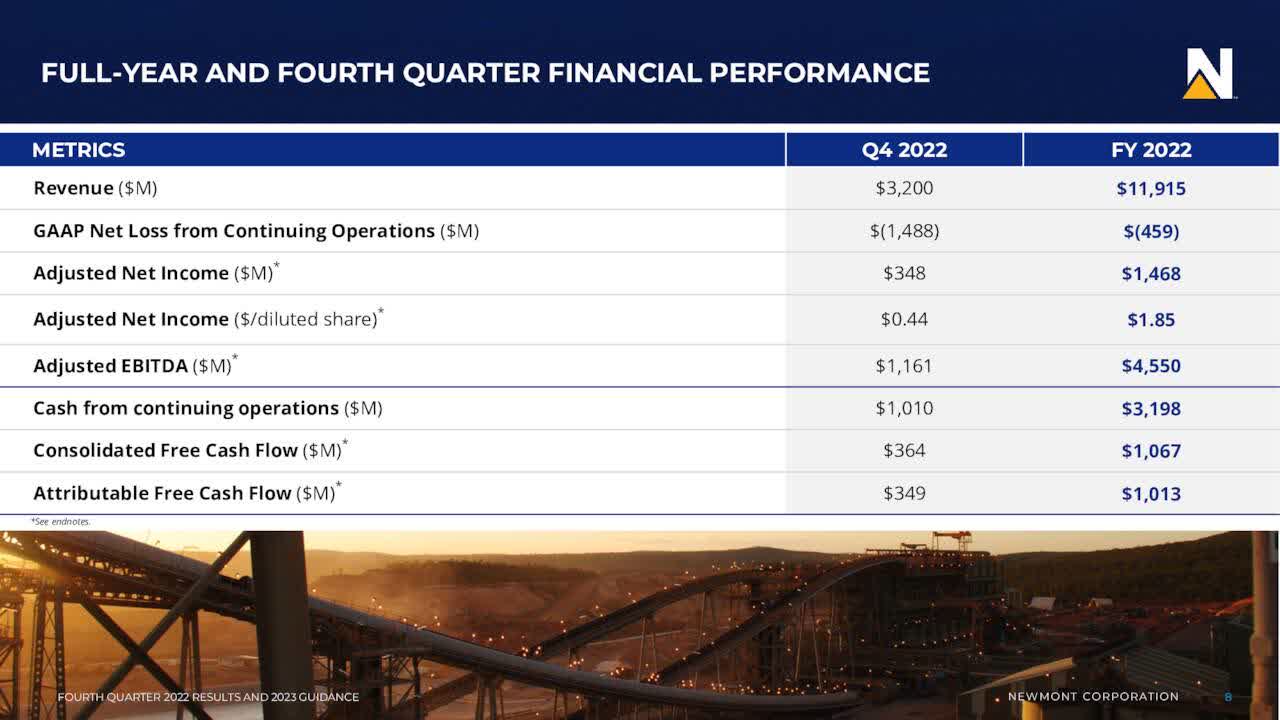
NEM reported a net loss from continuing operations of $1,447 million or $1.86 per diluted share in the fourth quarter of 2021, compared to a loss of $46 million or $0.06 per share last year. The adjusted earnings were an income of $0.44 per share.
Newmont reported revenues of $3,200 million, down from $3,390 million in 4Q21 or 5.6% year over year.
Liquidity was strong in 2022, ending with $3,757 million of consolidated cash ( $829 million of short-term time deposit) and approximately $6.7 billion of liquidity; reported net debt to adjusted EBITDA of 0.5x.
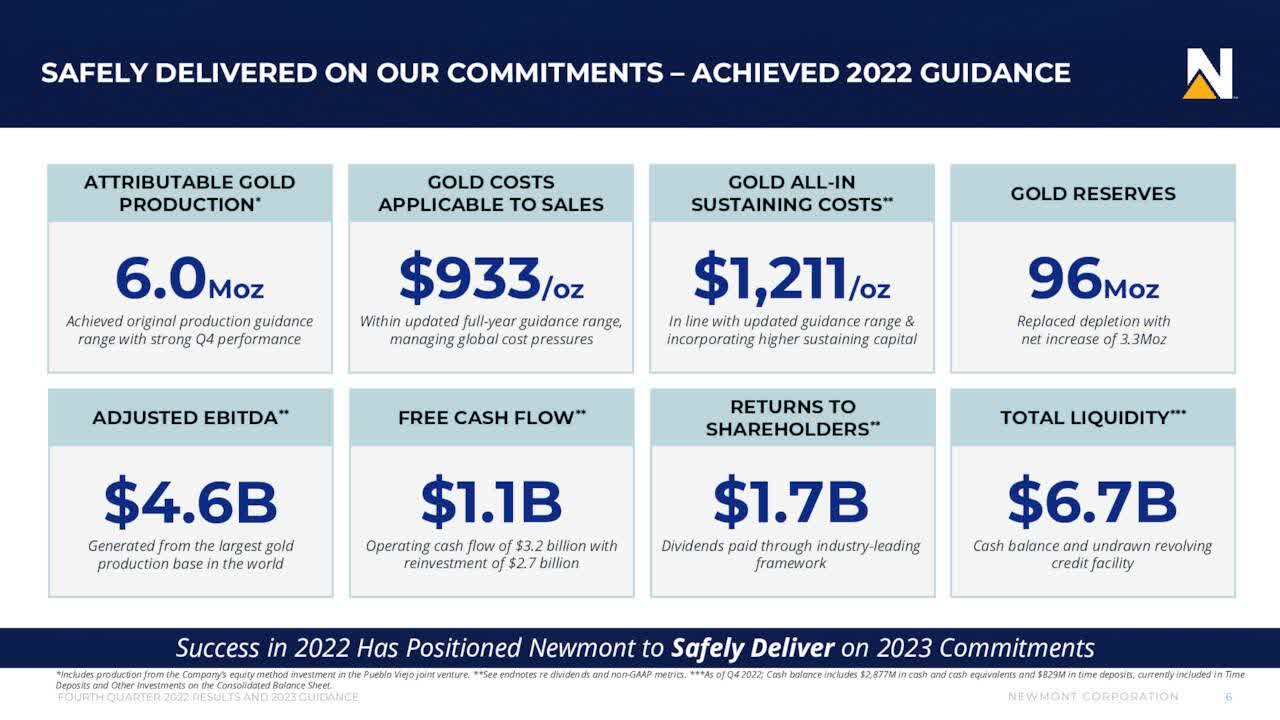
Reserves for 2022 were set at 96 Au Moz, and resources at 111 Au Moz, with significant upside from other metals, including copper, silver, lead, and zinc.
Newmont's attributable gold production fell roughly 1% year over year to 1.344M ounces in the quarter or 1.694 Moz GEOs.
Newmont Corporation achieved 2022 guidance with a 2022 free cash flow of $1.1 billion.
NEM 2022 Highlights (NEM Presentation)
CEO Tom Palmer said in the conference call:
Newmont finished the year with a strong fourth quarter, leveraging our scale, our teams and our unmatched portfolio of world class assets to deliver industry-leading ESG, operational and financial results. We are well positioned to continue leading the sector, whilst remaining firmly grounded in our values and driven by our purpose to create value and improve lives through sustainable responsible mining.
2 - Let's Compare Gold Production in 4Q21 and 4Q22 Per Mine
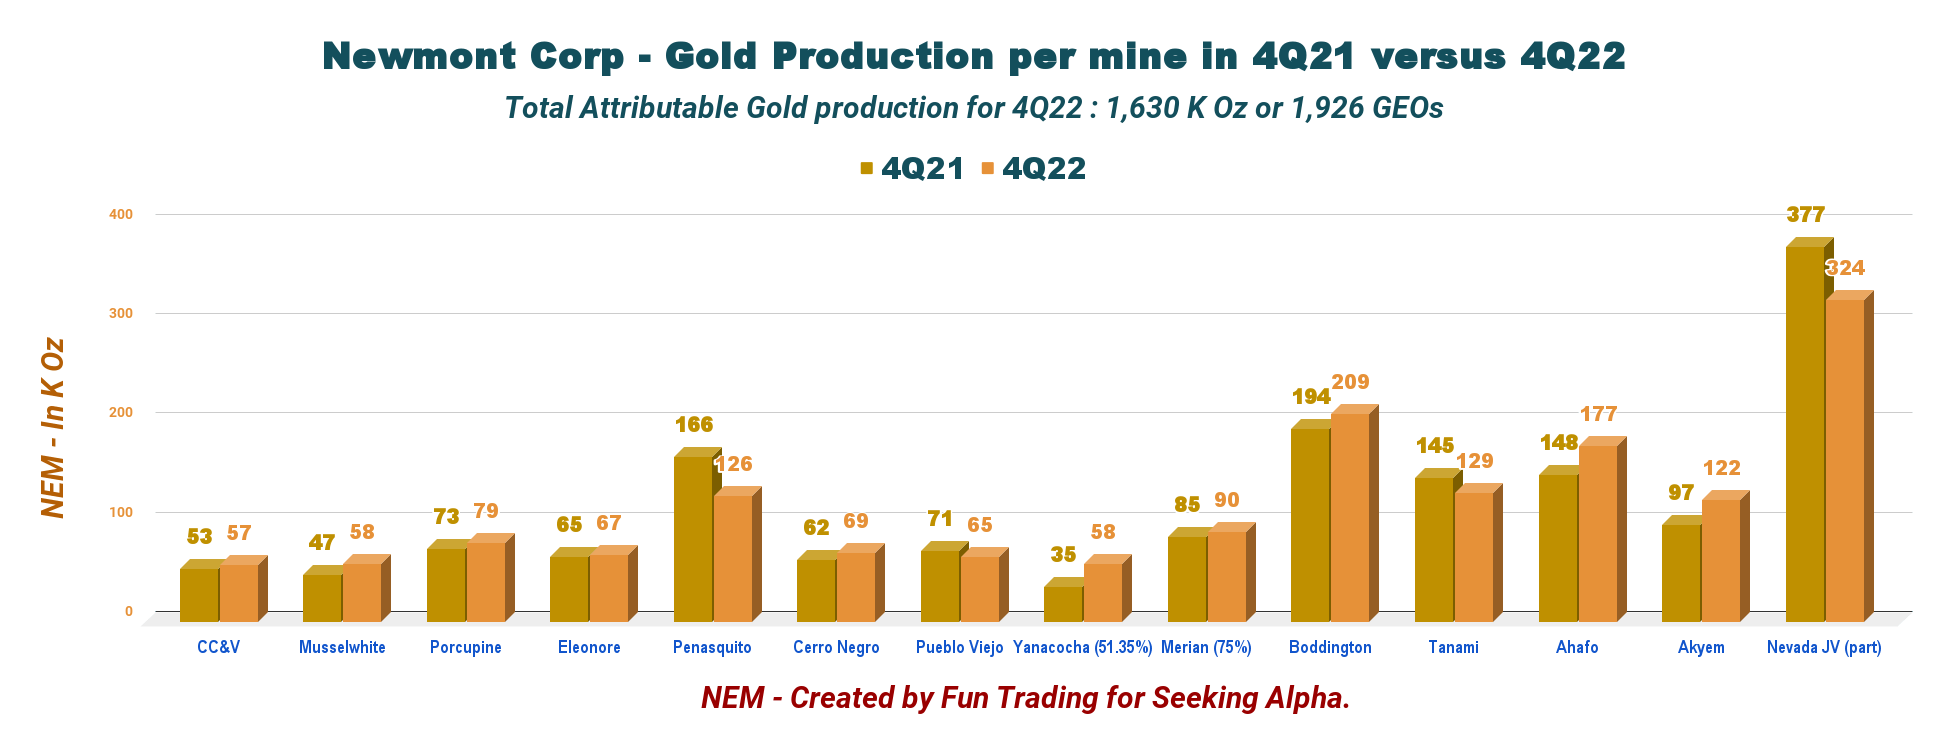
Newmont's attributable gold production in the fourth quarter increased slightly year over year to 1.630 Moz compared to 1,618 Moz last year. NEM sold 1,610 Moz of Gold or 1.921 M GEOs. Below is a chart of comparative production per mine year over year.
NEM Quarterly Gold production per mine 4Q21 versus 4Q22 (Fun Trading)
3 - Stock Performance
Newmont Corp. is part of my long-term selected gold miners with Barrick Gold ( GOLD ), Agnico Eagle ( AEM ), and Kinross Gold ( KGC ). Newmont has underperformed the group and the VanEck Vectors Gold Miners ETF ( GDX ) on a one-year basis.
NEM is down nearly 46% on a one-year basis, making it the worst performer by a large margin. As we can see, the recent hawkish stance from Jerome Powell took a severe toll on the gold sector.
4 - Investment Thesis
Despite its dismal performance and lower dividend payout, Newmont is still one of my long-term gold miners.
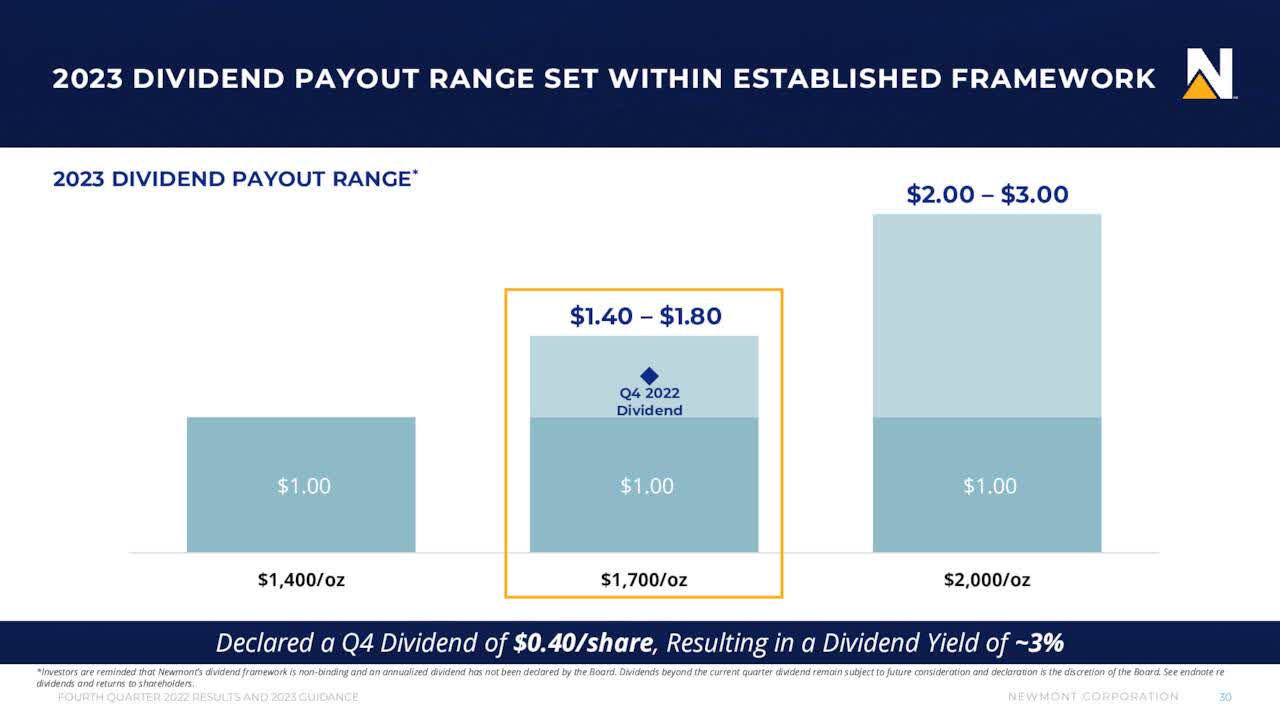
The dividend policy is unambiguous and allows even higher dividends depending on the gold price level. The quarterly dividend is now down to $0.40 per share but could increase as high as $0.935 per share, with gold at $2,100 per ounce.
NEM Dividend payout (NEM Presentation)
Gold prices fell to their lowest in over a month yesterday, weighed down by a stronger dollar as better-than-expected U.S. economic data boosted concerns the Federal Reserve could hike interest rates further. On March 7, 2023, Jerome Powell scared the market :
Powell pointed to a tight labor market, solid consumer spending, manufacturing production, and higher-than-expected inflation data.
Thus, trading short-term LIFO about 30% to 35% of your long-term NEM position is vital to take advantage of the gold price volatility, which is here to stay for 2023.
Newmont: Financials and Production History ending in 4Q22. The Raw Numbers
| Newmont |
| 3Q21 |
| 4Q21 |
| 1Q22 |
| 2Q22 |
| 3Q22 |
| 4Q22 |
| Total Revenues in $ Billion |
| 2.90 |
| 3.39 |
| 3.02 |
| 3.06 |
| 2.63 |
| 3.20 |
| Net income in $ Million |
| 3 |
| -46 |
| 448 |
| 387 |
| 213 |
| -1,477 |
| EBITDA $ Million |
| 565 |
| 198 |
| 1,237 |
| 1,024 |
| 859 |
| -759 |
| EPS diluted in $/share |
| 0.00 |
| -0.06 |
| 0.56 |
| 0.49 |
| 0.27 |
| -1.86 |
| Cash from operations in $ Million |
| 1,144 |
| 1,299 |
| 694 |
| 1,043 |
| 473 |
| 1,010 |
| Capital Expenditure in $ Million |
| 398 |
| 441 |
| 437 |
| 519 |
| 529 |
| 646 |
| Free Cash Flow In $ Million |
| 746 |
| 858 |
| 257 |
| 524 |
| -56 |
| 364 |
| Total cash $ Billion |
| 4.79 |
| 5.07 |
| 4.34 |
| 4.36 |
| 3.81 |
| 3.76 |
| Long-term debt in $ Billion |
| 5.48 |
| 5.65 |
| 5.56 |
| 5.57 |
| 5.57 |
| 5.57 |
| Dividend per share in $ |
| 0.55 |
| 0.55 |
| 0.55 |
| 0.55 |
| 0.55 |
| 0.40 |
| Shares Outstanding (diluted) |
| 800 |
| 798 |
| 794 |
| 795 |
| 795 |
| 797 |
Source: Company 10-k filing .
Note: Historical data since 2015 are available only for subscribers.
Part 1 - Gold Production Details
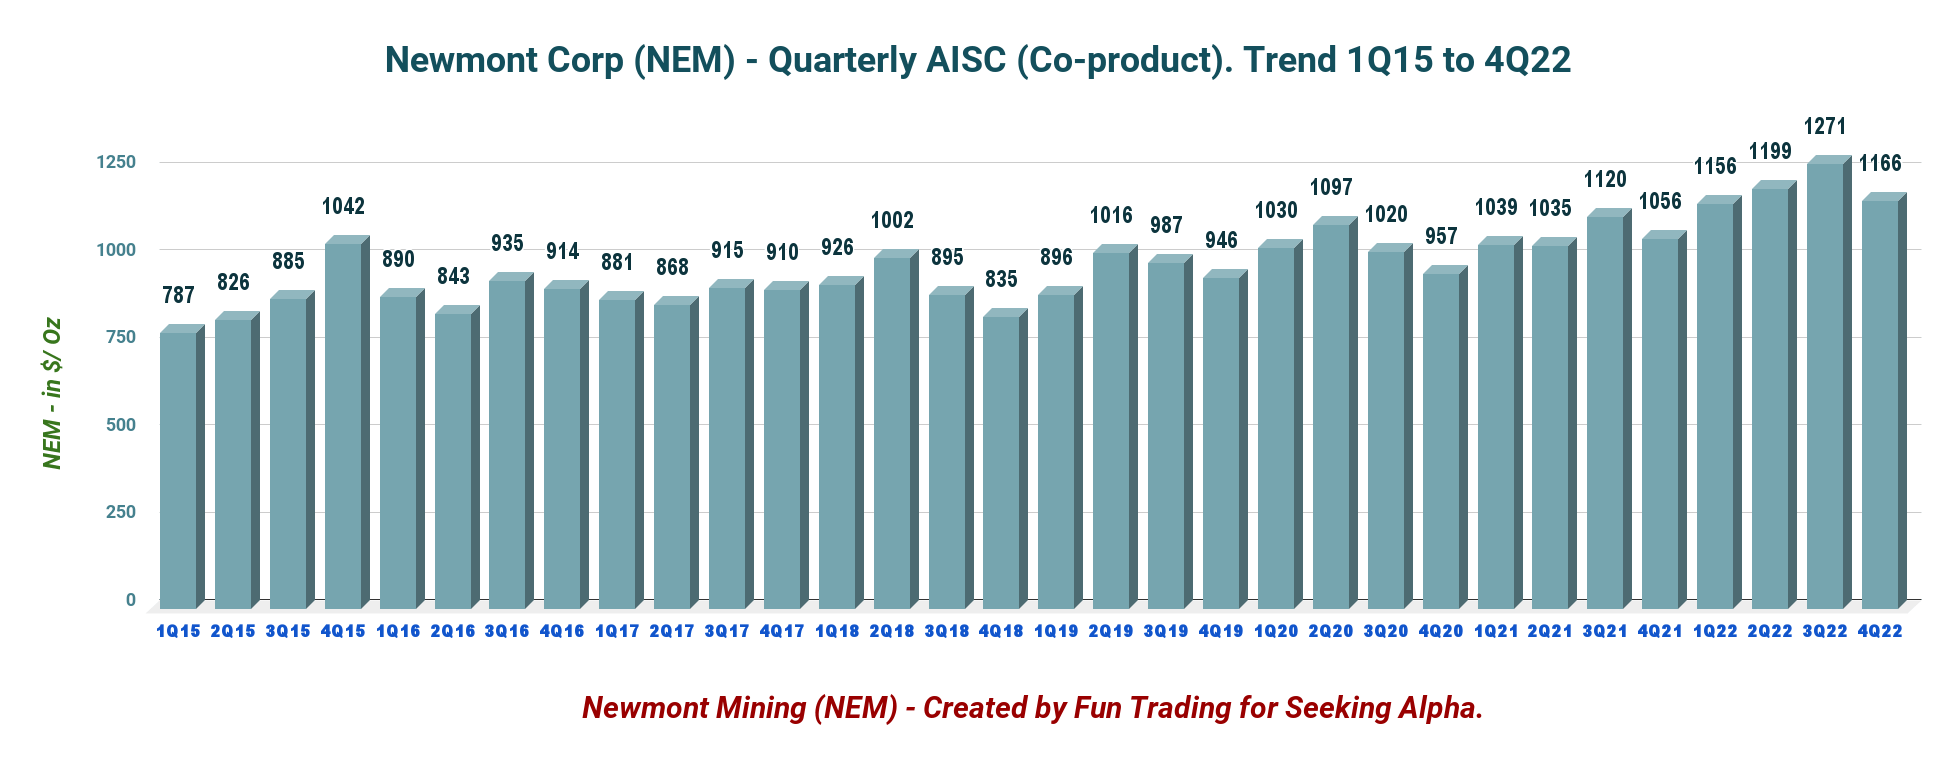
1 - All-In Sustaining Costs or AISC
NEM Quarterly AISC history (Fun Trading)
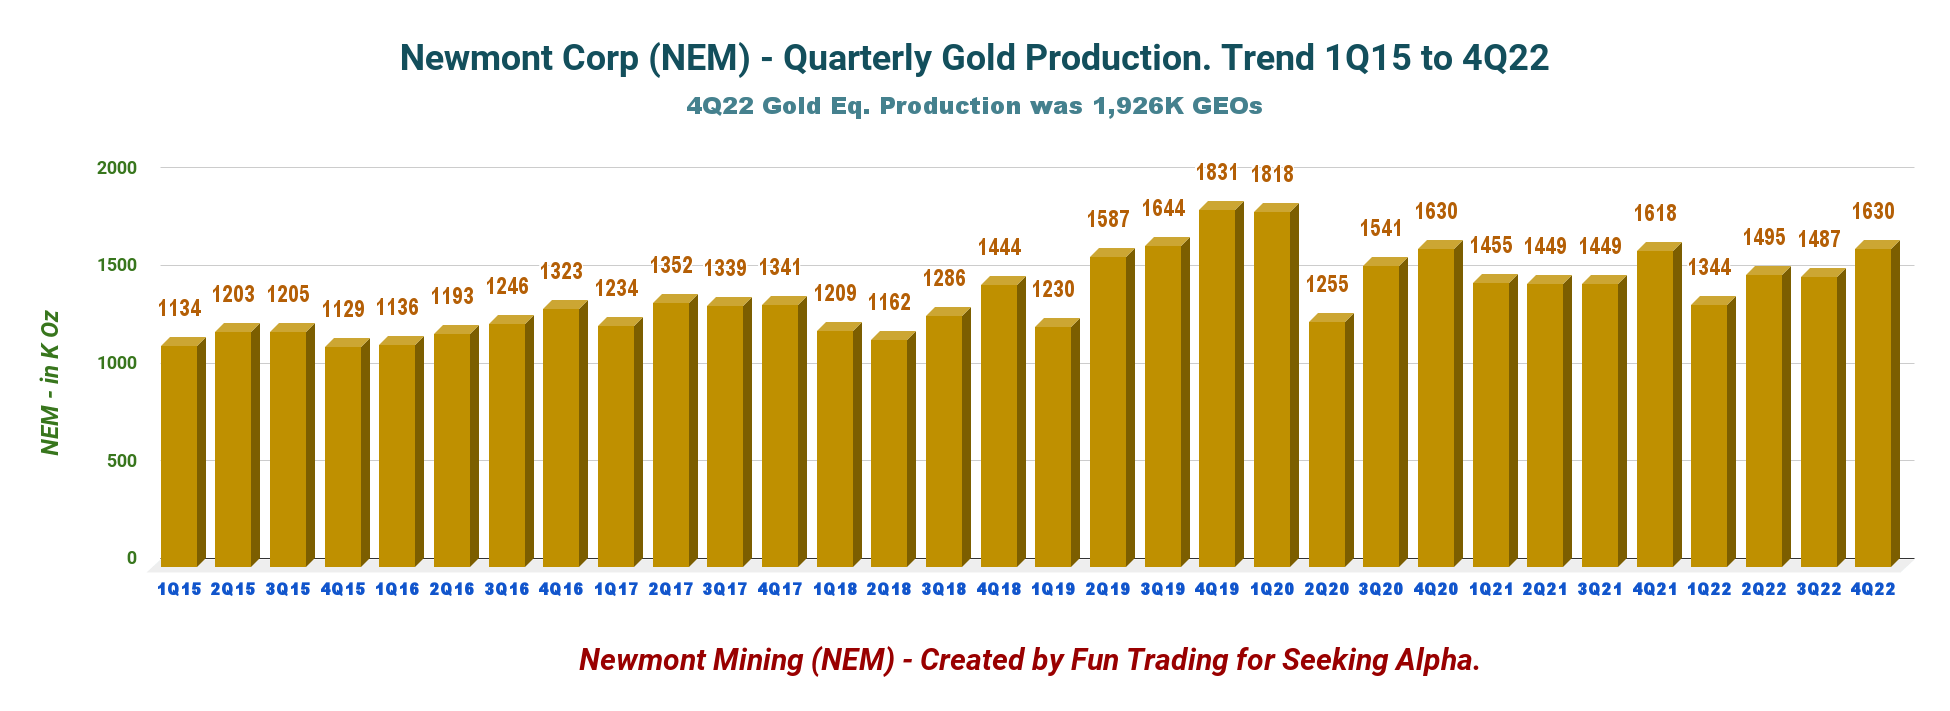
2 - Presentation of Newmont Gold Production in Two Charts
The quarter was solid for gold production, slightly up from 4Q21. Gold production was 1,630K Au Oz, and total gold equivalent production was 1,926K Au equivalent Oz or GEOs. Newmont sold 1,921K GEOs in 4Q22.
NEM Quarterly Gold Production history (Fun Trading)
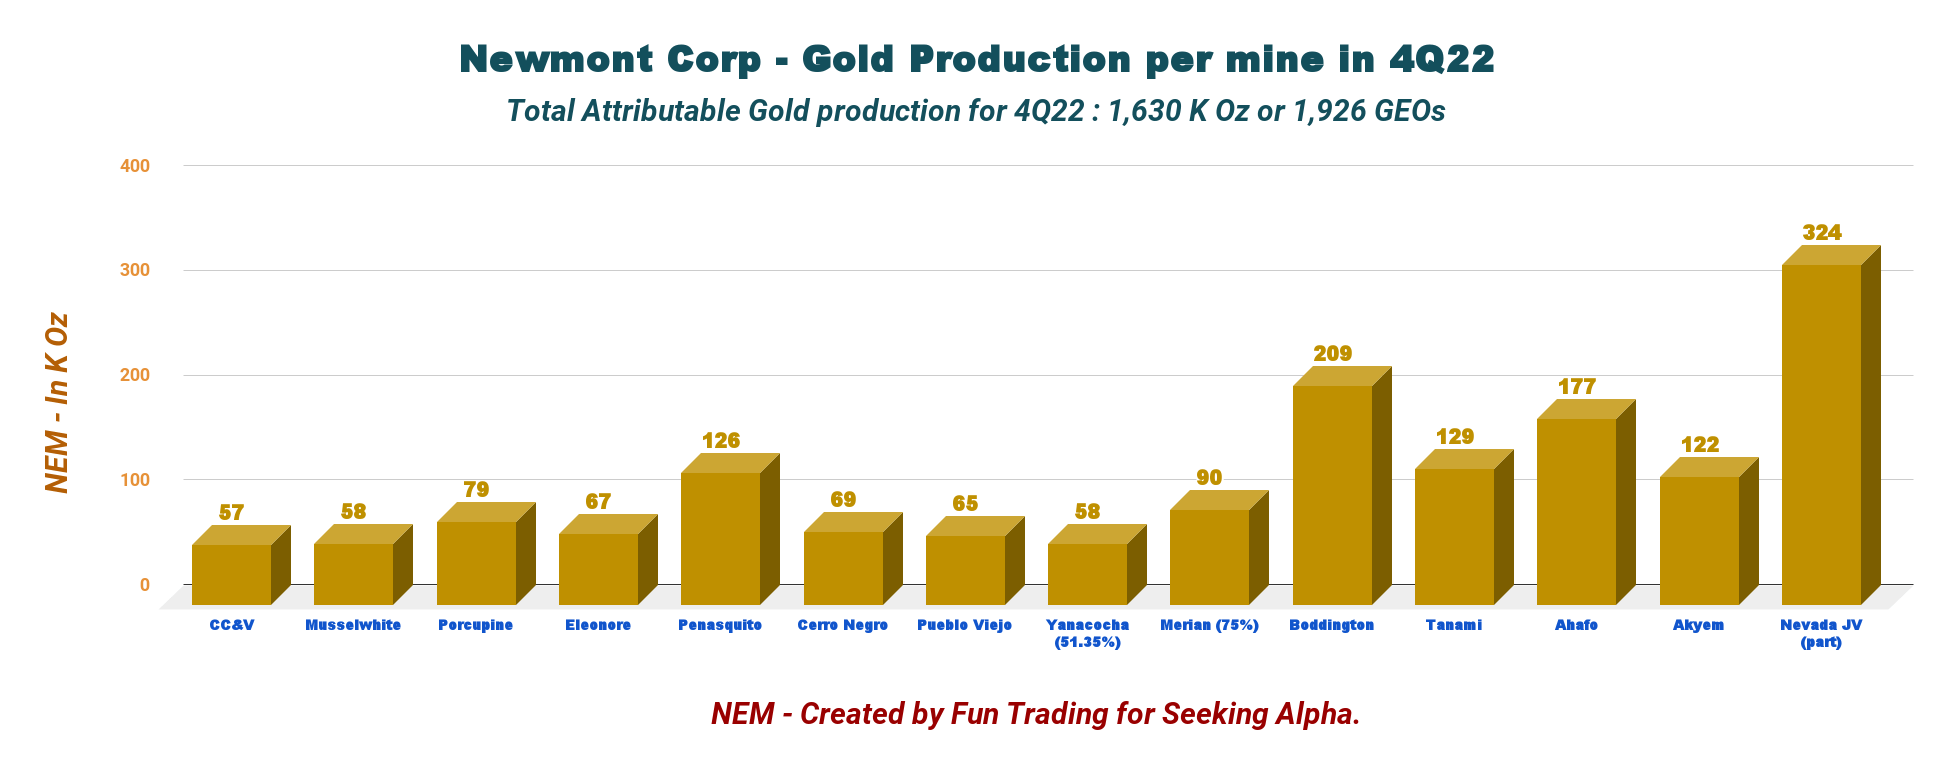
Gold Production in 4Q22 per producing mine, including Goldcorp and the JV Barrick/Newmont (Newmont owns 38.5%).
NEM 4Q22 Gold production per mine (Fun Trading)
Part 2 - Balance Sheet and Commentary
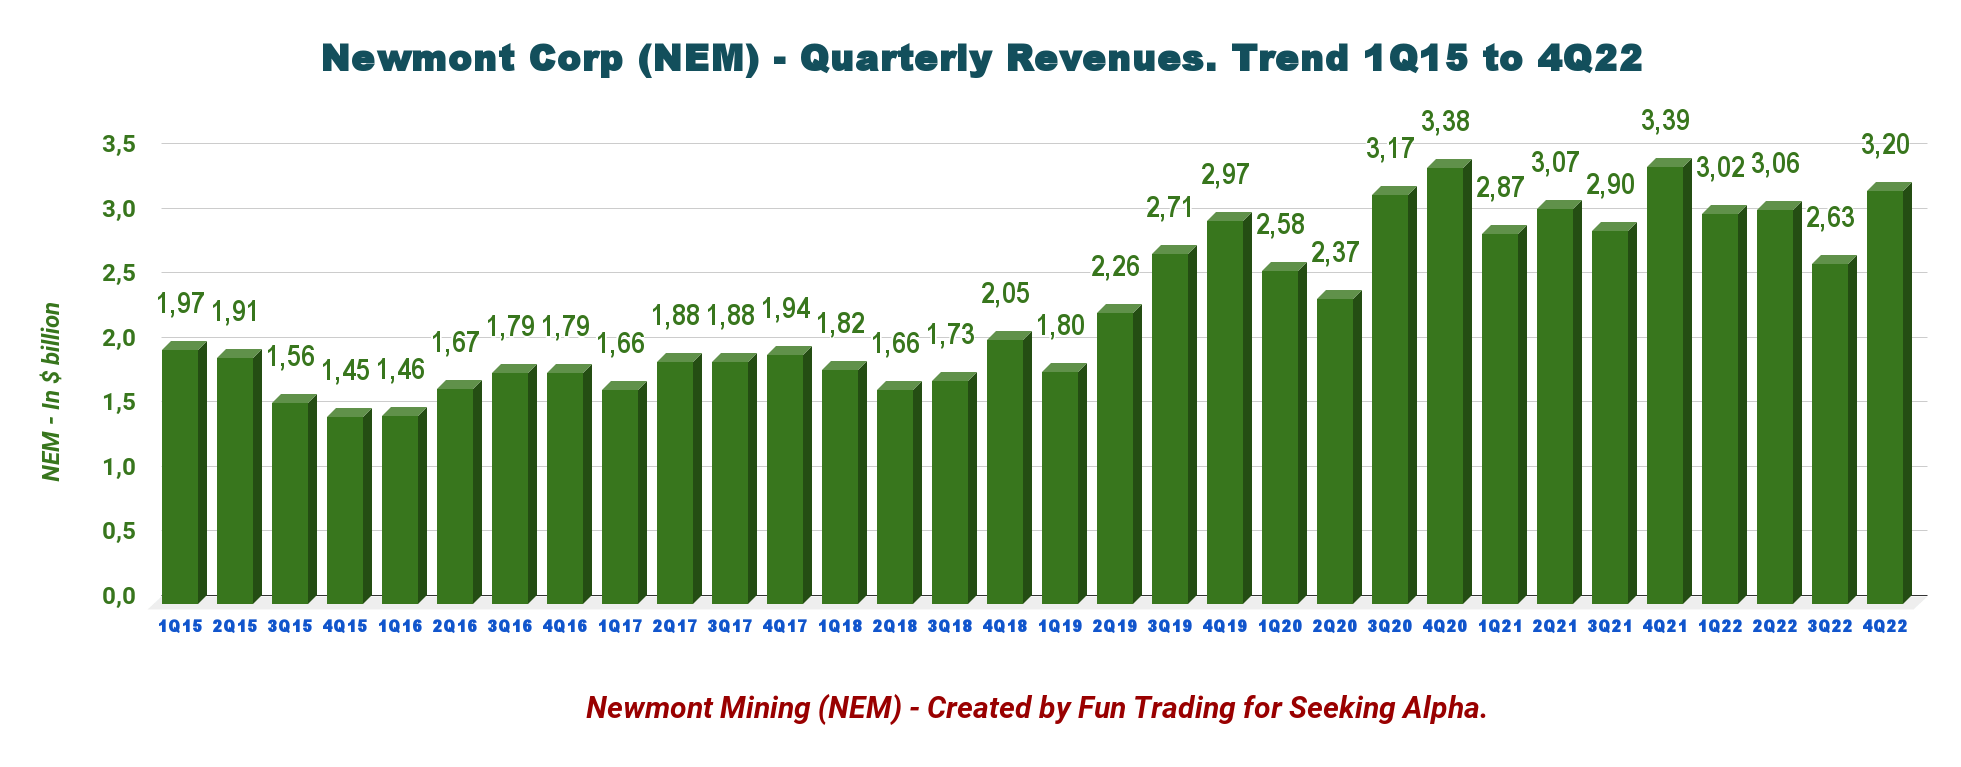
1 - Newmont Revenues were $3.20 Billion in 4Q22
NEM Quarterly Revenue history (Fun Trading)
Revenues were $3.20 billion, and net loss was $1,477 million, or $1.86 per diluted share, in 4Q22, compared to a loss of $46 million, or $0.06 per diluted share the same quarter a year ago.
The adjusted net income was $0.44 per diluted share or $348 million compared with $0.78 per share or $624 million last year. The adjusted EBITA was $1,161 million in 4Q22 compared with $1,599 million last year.
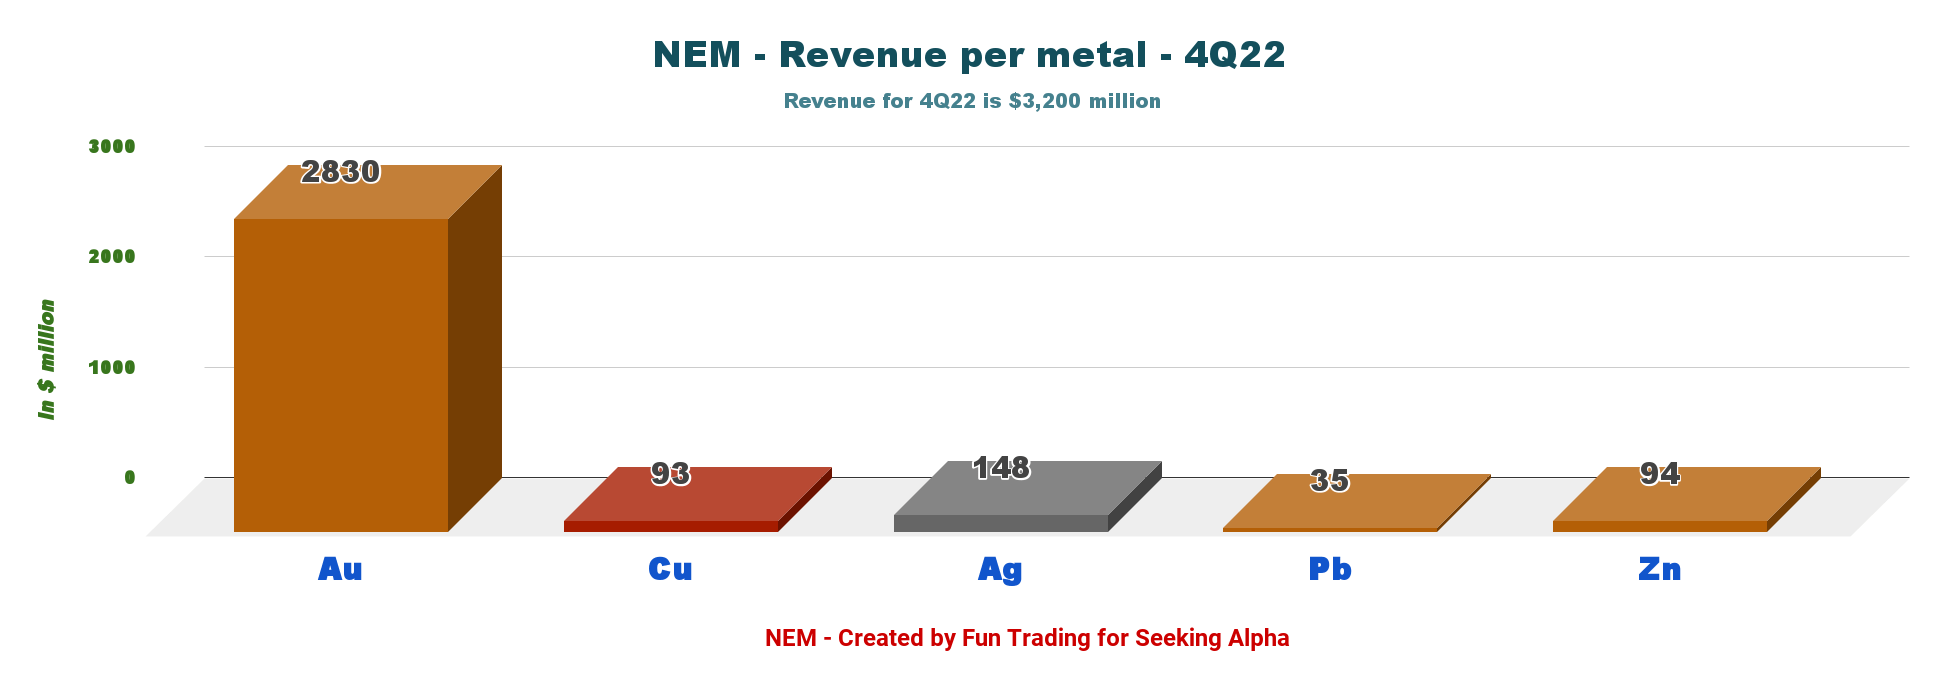
1.1 Revenue repartition per metal mined in 4Q22. Gold gets the lion's share.
As shown below, NEM is a gold producer representing 88.4% of the total revenues.
NEM 4Q22 Revenue per metal (Fun Trading)
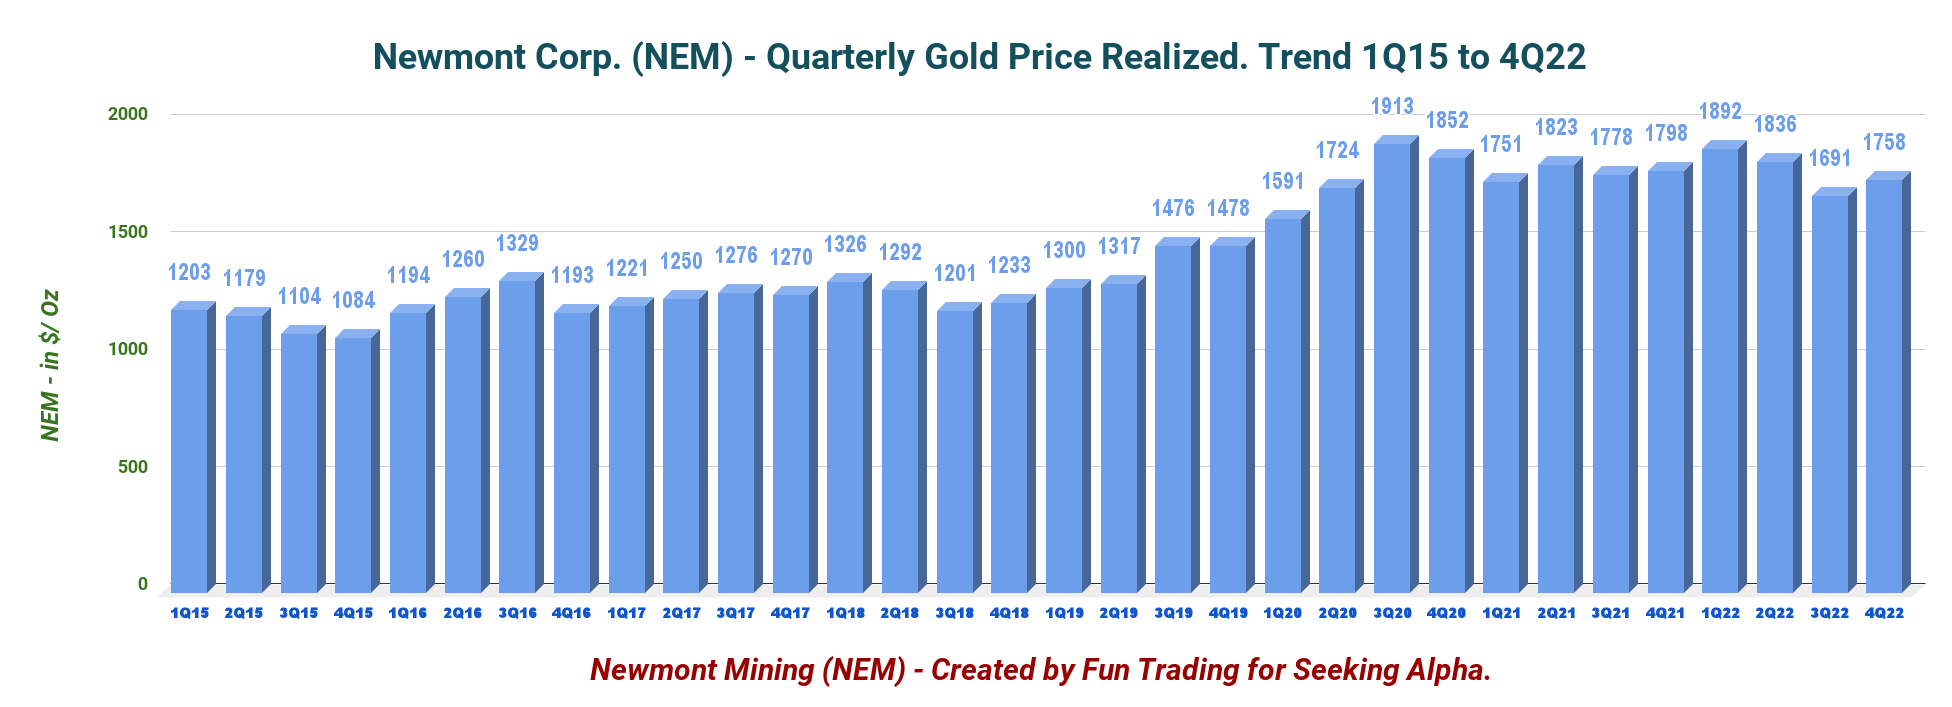
1.2 The gold price realized was $1,758/Oz in 4Q22
NEM Quarterly Gold price history (Fun Trading)
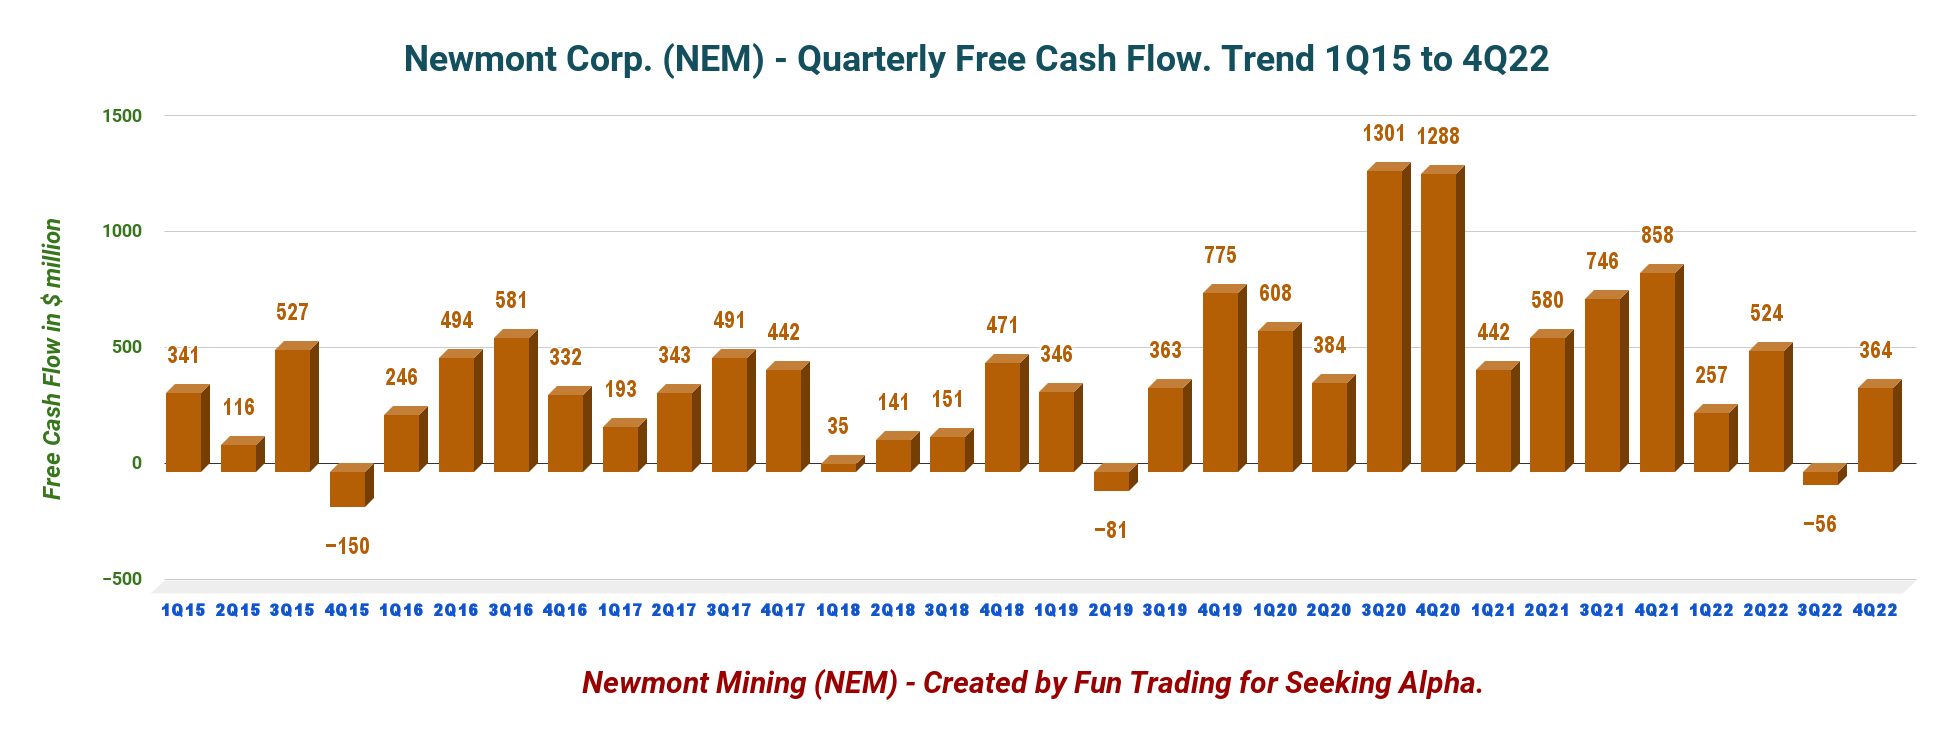
2 - Newmont Reported a 4Q22 Free Cash Flow of $364 Million
NEM Quarterly Free cash flow history (Fun Trading)
NEM's trailing 12-month Free Cash Flow is substantial, with $1,089 million, with a gain of $364 million in 4Q22.
The management declared a quarterly dividend of $0.40 per share in 4Q22.
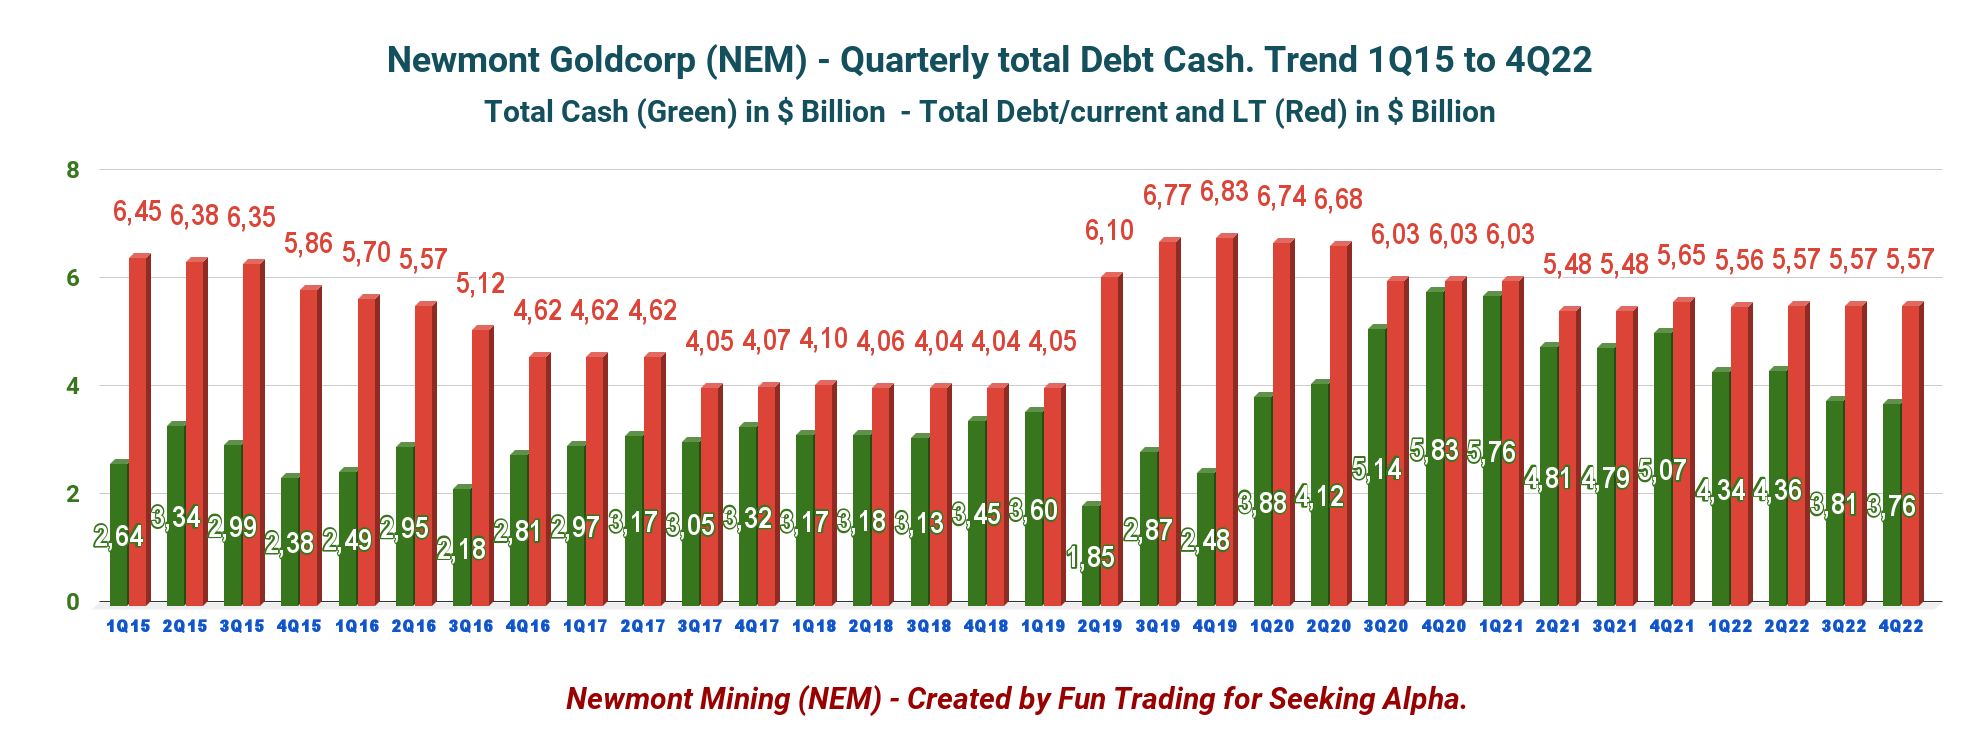
3 - Newmont's LT Debt (Including Current) was $5.571 Billion at the End of December 31.
NEM Quarterly Cash versus Debt history (Fun Trading)
Part 3 - Technical Analysis (Short Term) and Commentary
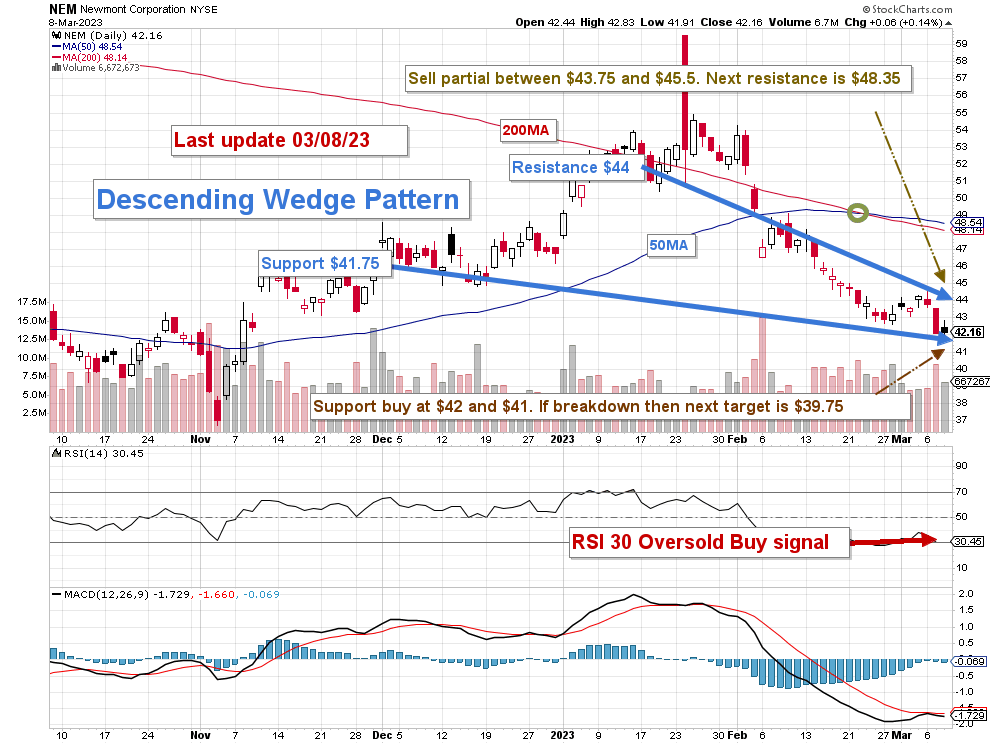
NEM TA Chart short-term (Fun Trading StockCharts)
Note: The chart has been adjusted for dividends.
NEM forms a descending wedge pattern with resistance at $44 and support at $41.75.
A falling wedge pattern is bullish, although it appears after a bearish trend. It signifies that bulls have lost their momentum, and bears have temporarily taken control over the price. As a result, the price starts to make new lower lows, but at a corrective pace.
The short-term trading strategy is to trade LIFO about 35-40% of your position and keep a core long-term amount for a much higher payday. I suggest selling between $43.75 and $45.50 with possible higher resistance at $48.35 and waiting for a retracement between $41 and $42 with possible lower support at $39.75.
Gold is under pressure now after the FED signaled that it might turn hawkish after realizing that inflation is not decreasing enough. The economy is still solid with a strong job outlook which could fuel more inflationary pressure and increase the US$ attractiveness. Furthermore, gold miners are not correlated to gold and seem to drop faster and more aligned to the overall market. This situation may keep Newmont Corporation under pressure until H2 2023, in my opinion.
Watch the gold price like a hawk.
Warning: The TA chart must be updated frequently to be relevant. It is what I am doing in my stock tracker. The chart above has a possible validity of about a week. Remember, the TA chart is a tool only to help you adopt the right strategy. It is not a way to foresee the future. No one and nothing can.
For further details see:
Newmont: A Solid Gold Miner Facing Strong Headwinds