NEM - Newmont: Brighter Macro Conditions Better Technical Factors Warrant An Upgrade
2023-11-27 01:24:32 ET
Summary
- Newmont Corporation is the world's largest gold producer and a substantial producer of copper.
- Following a soft Q3 report, gold prices closed last week above $2000 for the first time in several months, helping the fundamental case for gold equities.
- With a high yield, solid free cash flow, and an improved chart, I highlight key price levels to watch and upgrade my intrinsic value of NEM heading into 2024.
Brace yourselves. I am going to don my CMT hat to set up a review of Newmont Corporation (NEM). Before we dig into NEM’s earnings and fundamental prospects, let’s review how the chart of the VanEck Gold Miners ETF (GDX) looks amid this quickly shifting interest rate environment.
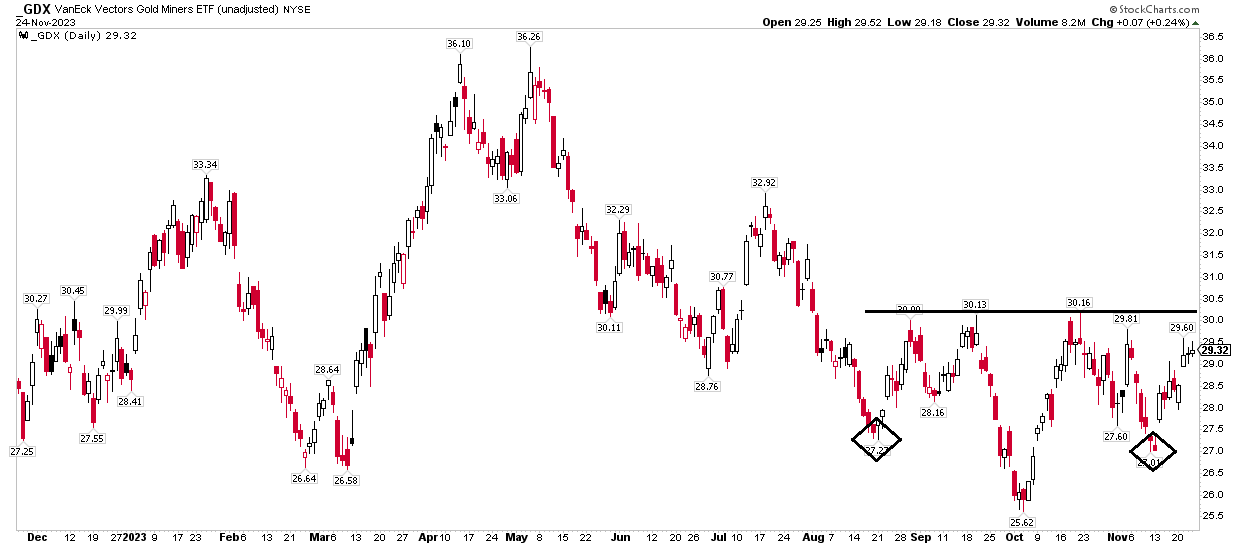
GDX has the potential to break out in a big way should the price rise above $30. Illustrated in the chart below, I see a reverse head and shoulders pattern taking shape – a move above $30 and change would trigger an upside target to near $35. How can it get there? Bullish moves in NEM.
I am upgrading NEM from a hold to a buy based on improving micro and macro trends.
GDX: Gold Miners Setting Up For A Bullish Reversal
According to Bank of America Global Research, Newmont is the world's largest gold producer and a substantial producer of copper. For 2024 BofA sees Newmont producing 8.1 million ounces of gold at Gold All in Sustaining Costs (AISC) of $1,232 per ounce. Newmont management is focusing on balancing free cash flow and returns to shareholders with investment in production. NEM is the largest weight in the GDX ETF at more than 13%.
The Denver-based $43 billion market cap Gold industry company within the Materials sector trades at a somewhat high 22.7 forward non-GAAP price-to-earnings multiple and its forward dividend yield is high at 4.3% as of November 24, 2023. Following a modestly disappointing Q3 report a few weeks ago, shares trade with a moderate 29% implied volatility percentage while short interest on the stock is material at 3.8% as of November 24, 2023.
Back in October, NEM reported a weak set of results. Q3 non-GAAP EPS of $0.36 was below the $0.43 consensus forecast, though it was a considerable improvement from $0.27 of per-share profits earned in the same period a year ago. Shares traded 2% higher the following session despite a reported 5% decline in quarterly revenue from Q3 2022. Adjusted EBITDA came in at $933 million, driven by solid production volumes, higher gold prices, and cost controls, though the whisper number was higher than that total.
Lower 2023 gold production guidance, particularly at Ahafo, contributed to the softer-than-expected results. But following the completion of the acquisition of Newcrest Mining earlier this month, the outlook is arguably clearer. Still, 2023 production guidance of 5.3 million ounces is much lighter than previous expectations for 5.7 million to 6.3 million ounces. Importantly, net debt declined to $2.9 billion as of September 30, 2023, and free cash flow was solid at $399 million. As a result, the management team declared a $0.40 per share dividend .
On valuation , analysts at BofA see earnings falling sharply this year, but then bouncing back in 2024. Operating EPS by 2025 could approach $4 in BofA’s view, but I must temper expectations considering that the current consensus, per Seeking Alpha, calls for just $2.41 of ‘24 non-GAAP EPS.
Sales, meanwhile, are expected to jump 50% in FY 24 and dividends are forecast to hold at the $1.60 per year rate over the next several quarters. With a significant EPS increase in the cards, NEM’s valuation becomes more optimistic, and its EV/EBITDA ratio is significantly below that of the S&P 500. Finally, notice how free cash flow is forecast to jump in the out years compared to weak FCF yields lately.
Newmont: Earnings, Valuation, Dividend Yield, Free Cash Flow Forecasts
BofA Global Research
If we assume $2.50 of normalized EPS and apply a 20x multiple, then the shares should be near $50 today. Consider that the stock’s 5-year average non-GAAP earnings multiple is 23, though other valuation metrics are not as strong – but we are coming off a tough period for gold miners, and higher precious metal prices heading into 2024 is a positive sign. Easing real interest rates and stabilizing growth rates in labor costs are other crucial factors – these are also risks if some of 2022-23's trends return next year.
NEM: Mixed Valuation Metrics
Seeking Alpha
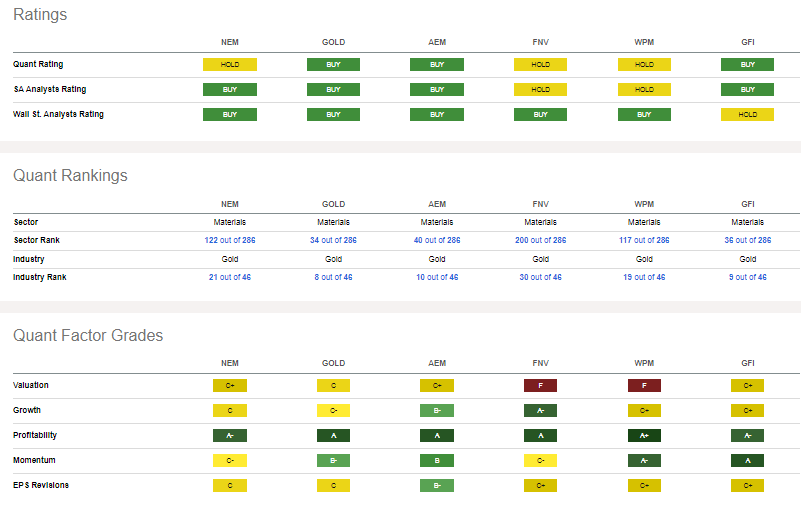
Compared to its peers , NEM features unimpressive quant factor grades. Its valuation is considered middle-of-the-road versus other industry players while the company’s growth history is not so stellar. But considering much more attractive EPS trends over the ensuing quarters, I assert that forward-looking growth trends are more sanguine. While share-price momentum has been weak lately, profitability trends with NEM have held up decently, helping make the case that the valuation is better today. Finally, a weak Q3 did not help the story with EPS revisions.
Competitor Analysis
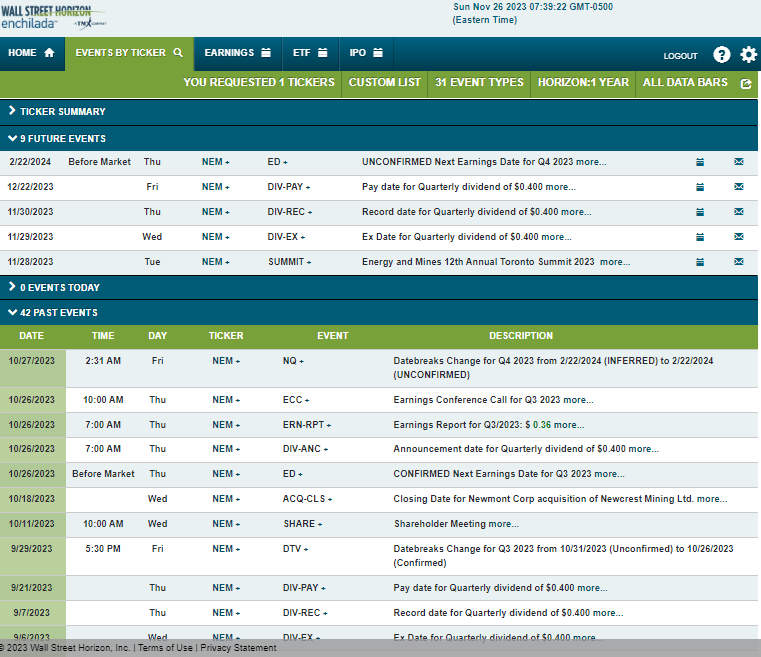
Looking ahead, corporate event data provided by Wall Street Horizon show an unconfirmed Q4 2023 earnings date of Thursday, February 22 BMO. Before that, the management team is slated to present at the Energy and Mines 12 th Annual Toronto Summit 2023 from November 28 to 29 this week, so there could be some stock-price volatility around that event. NEM also trades ex-div on Wednesday.
Corporate Event Risk Calendar
The Technical Take
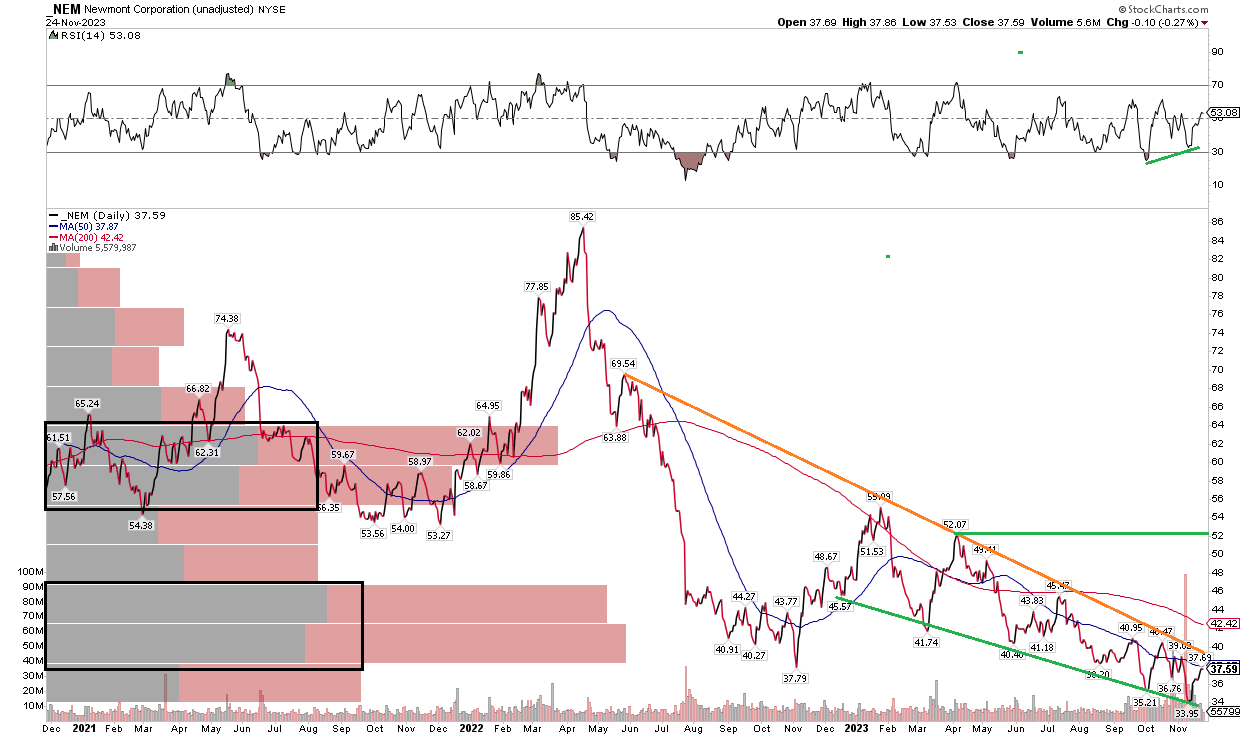
In my previous outlook from the first half of this year, I was rather downbeat on NEM’s momentum situation. The stock went on to move below its November 2022 low. Typically, that would be a bearish breakdown, but a new pattern has emerged. Notice in the chart below that shares have been in a protracted downtrend since early 2023, while a multi-year high was notched in Q2 2022. The current trend channel lower is actually somewhat bullish, in my technical opinion, since it has the look of a descending wedge. The implication here is that if we see a breakout above $41, then an upside measure move price objective to the low $50s would be in play. Considering that GDX is on the verge of a positive reversal, there is definitely a bullish case to be made for NEM here.
Still, with a long-term 200-day moving average that is 13% above the current price and negatively sloped, the bulls still have their work cut out for them. Also, take a look at the big volume spike about when NEM notched its 2023 low – that could be good enough to mark a capitulation-selling event. That remains to be proven, but I do see a bullish RSI momentum divergence evidenced by the higher low in the oscillator at the top of the chart. Longer-term, a high amount of volume by price in the $55 to $63 zone could be problematic if we get up that high. Reaching the low $50s, though, shouldn’t face too much selling pressure from overhead supply once a breakout above $41 happens.
Overall, NEM’s chart is by no means screaming buy, but several clues assert for higher price ahead.
NEM: Bullish Descending Triangle Targets the low $50s
The Bottom Line
I am upgrading NEM from a hold to a buy based on valuation, more favorable macro conditions, and a better technical situation.
For further details see:
Newmont: Brighter Macro Conditions, Better Technical Factors Warrant An Upgrade