NEM - Newmont: Worst Quarter Of The Year In Rearview Mirror
2023-04-28 14:45:05 ET
Summary
- Newmont Corporation released its Q1 results this week, reporting quarterly production of ~1.27 million ounces of gold and ~288,000 gold-equivalent ounces, translating to ~1.56 million total ounces produced.
- This represented a 5% and 18% decline of gold and gold-equivalent ounces year-over-year, respectively, and combined with an increase in operating costs, Newmont saw lower revenue and negative free cash flow in Q1.
- That said, this was an abnormally weak quarter for several reasons and while disappointing, investors can expect much better results as the year progresses, especially if gold prices cooperate.
- However, while Newmont has its worst quarter out of the way and trades at a reasonable valuation of ~9.3x cash flow, I still don't see enough margin of safety at $47.50 to justify going long the stock.
The Q1 Earnings Season for the VanEck Gold Miners ETF ( GDX ) has finally begun, and one of the first companies to report its results was Newmont Corporation ( NEM ). Unfortunately, the results weren't anywhere near as pleasing as the results delivered by Alamos Gold Inc. ( AGI ) and Agnico Eagle Mines ( AEM ) this week, with Newmont reporting lower revenue, negative free cash flow, and a 28% decline in all-in sustaining cost (AISC) margins. The good news is that this was an abnormally poor quarter for several reasons, and with the worst quarter of the year out of the way, investors can forward to much better Q2 and H2-2023 results. Let's take a closer look below:
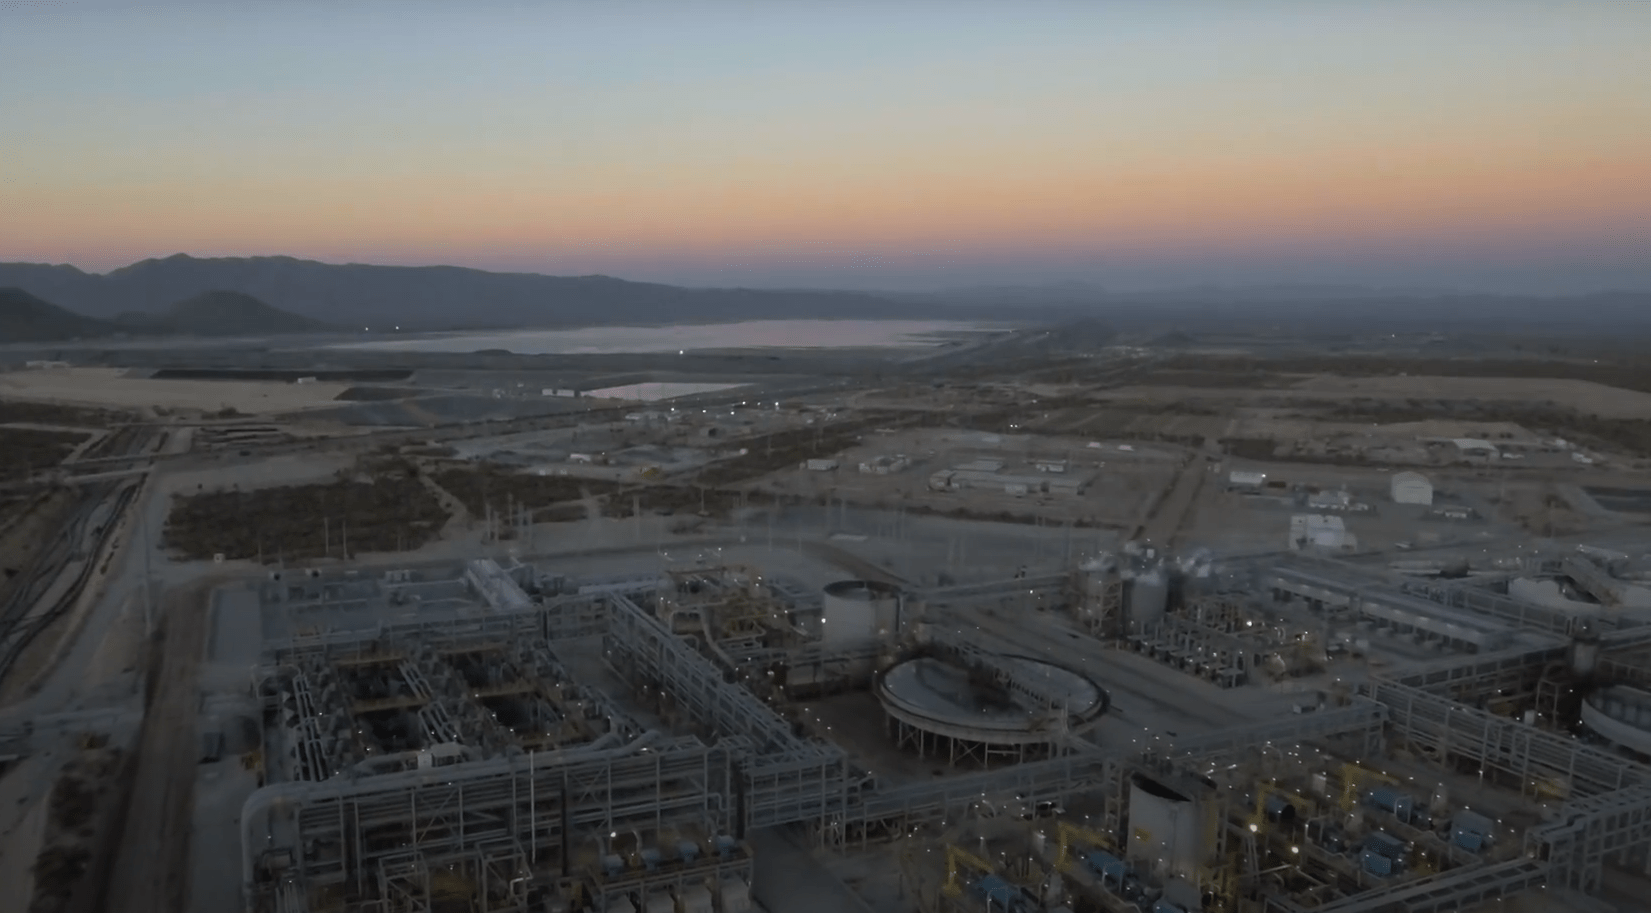
Penasquito Operations (Company Website)
Q1 Production & Sales
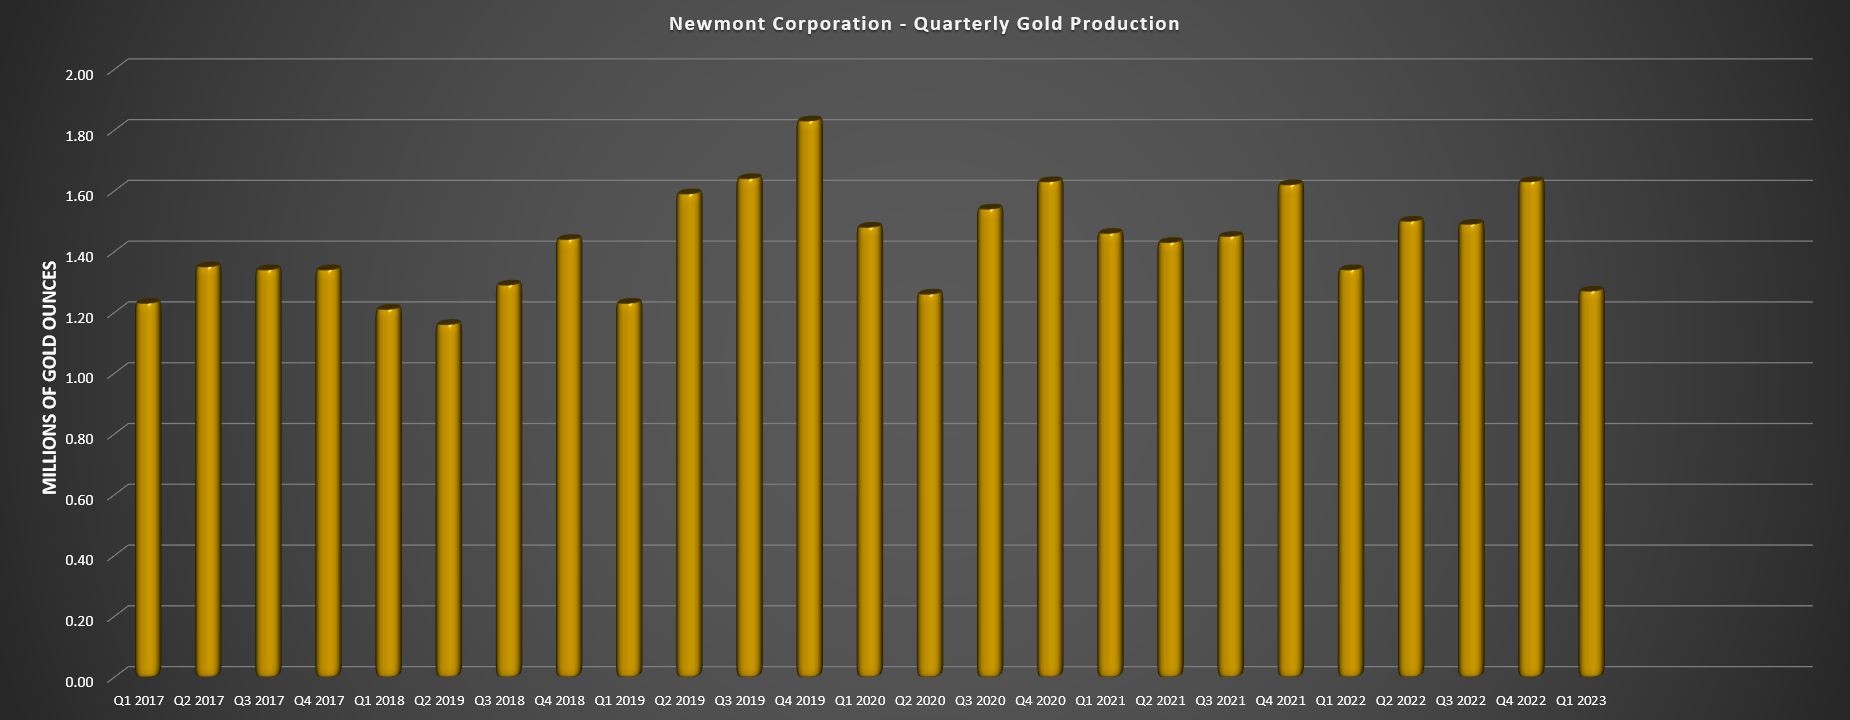
Newmont released its Q1 results this week, reporting quarterly production of ~1.27 million ounces of gold (down 5% year-over-year), and quarterly production of ~288,000 gold-equivalent ounces (GEOs), an 18% decline from the year-ago period. This significant decline in output was despite Newmont lapping relatively easy year-over-year comps, with the company lapping an 8% decline in gold production from the Q1 2022 report (~1.34 million ounces vs. ~1.46 million ounces). Unfortunately, sales came in at even weaker levels because of a delayed concentrated shipment at its Penasquito (~55,000 gold-equivalent ounces), impacting total revenue in the period, but which will be a tailwind for the Q2 results.
Newmont - Quarterly Gold Production (Company Filings, Author's Chart)
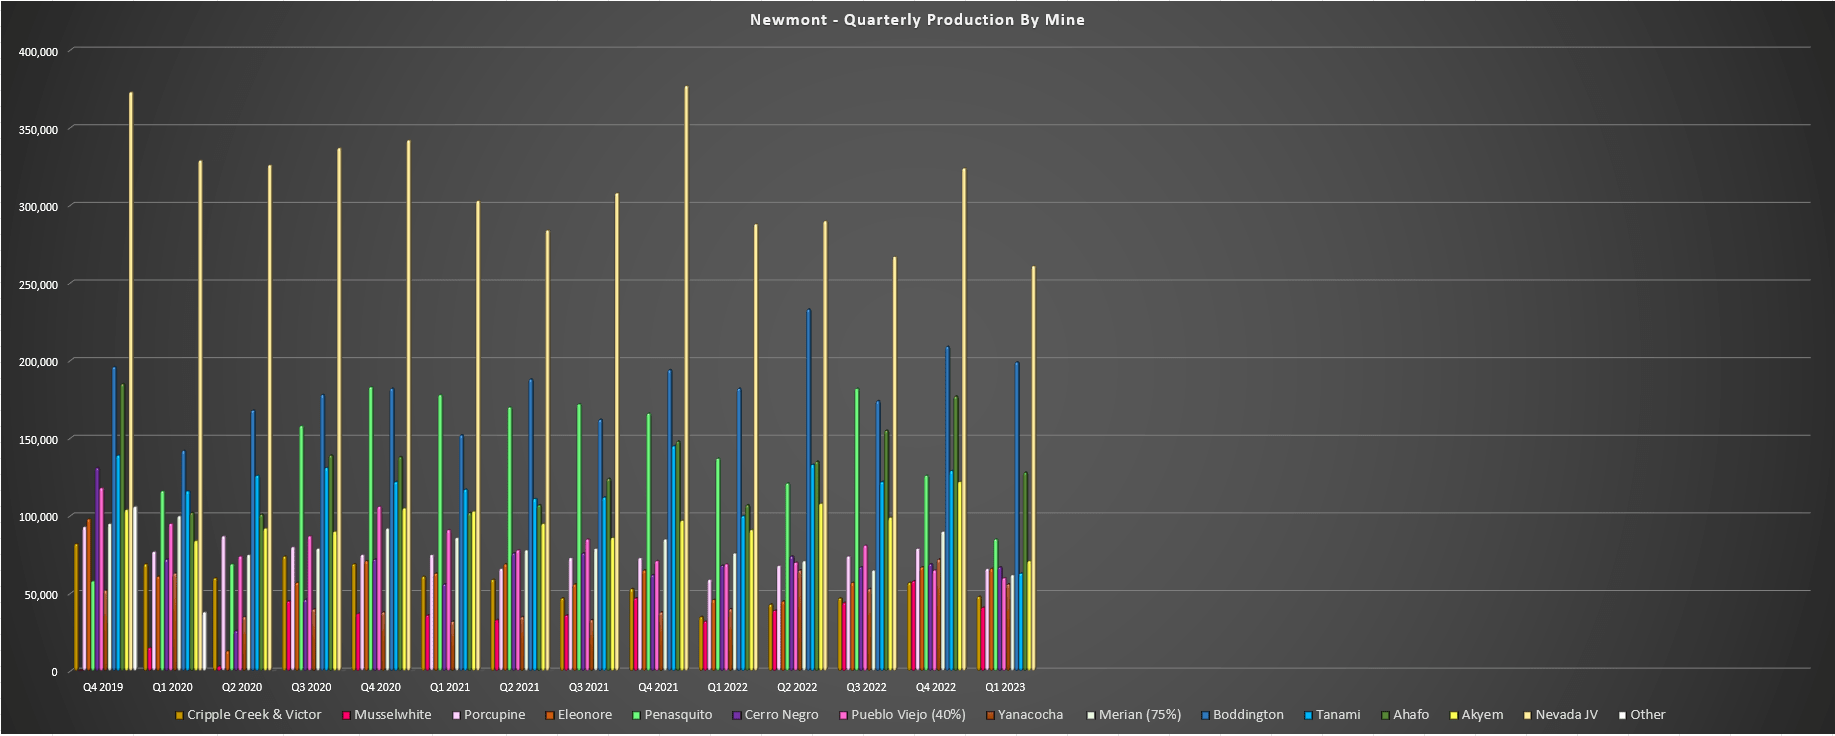
Looking at the production in a little more detail below, we can see the softness in production was mixed, with several of Newmont's managed operations seeing higher production, including Boddington (~199,000 ounces), Yanacocha (~56,000 ounces), Ahafo (~128,000 ounces), Cripple Creek & Victor (~48,000 ounces), and its Canadian operations, with the latter combining for total gold production of ~173,000 ounces (Q1 2022: ~137,000 ounces). Newmont noted that the increase in production at Ahafo was driven by higher grades, while the significant increase in production at Eleonore (one of its three Canadian operations) was related to higher grades and throughput. Elsewhere, at Yanacocha in Peru, the higher output was related to the increased ownership with Newmont taking full ownership of the asset.
Unfortunately, this was offset by lower production at key assets like Penasquito (lower grades/recoveries due to mine sequence which was already flagged by the company), the winding down of operations at Long Canyon (Nevada joint-venture), lower production at Pueblo Viejo (~60,000 attributable ounces), and a very slow start to the year for the Carlin Complex (Nevada joint-venture) with related to annual roaster maintenance, harsher weather, and work to convert the Goldstrike autoclave to conventional CIL processing. Finally, at Newmont's Tanami operation, the Northern Territory of Australia was hit with record rainfall and flooding that impacted Newmont's ability to get key consumables to the site, resulting in 32 days of mill downtime.
Newmont - Quarterly Production by Mine (Company Filings, Author's Chart)
The three major headwinds unrelated to mine sequencing (cessation of mining activities at Long Canyon Phase 1, an unusually weak Q1 for Carlin, and downtime at Tanami) significantly impacted its production. And when combined with lower gold grades from the Chile Colorada Pit at Penasquito and a delayed concentrate sale at this asset, this added insult to injury in terms of the company's Q1 financials. The good news is that Tanami will bounce back strongly in Q2, with Newmont continuing to mine and place stockpiles in front of the mill during the downtime and with maintenance moved up to allow for a much better Q2 performance. Meanwhile, we'll see increased sales from the delayed concentrate shipment, and higher production at Yanacocha with a combination injection leaching/re-leaching programs.
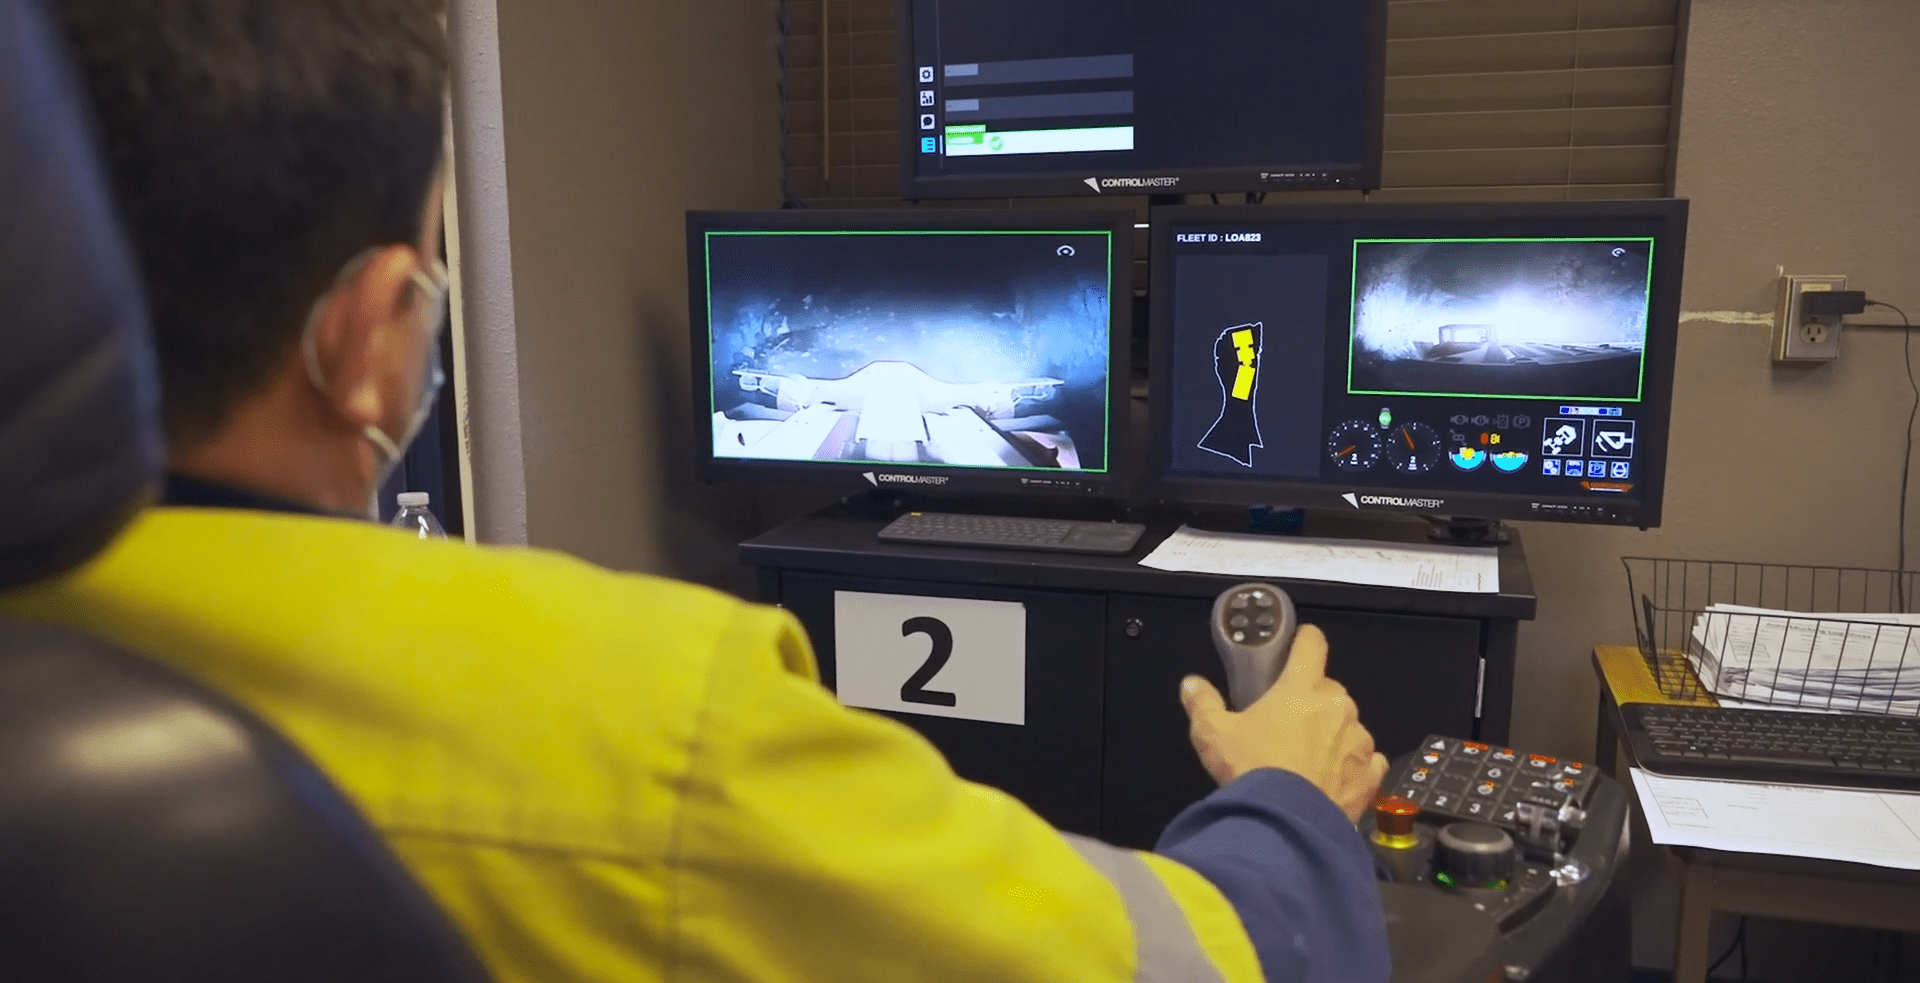
Remote Underground Mining - Carlin Complex (Nevada Gold Mines Presentation)
Meanwhile, outside of Newmont's managed operations, the Carlin Complex should bounce back strongly in Q2 with key maintenance work out of the way and improved weather and the Pueblo Viejo Expansion continues to ramp up, pointing to meaningful growth from this asset in the back half of the year and during 2024. So, while gold sales and gold-equivalent sales were down sharply in the period and we saw a delayed concentrated shipment which contributed to much lower revenue year-over-year (~$2.67 billion vs. ~$3.02 billion), I would expect a much better Q2 and H2 performance. Newmont has guided for a roughly 45%/55% split to production this year.
Costs & Margins
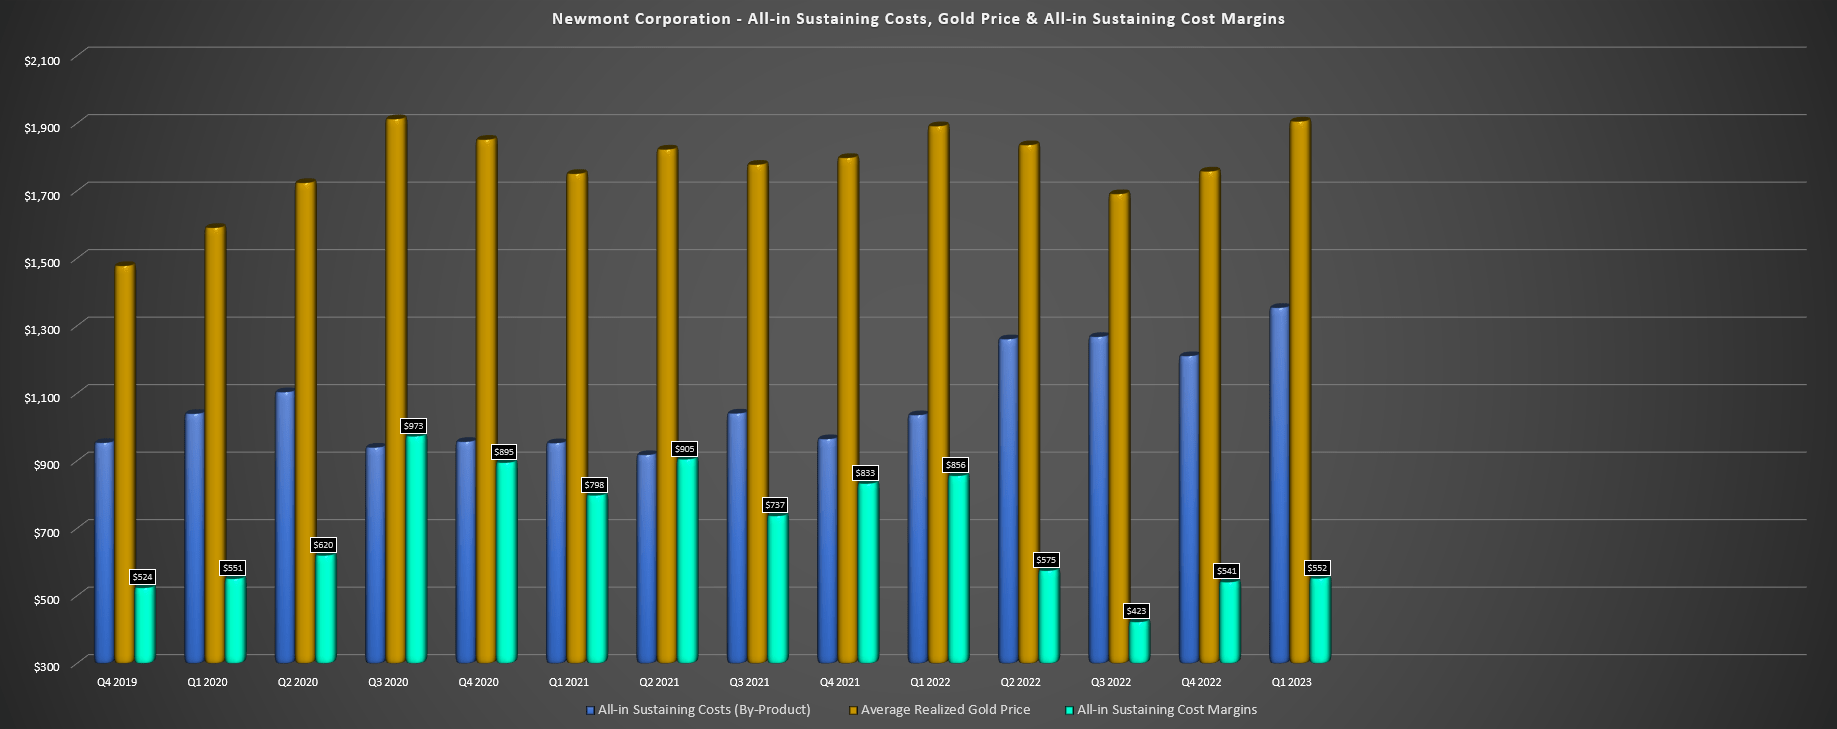
Moving over to costs and margins, the lower production certainly impacted Newmont's results in the period, as did inflationary pressures that were less significant in January through March 2022, and ~30% higher sustaining capital expenditures ($285 million vs. $220 million). The result was that Newmont's AISC soared to $1,376/oz vs. $1,156/oz in Q1 2022, translating to a significant decline in AISC margins despite a slightly higher average realized gold price of $1,906/oz. This was impacted by higher costs across the board, with the only two operations that saw lower unit costs being Cripple Creek & Victor and Eleonore, but this was largely due to being up against easy year-over-year comps.
Newmont - Quarterly AISC, Gold Price & AISC Margins (Company Filings, Author's Chart)
Fortunately, while these unit costs are well above the estimated industry average of $1,310/oz and are well above Newmont's FY2023 guidance of $1,150/oz to $1,250 ($1,200/oz midpoint), we should see much lower costs as the year progresses with the benefit of higher production, key low-cost assets contributing more ounces (Boddington, Tanami, Pueblo Viejo, Carlin). And if the gold price continues to cooperate, this should lead to a meaningful improvement in margins sequentially and in H2-2023 vs. H1-2023. In fact, if we assume all-in sustaining costs of $1,320/oz in Q2 2023 and an average realized gold price of $1,960/oz, AISC margins would improve ~20% to $630/oz vs. $526/oz in Q1 2023.
Newmont - Attributable Production Per Jurisdiction (Ex-Mexico) (Company Filings, Author's Table)
Finally, it's worth noting that Newmont's Canadian operations appear to be turning the corner finally. The company noted in its prepared remarks that development rates continue to improve, it's seeing meaningful productivity improvements and overall the labor situation is better, with reduced absenteeism and improved recruitment. Obviously, these three assets aren't that significant in the overall picture as they make up less than 15% of annual production. That said, these are some of its highest-cost operations and an improvement in costs with increased production and productivity gains here would certainly help to pull down AISC margins a little.
Once Ahafo North and the Tanami Expansion are online in H2-2025, we'll see a further improvement in consolidated costs.
Financial Results
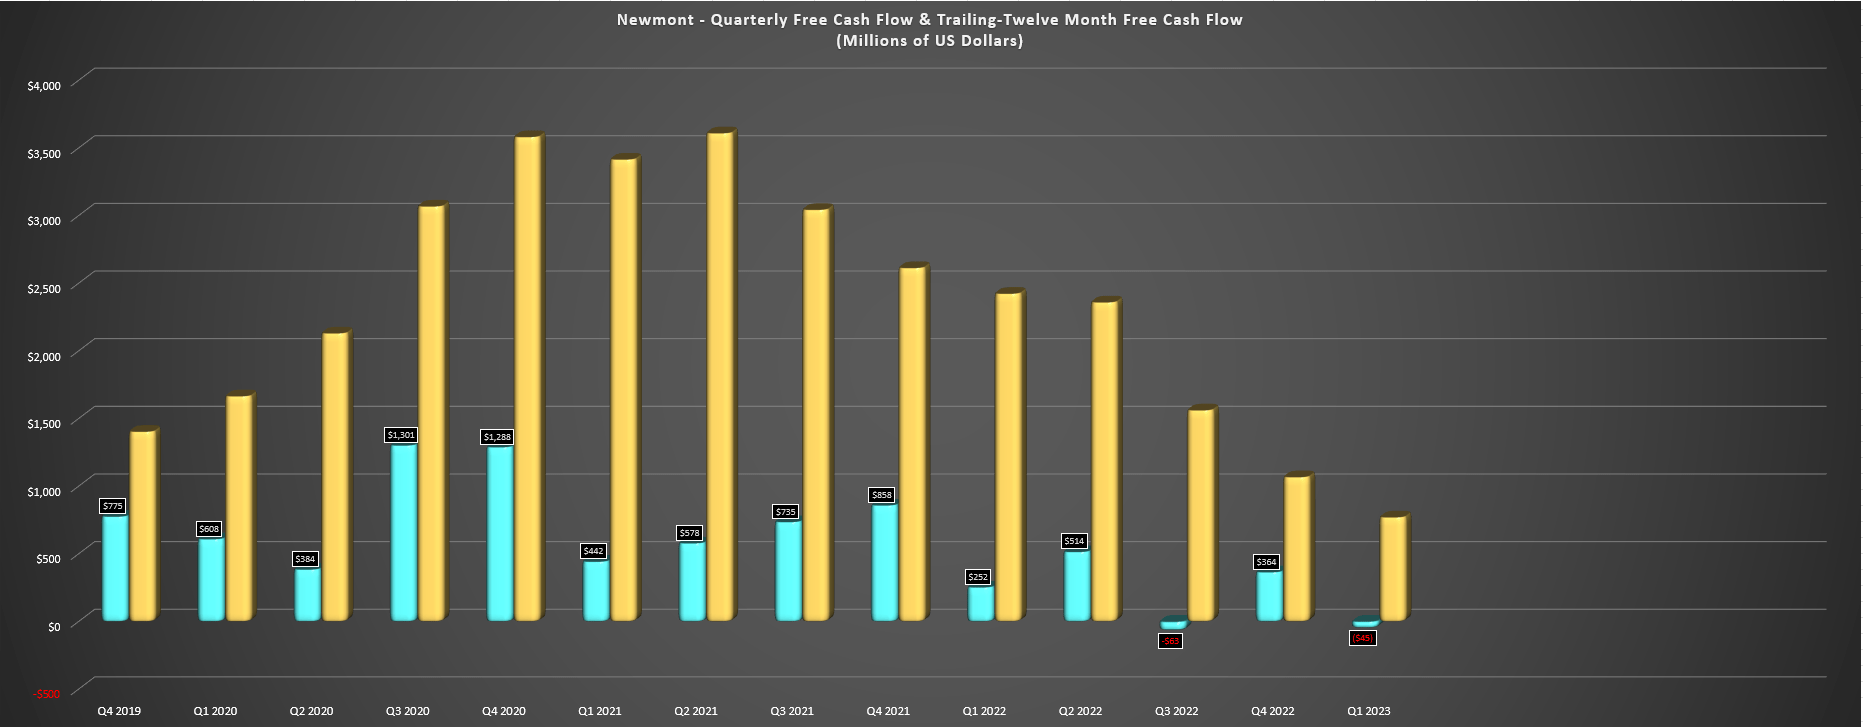
Finally, looking at Newmont's financial results, the company reported operating cash flow of $481 million (Q1 2022: $689 million), which was impacted by weaker margins, lower sales volumes, and negative working capital movements with an impact from the buildup of stockpiles and finished goods inventory with the delayed concentrate sale at Penasquito. When combined with increased capital expenditures year-over-year ($526 million vs. $437 million), free cash flow came in negative in Q1 despite an average realized gold price of $1,906/oz, with free cash flow of (-) $45 million vs. (+) $252 million in the year-ago period. Hence, despite proceeds from disposing of Triple Flag ( TFPM ) shares, net debt increased year-over-year to ~$2.7 billion.
Newmont - Quarterly Free Cash Flow & Trailing-Twelve Month Free Cash Flow (Company Filings, Author's Chart)
While these financial results were certainly not that pleasing and might have some investors worried about the viability of a dividend that was already cut, it's important to remember that this was an abnormally weak quarter and Newmont should generate upwards of $1.3 billion in free cash flow this year despite the slow start to the year and despite being in a heavy investment phase. So, while it's easy to be turned off by the weak Q1 financial results from the world's largest gold miner on an attributable basis, things should only improve from here, especially if gold prices can remain above $1,850/oz. Let's look at Newmont's valuation to see whether the stock is worth investing in at current levels.
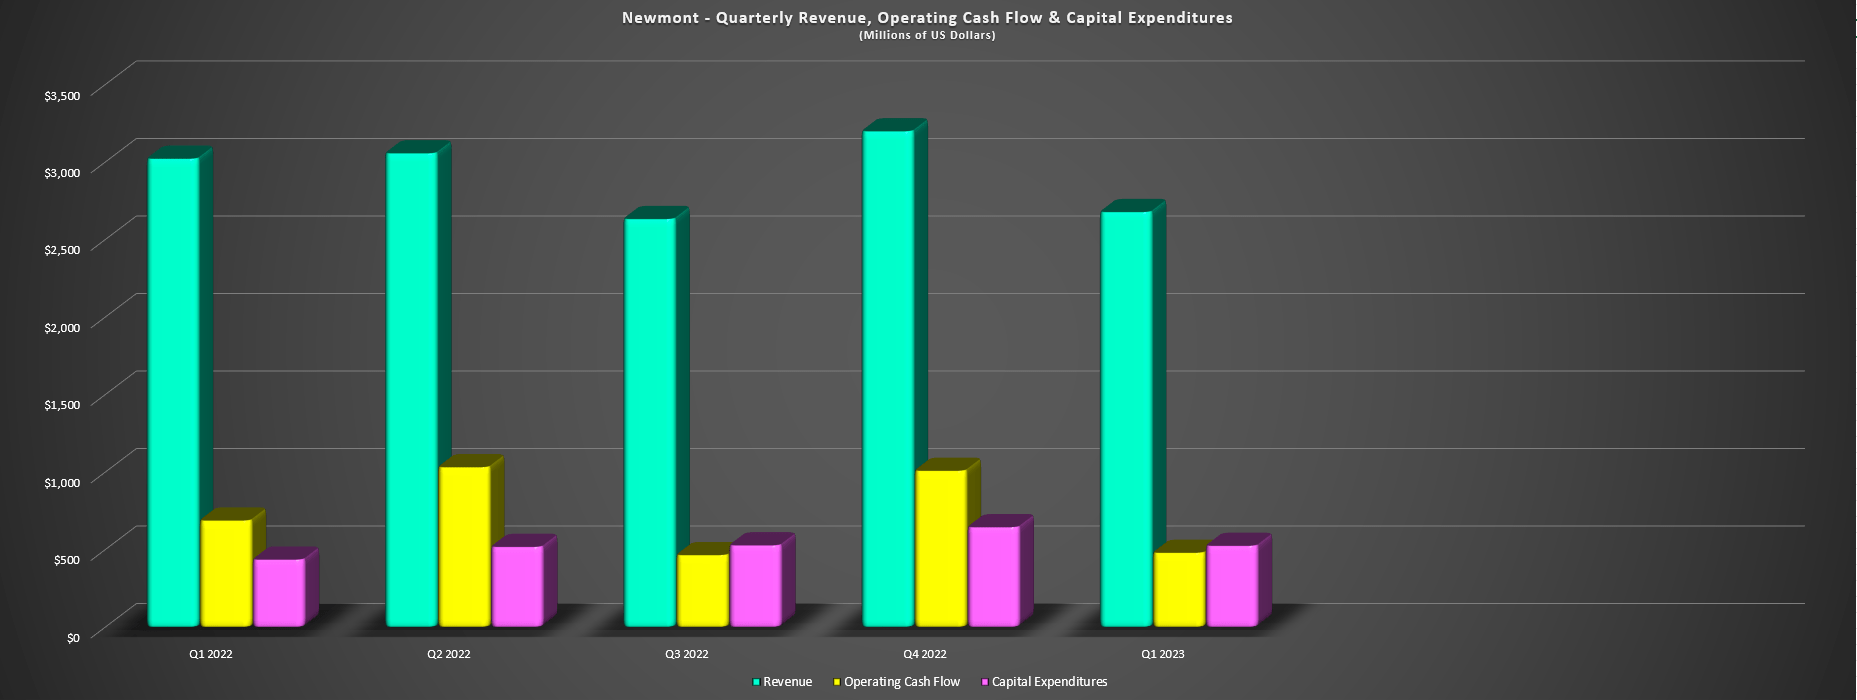
Newmont - Revenue, Operating Cash Flow & Capital Expenditures (Company Filings, Author's Chart)
Valuation & Technical Picture
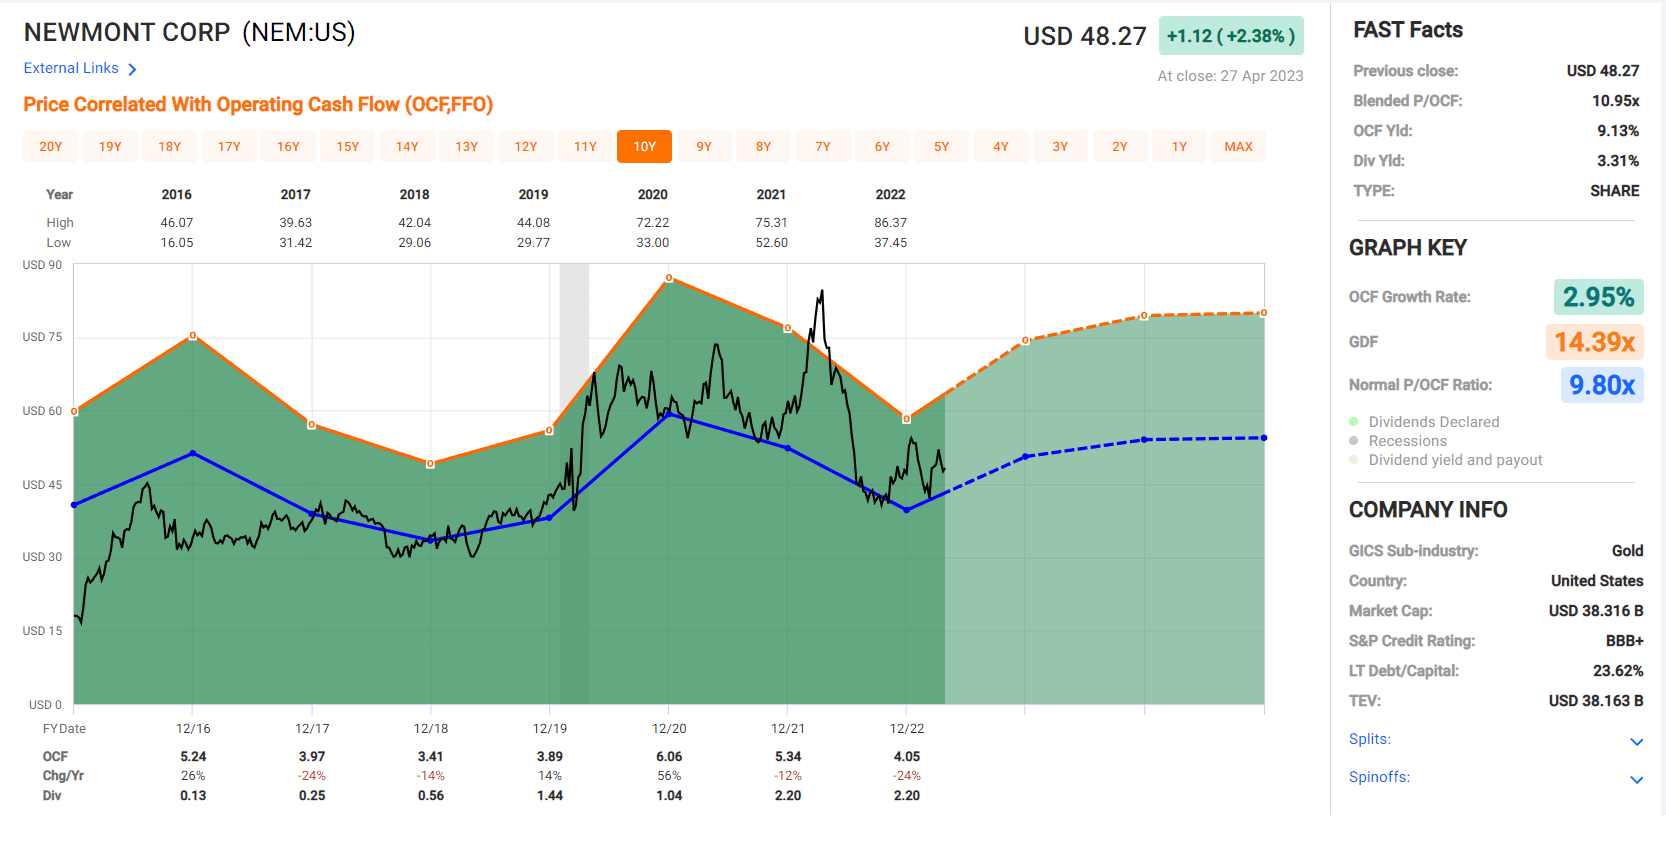
Based on ~795 million shares and a share price of $47.00, Newmont trades at a market cap of ~$37.4 billion and an enterprise value of ~$40.1 billion. This makes Newmont one of the most expensive names sector-wide on a P/NAV basis, though this is mostly justified because of its scale (largest producer attributable) and production profile that comprises ~50% of production coming from Tier-1 jurisdictions. Meanwhile, from a cash flow standpoint, the stock is trading only slightly below its 10-year average cash flow multiple, with Newmont sitting at ~9.3x conservative FY2023 cash flow per share estimates ($5.02).
Newmont - Historical Cash Flow Multiple (FASTGraphs.com)
If we assume a fair multiple of 11.0x cash flow to Newmont given that its portfolio has improved since the Goldcorp acquisition and the creation of Nevada Gold Mines LLC to optimize these now-shared Nevada assets, this points to a fair value for Newmont of $55.20 per share. However, while this fair value estimate points to the limited upside for Newmont from current levels, its vast development portfolio is not captured in current cash flow per share estimates, and I see a conservative value for probable projects of $3.5 billion ($4.40 per share). After adding this to Newmont's fair value based solely on an 11.0x cash flow multiple, I see a fair value for the stock of $59.60.
Newmont - Development Portfolio (Company Presentation)
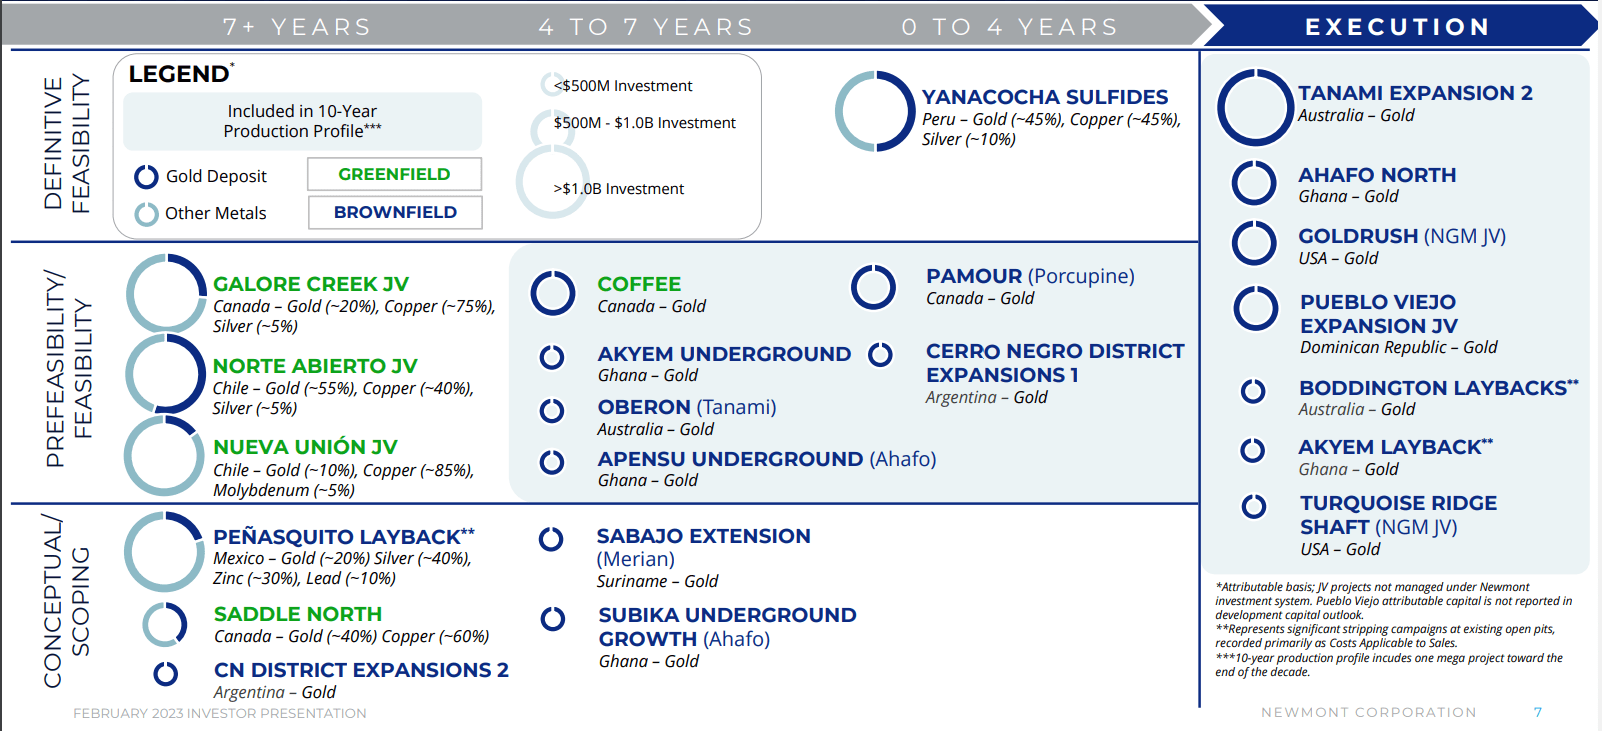
Although this points to a 26% upside from current levels, which is a more attractive upside case than several producers that have outperformed this year and are trading at more expensive valuations like Lundin Gold ( LUGDF ) and Torex Gold ( TORXF ), I am looking for a minimum 30% discount to fair value to justify starting new positions in large-cap producers. And if we apply this to Newmont's fair value estimate of $59.60, this points to a low-risk buy zone of $41.65 or lower. Hence, the stock is still not in what I'd consider being a low-risk buy zone. Finally, this is corroborated by the technical picture, with Newmont still trading over 16% above its long-term moving average (green line) which has typically been a good place to go long the stock.
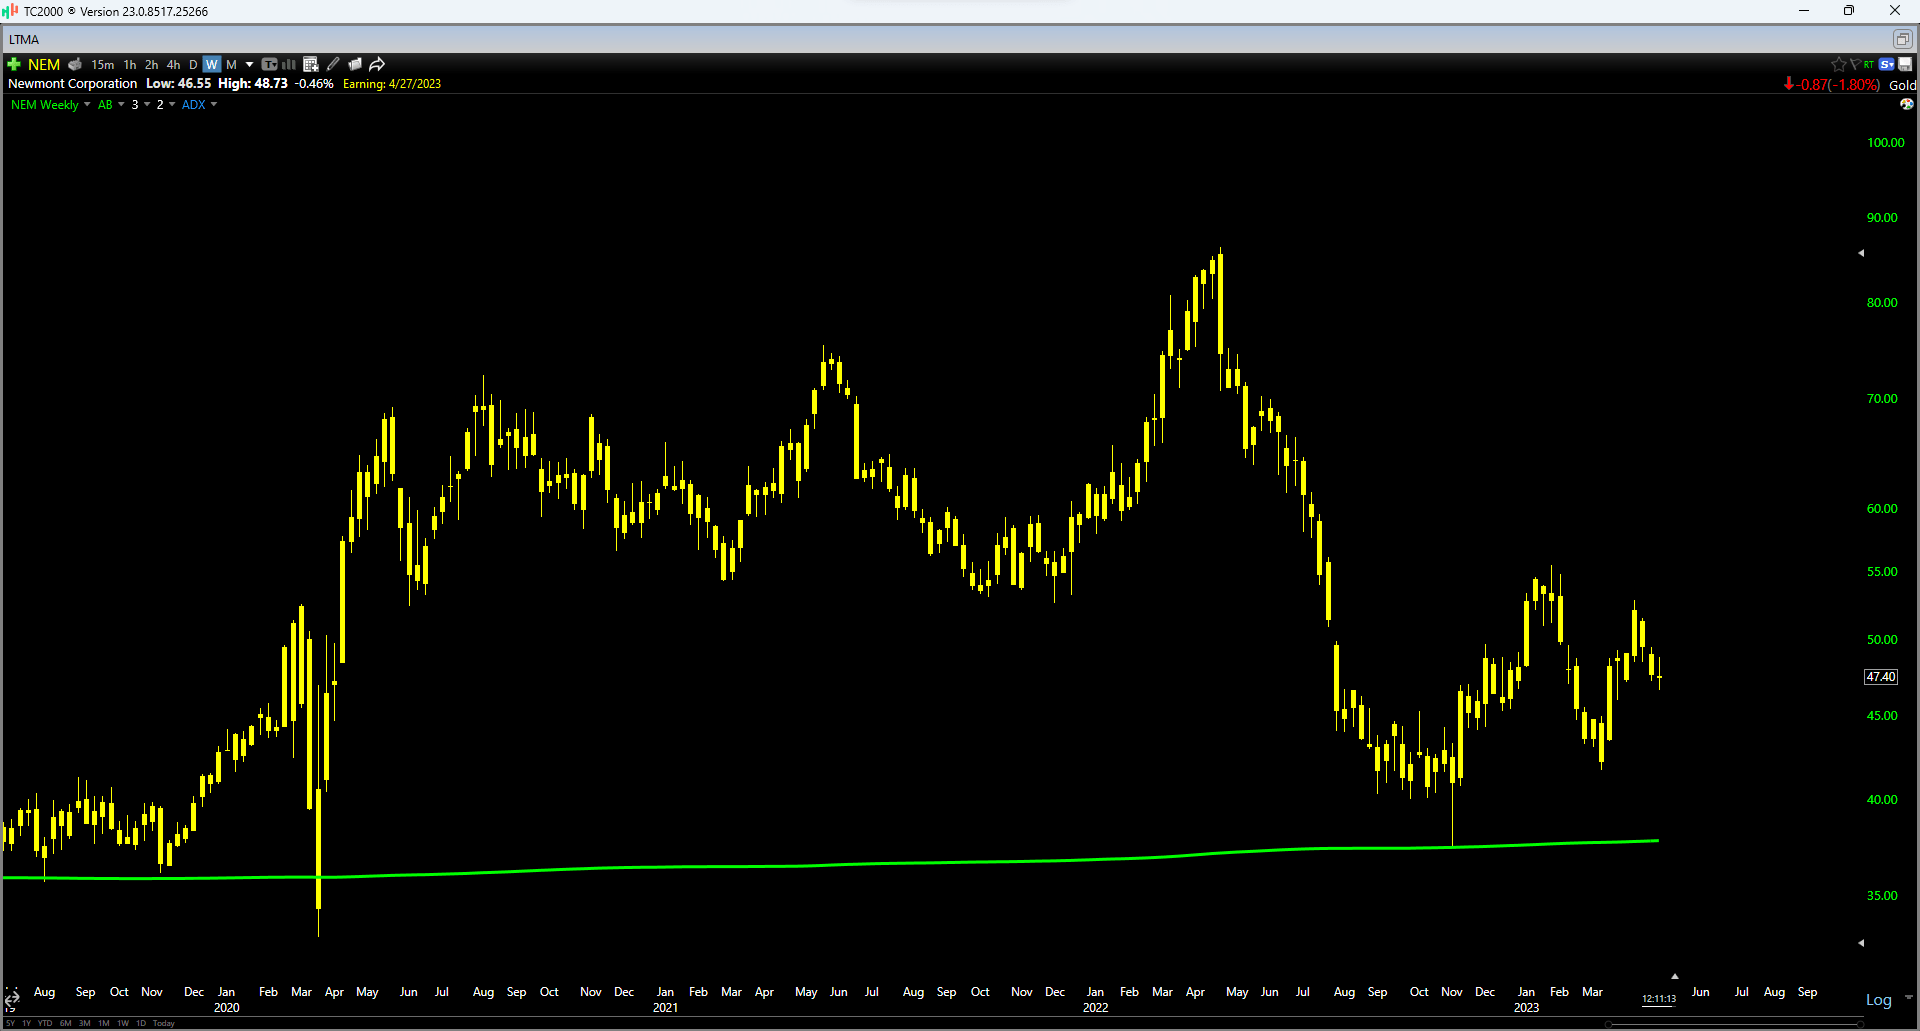
Summary
Newmont Corporation's headline Q1 results were disappointing with lower production, significantly lower sales, rising costs, and negative free cash flow, all despite a higher average realized gold price. That said, there are nuances worth pointing out, which included a very weak Q1 from the Carlin Complex (38.5% interest), production winding down at Long Canyon, a delayed concentrated shipment at Penasquito, flooding that halted milling at Tanami, and much higher sustaining capital and capital spend overall as Newmont works through a growth phase as it advances multiple projects at once. So, while I wouldn't call this a kitchen-sink quarter, I think it's unfair to judge the company on what were abnormally weak Q1 results.
Fortunately, H2 will be much better for the company and its financial results should progressively improve as the year progresses, with Q2 benefiting from higher production across the portfolio (Boddington and Tanami especially), improved metals prices if gold and silver continue to cooperate, and improved unit costs as its production increases. And if we look ahead to FY2026, NEM should be a much different-looking miner (even if it's not successful in its Newcrest (NCMGF) bid ), with ~10% higher production at sub $1,100/oz AISC.
That said, I only like starting new positions when there's a significant margin of safety in place, and I don't see that just yet with Newmont Corporation. So, while I continue to watch Newmont Corporation, I would need a pullback closer to $42.00 to be more interested.
For further details see:
Newmont: Worst Quarter Of The Year In Rearview Mirror