WEAT - News From Russia Could Be Very Bullish For The WEAT ETF Product
2023-07-19 20:07:47 ET
Summary
- The war in Ukraine has led to a surge in CBOT wheat futures prices due to concerns about supply and price. In 2022, Russia and Ukraine accounted for 27% of worldwide wheat exports.
- The USDA's WASDE report indicates that while global ending inventories declined, ending U.S. stocks increased. The report also raised its forecast for Russian wheat exports, and worldwide consumption expectations increased.
- The Teucrium Wheat ETF product tracks a portfolio of CBOT wheat futures contracts. Russia's decision to terminate the grain agreement with Ukraine could lead to higher wheat prices.
Three wheat futures trade in the U.S. futures market, with other contracts trading in foreign exchanges. In the U.S., the CBOT soft red winter wheat futures, the KCBT hard red winter wheat futures, and the MGE spring wheat futures reflect the wheat quality and protein content coming from different areas of the U.S. wheat-producing states. The CBOT soft red winter wheat is the most liquid and leading futures contract and a benchmark for worldwide wheat prices. CBOT wheat futures have the highest daily volume and open long and short positions.
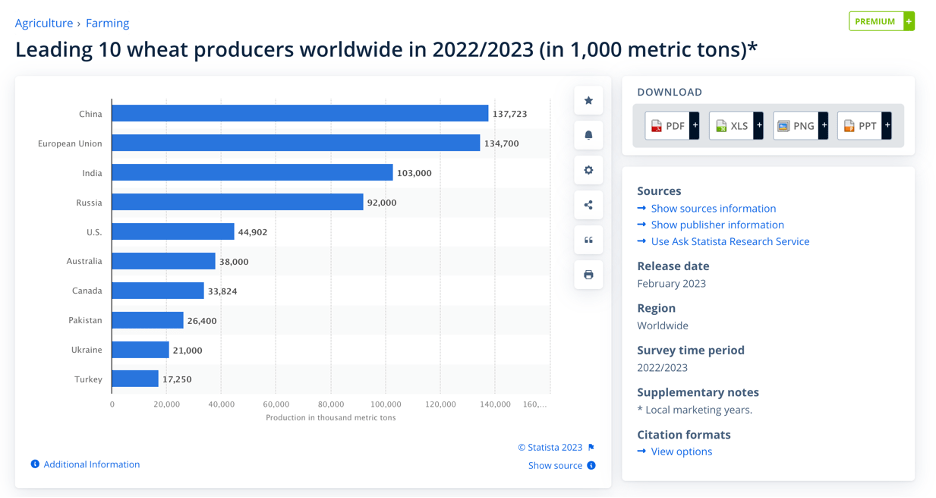
While the United States produces wheat, worldwide requirements cause many other countries to produce the grain. In 2022, the top wheat-producing countries were:
The chart highlights Russia and Ukraine produced 113 million metric tons of wheat in 2022/2023, making them the third leading worldwide producer behind the European Union and ahead of India.
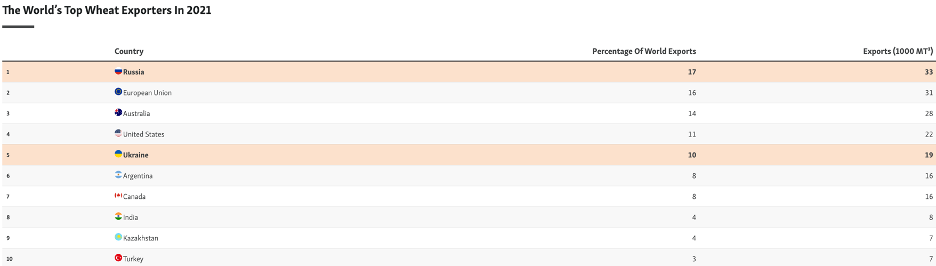
In 2021, before the war in Ukraine, the world's leading wheat exporters were:
Russia and Ukraine accounted for 27% of worldwide wheat exports. In March 2022, after Russia invaded Ukraine, CBOT wheat futures prices rose to a record $14.2525 per bushel on price and supply concerns. The price corrected to a $5.7325 low in May 2023, which could be a significant bottom, given the recent events in Europe's breadbasket.
The Teucrium Wheat ETF product ( WEAT ) tracks a portfolio of CBOT wheat futures contracts higher and lower.
Knee jerk selling after the July WASDE report
The USDA's monthly WASDE report is the gold standard for fundamental supply and demand data for the agricultural products that feed and increasingly fuel the world. While the WASDE provides a snapshot, many factors can cause the fundamental equation to shift during the northern hemisphere growing season. The report often moves futures prices in the volatile agricultural futures arena.
The July 12 World Agricultural Supply and Demands Estimates Report was not all that bullish for the wheat futures market. The USDA said:
Changes this month to the 2023/24 U.S. wheat outlook increase supplies and domestic use, leave exports unchanged, and increase ending stocks. Supplies are raised on larger production, which is up 74 million bushels to 1,739 million, on higher harvested area and yields. The first 2023/24 survey-based production forecast for other spring and Durum indicates a decrease from last year. Conversely, winter wheat production is forecast higher on larger harvested area and higher yields. Gains for all wheat production are partly offset by smaller beginning stocks, which are lowered 18 million bushels to 580 million as indicated in the Grain Stocks report, issued June 30. The 2023/24 ending stocks are forecast at 592 million bushels, 30 million higher than last month. The projected season-average farm price is forecast at $7.50 per bushel, down $0.20 from last month. This month provides the first by-class 2023/24 U.S. wheat supply and use projections. Two consecutive years of drought-affected Hard Red Winter (HRW) wheat crops reduce HRW ending stocks to the lowest level in 16 years despite decreased total use. HRW food use is forecast to be the smallest since 2010/11, while HRW exports are the lowest since by-class supply and utilization records began in 1973/74. Updates to the 2023/24 global wheat outlook reduce supplies, increase consumption, lower exports, and decrease stocks compared with last month. Supplies are reduced 0.9 million tons to 1,066.0 million as lower global production is partially offset by larger beginning stocks. Production is reduced primarily for the EU, Argentina, and Canada, and is only partially offset by increases for the United States and Pakistan. EU production is lowered 2.5 million tons to 138.0 million, as ongoing dry weather diminishes yield prospects primarily in Germany, Spain, France, and Italy. The forecast for Argentina wheat production is decreased 2.0 million tons to 17.5 million based on revised government estimates of planted area. Dry conditions in parts of Alberta and Saskatchewan lowers production for Canada 2.0 million tons to 35.0 million. Global trade is projected down 1.0 million tons to 211.6 million as lower exports from Argentina and Canada are only partially offset by more exports from Russia. World consumption is raised 3.3 million tons to 799.5 million, primarily on increased feed and residual use in China where rains at harvest, especially in Henan province, degraded wheat quality for food use. Projected 2023/24 world ending stocks are lowered 4.2 million tons to 266.5 million and would be the fourth consecutive annual decline.
While global ending inventories declined, ending U.S. stocks increased. The USDA raised its forecast for Russian wheat exports, and worldwide consumption expectations increased. While the WASDE said worldwide supplies would decline for the fourth consecutive year, wheat prices fell after the July report.
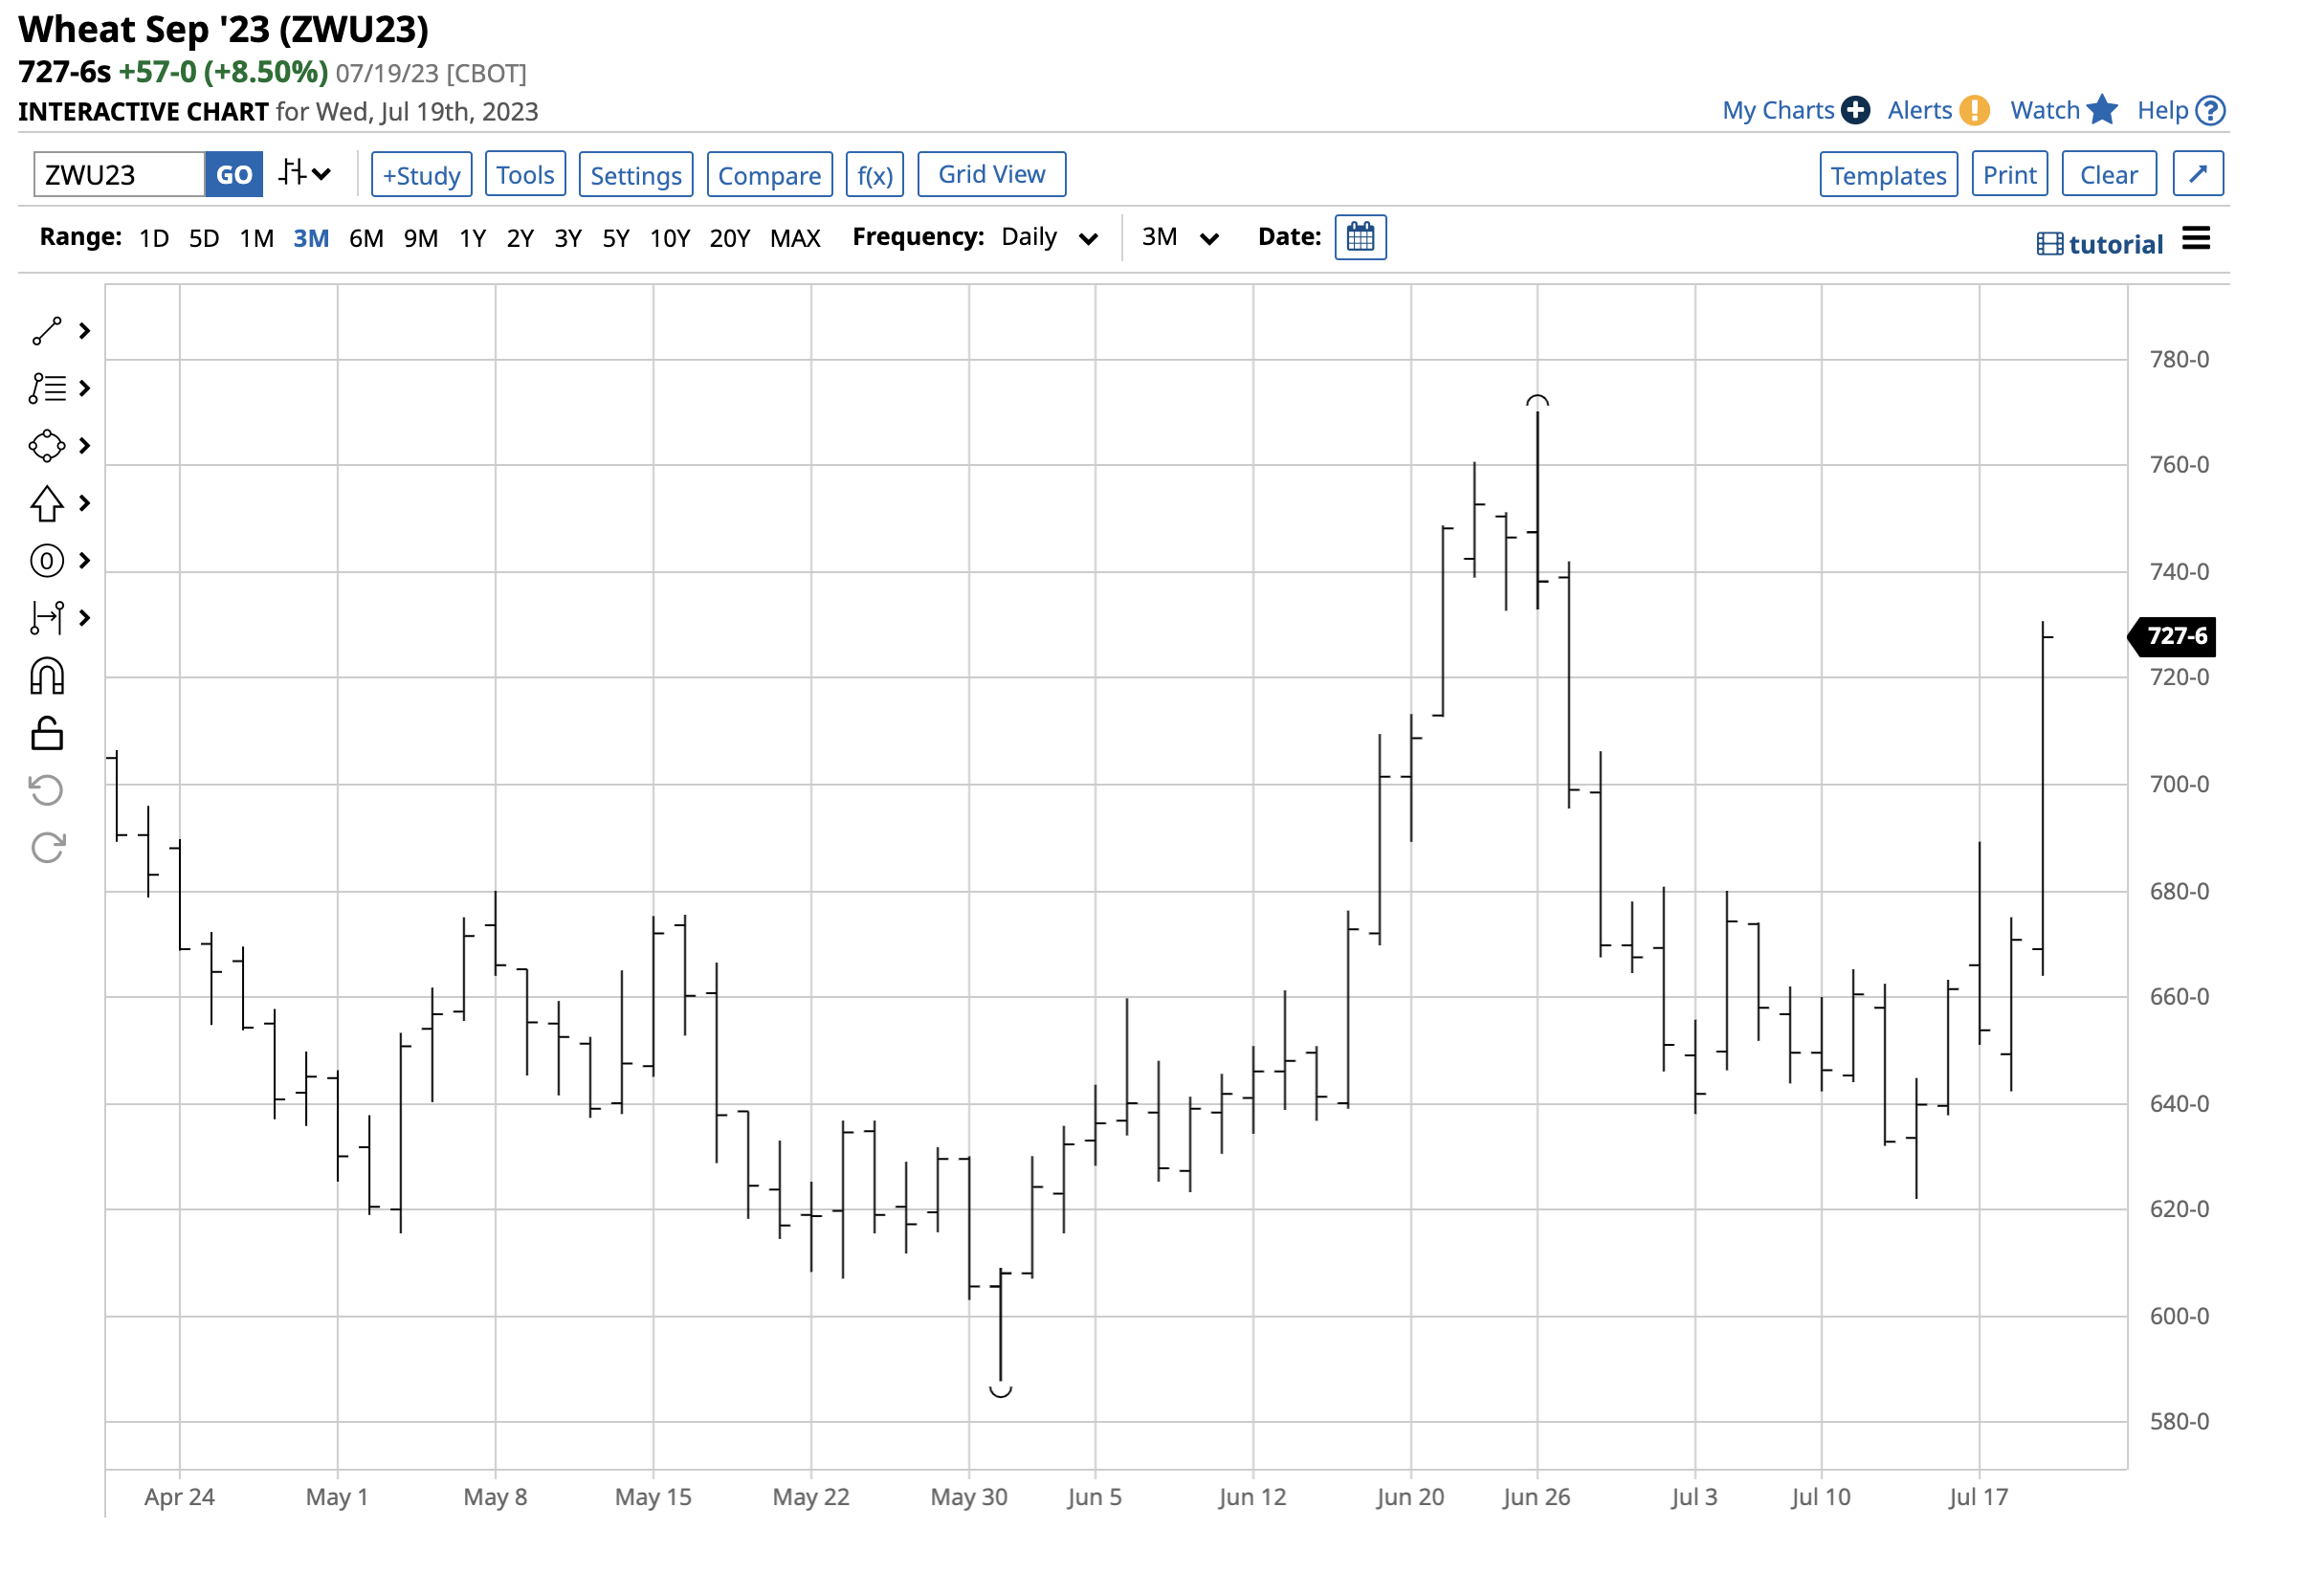
The chart highlights nearby new-crop September CBOT soft red winter wheat futures settled at $6.6050 per bushel on July 11, before the USDA report, and was in a bearish short-term trend. The market's immediate reaction was to sell, pushing the September futures to a $6.22 low on July 13. Wheat prices did not remain under pressure for long.
Sal Gilbertie hit the nail on the head
I reached out to Sal Gilbertie, the founder of the Teucrium family of grain ETFs, including the WEAT, CORN, and SOYB products, for his take on the July WASDE report. On July 12, Sal told me:
The USDA took the opportunity in its July WASDE report to adjust corn yields per acre downward which was needed given the dryness much of the corn-belt experienced early this season. No doubt the USDA remembers that a similar early dry pattern occurred in 2013 but late July and good August rains that same year saved the corn crop and started a multi-year pattern of good weather and record corn production that eventually took grain prices to their cost of production. Projected soybean yields this month remain unchanged, which is sensible given that August weather is what really matters for soybean production. That said, the huge decline in planted soybean acres announced in the June 30th acreage reports motivated the USDA to cut back on soybean usage in order to salvage the soybean balance sheet from what could still become record or near-record low ending stocks in the 2023/24 growing season. Given Brazil's healthy corn and soybean crops, and Russia's massive wheat supplies and competitively priced wheat exports, the USDA can, and did, reasonably cut US grain exports to keep balance sheets relatively balanced. Weather and war will determine the future price trajectory of grains even as this month's WASDE report clearly gives a boost to the current downward price pressures across the grain complex.
While Sal said the July WASDE " gives a boost to the current worldwide downward price pressures across the grain complex ," he said, " Weather and war will determine the future price trajectory of grains ."
Wheat is the world's most political commodity: The war in Ukraine highlights wheat's significance
When answering the question of what is the most political commodity, many market participants and laypersons would respond that crude oil is the raw material that is most sensitive to the geopolitical landscape. After all, the international oil cartel controls the price, and oil shocks have occurred periodically over the past decades. Russia's participation as the most influential cartel non-member created OPEC+ and increased its global pricing power.
However, students of history know that wheat, the primary ingredient in the bread that feeds billions worldwide, has a far longer history as a political commodity. High wheat prices and scarce availabilities can cause political insurrection leading to governmental change. While there are many historical examples, the most recent was the Arab Spring, which caused the political change to sweep across North Africa and the Middle East. The event began as a series of bread riots in Tunisia and Egypt.
On Monday, July 17, the Russian government suspended its participation in an agreement that allowed Ukrainian grain exports. The Black Sea ports, a critical agricultural logistical hub, have been a war zone since Russia invaded Ukraine in February 2022. However, Moscow allowed grain exports to calm fears over global food supplies. The grain agreement was a diplomatic concession, but Russia terminated the deal earlier this week. Wheat, corn, and soybean futures soared after the Russian announcement.
Moreover, Russia banned ships from the region starting on Thursday, July 20, in what could be an escalation that leads to the bombing of the ports, rendering them useless. The end of the Ukraine grain deal sends shivers worldwide, impacting the global food supply chain. Regarding wheat, the bearish USDA WASDE report said that consumption is rising, and ending stocks have declined for the fourth straight year. The bottom line is the conditions that sent CBOT wheat futures to a record peak in March 2022 are back with a vengeance.
After a dramatic selloff, lots of upside room
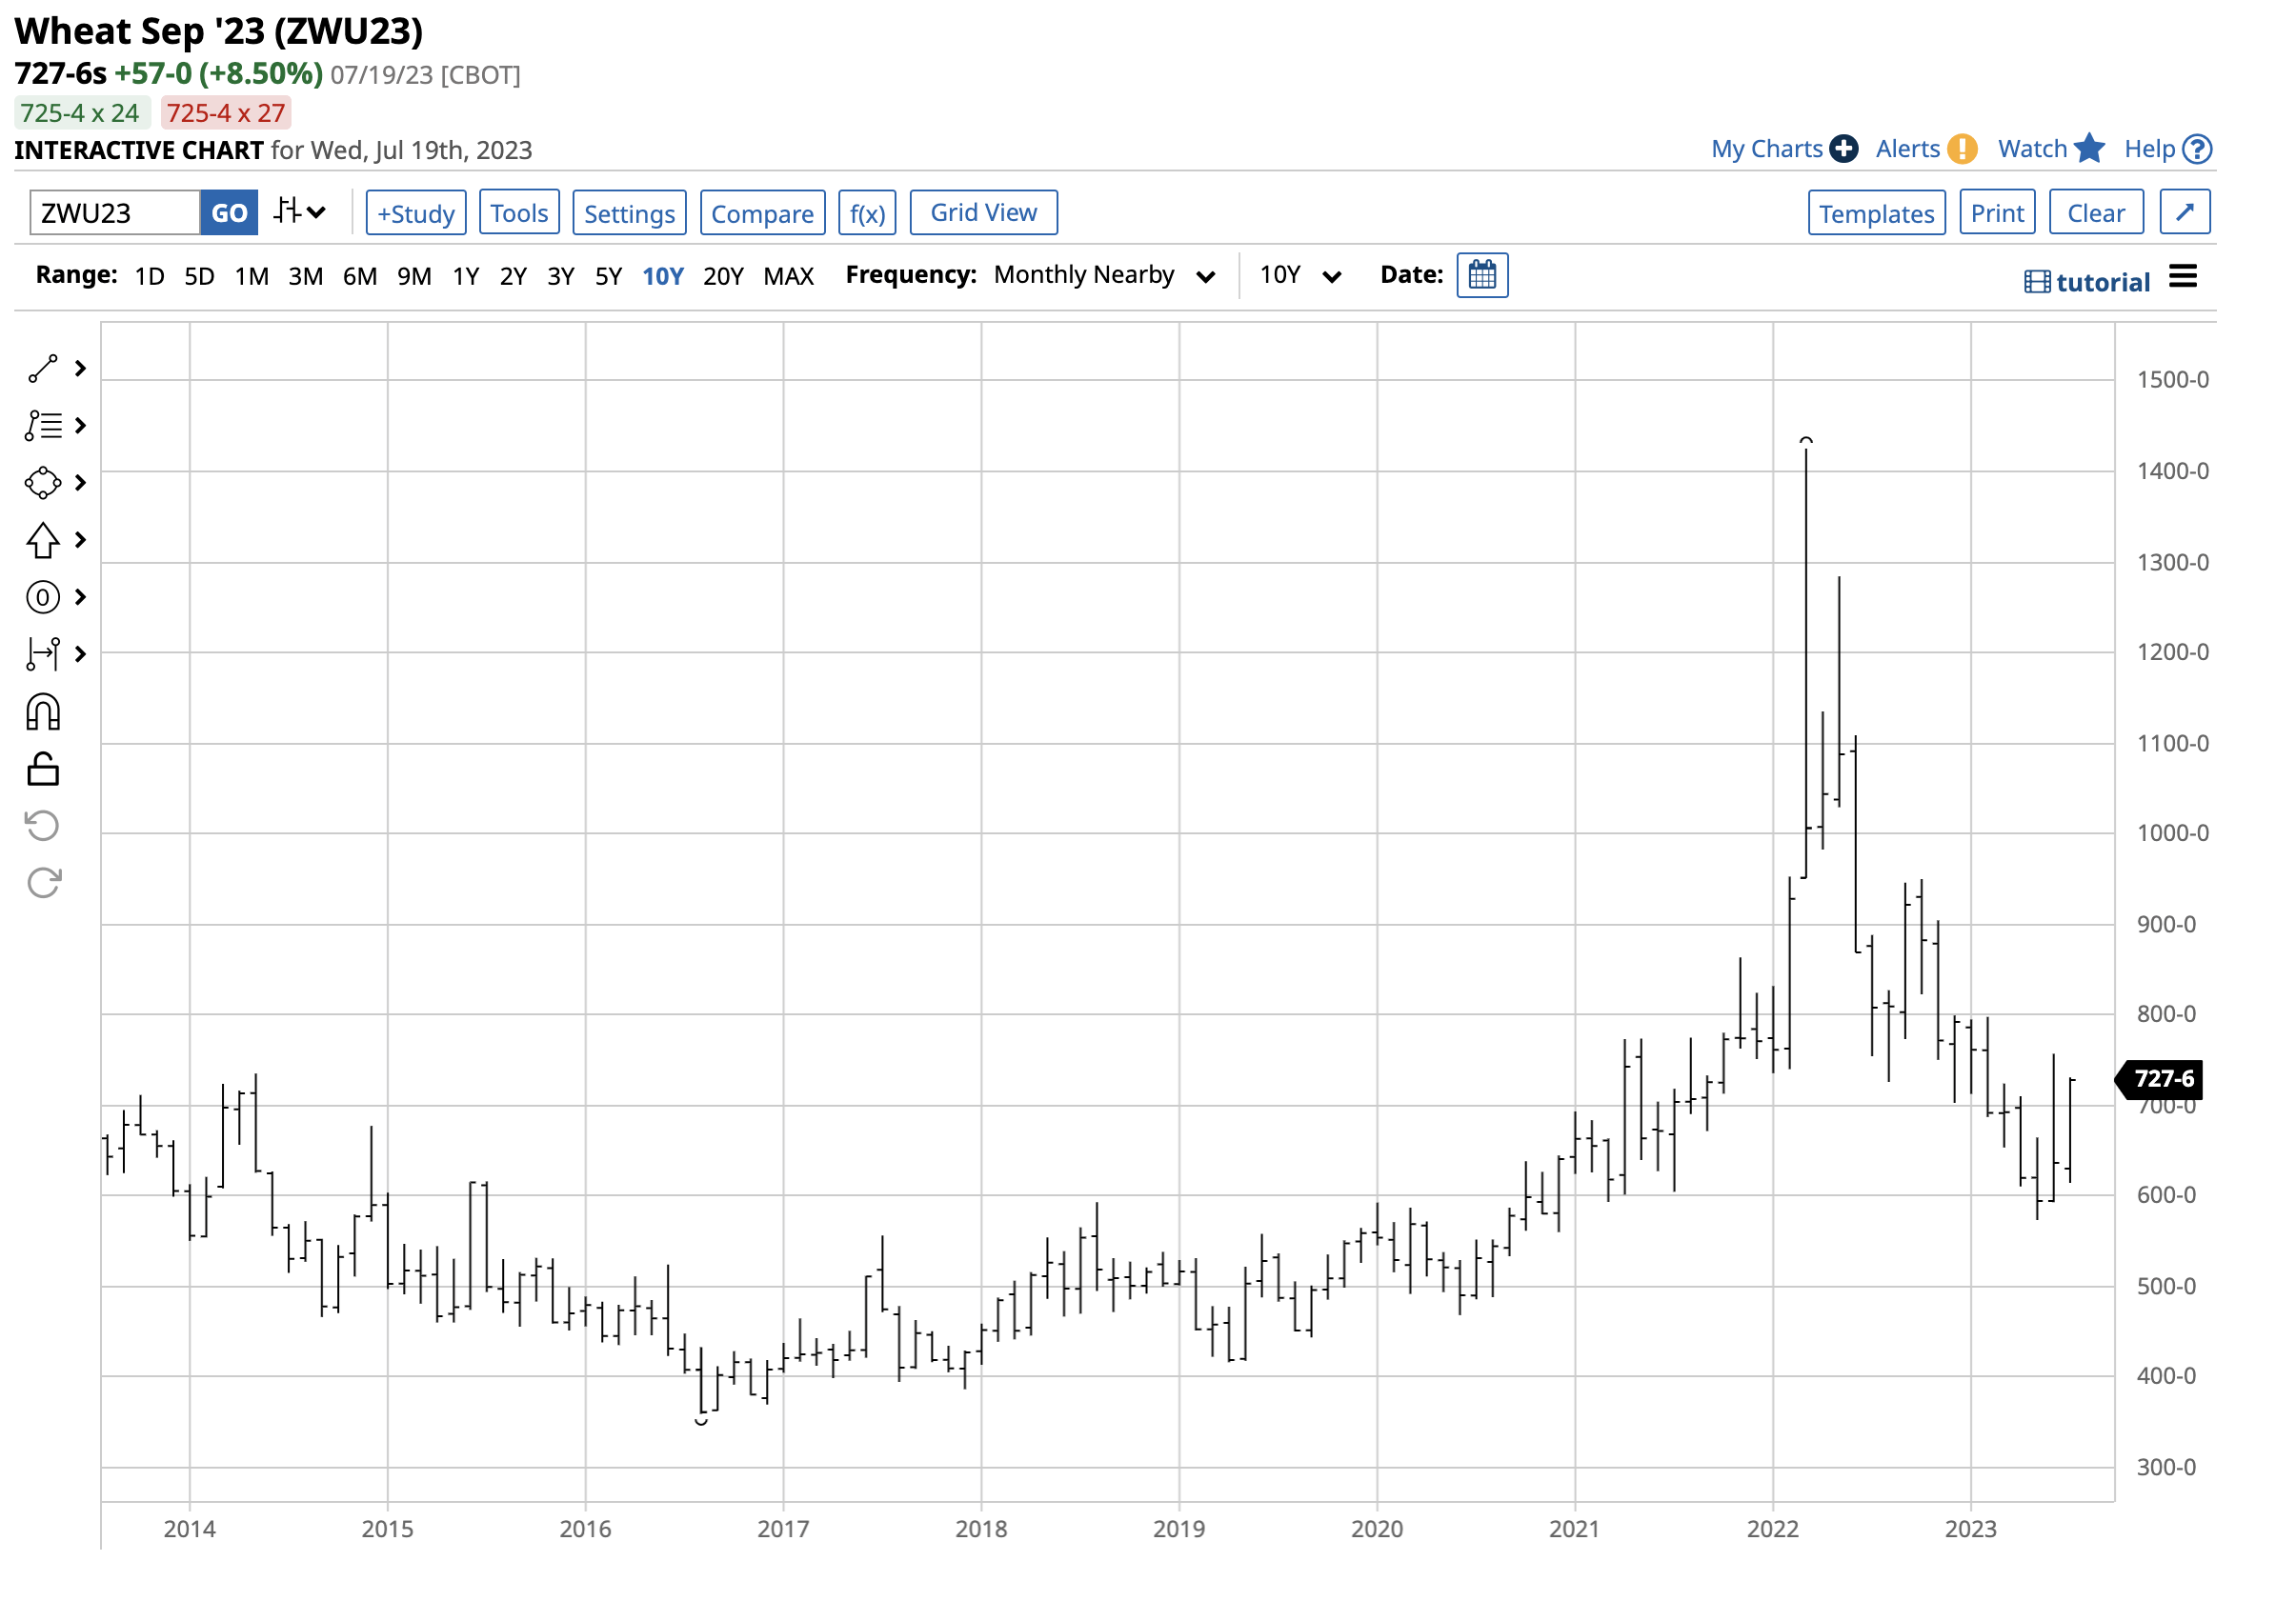
The long-term continuous CBOT wheat chart shows that the recent bounce from the May 2023 $5.7325 low has not broken above technical resistance and could have lots of room to add to gains.
The 10-year CBOT wheat futures chart highlights the 59.8% drop from the March 2022 record $14.2525 high that took the price to the May 2023 low. Since then, nearby CBOT wheat prices have risen to $7.5675 per bushel, a 32% rally from the low. At over $7 on July 19, wheat futures are threatening to challenge the bearish path of least resistance. A move above the $7.60 per bushel level would negate the over-year-long bearish trend, ushering in a new bullish period for the world's most political commodity.
There are no signs that Russia will back down from its recent withdrawal from the grain agreement, and an escalation of the war that impacts 2023 Russian and Ukrainian crops would upset the wheat's worldwide fundamental equation, leading to higher prices and dangerous shortages.
WEAT is the wheat ETF product that tracks CBOT soft red winter wheat
The CME's highly liquid futures and futures options are the most direct route for a risk position in the worldwide soft red winter wheat market. Market participants seeking exposure to the potentially explosive commodity without venturing into the highly volatile, leveraged, and margined futures arena can turn to the Teucrium Wheat ETF product ((WEAT)). At $7.11 per share on July 19, WEAT had over $180.7 million in assets under management. WEAT trades an average of nearly 1.5 million shares daily. While Barchart reports a 0.22% expense ratio, Seeking Alpha has the management fee at 1.00%. The Teucrium website could be the most accurate source, with a 0.28% expense ratio.
WEAT's fund summary states:
The most recent top holdings include:
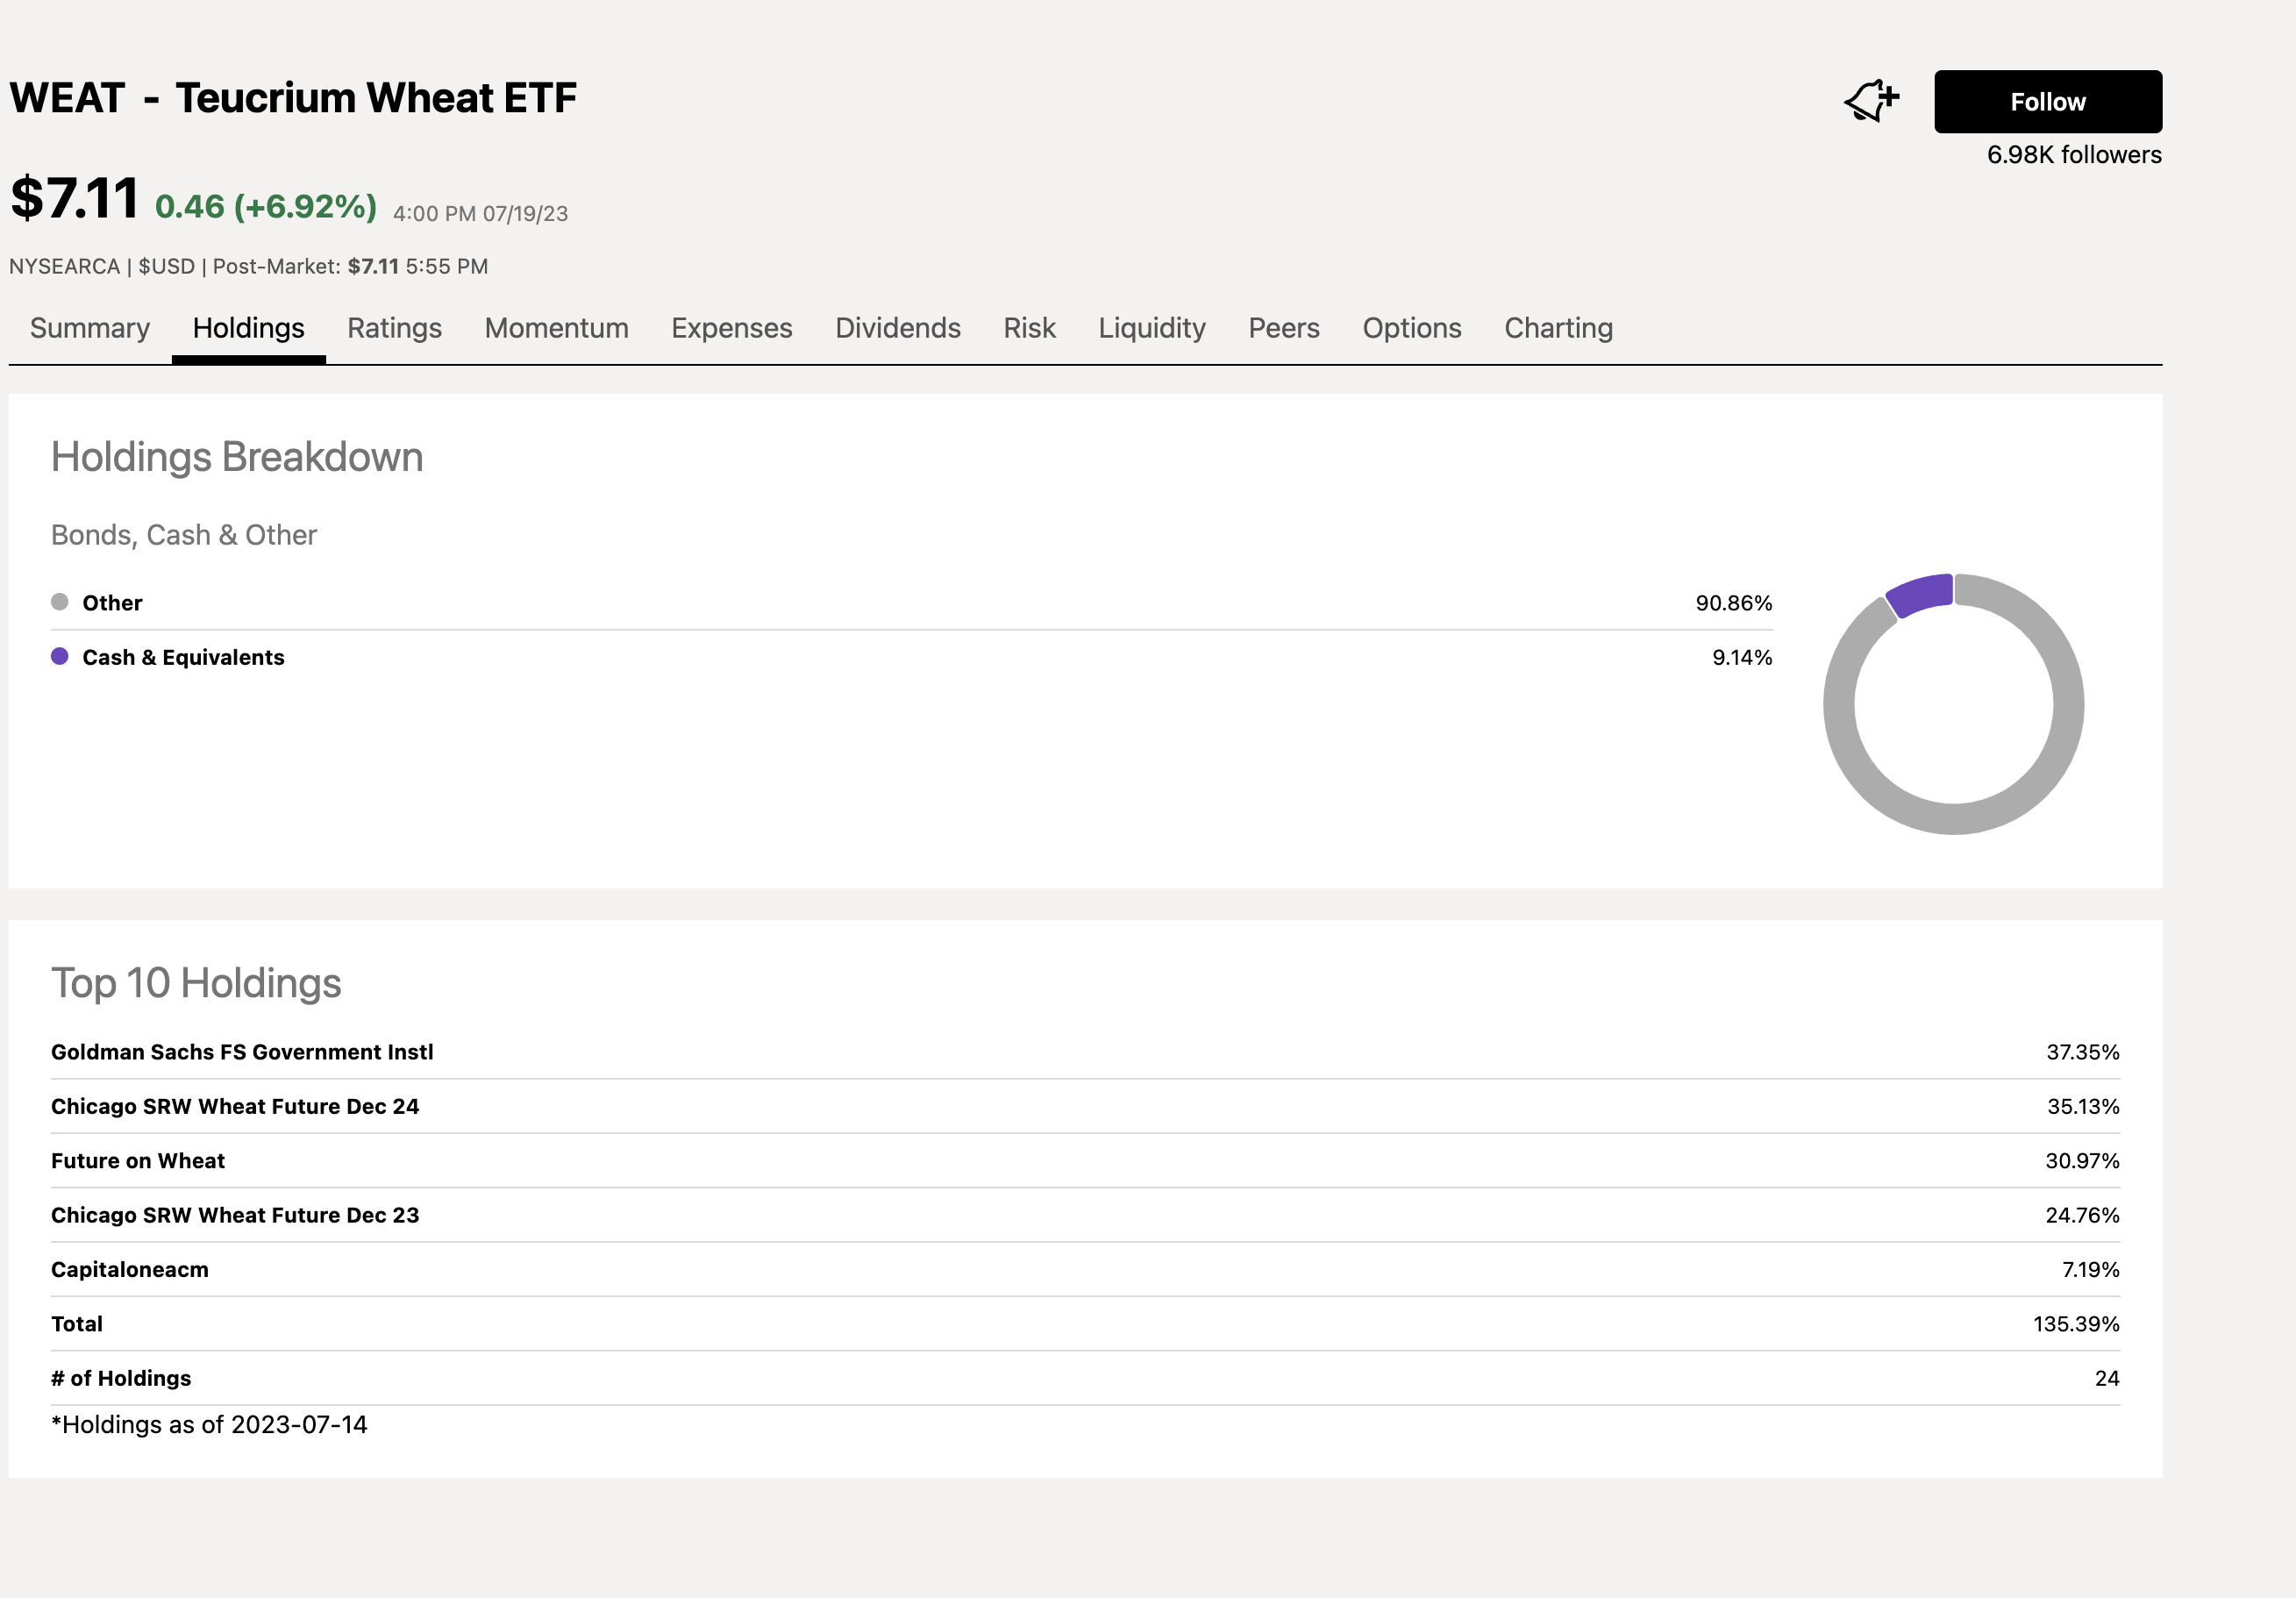
WEAT holds three CBOT wheat futures contracts, excluding the nearby contract to minimize roll risks. Since the nearby contract attracts the most speculative interest, it often displays the highest volatility. Therefore, the WEAT ETF may underperform the nearby futures during rallies. Conversely, it tends to outperform during downside corrections.
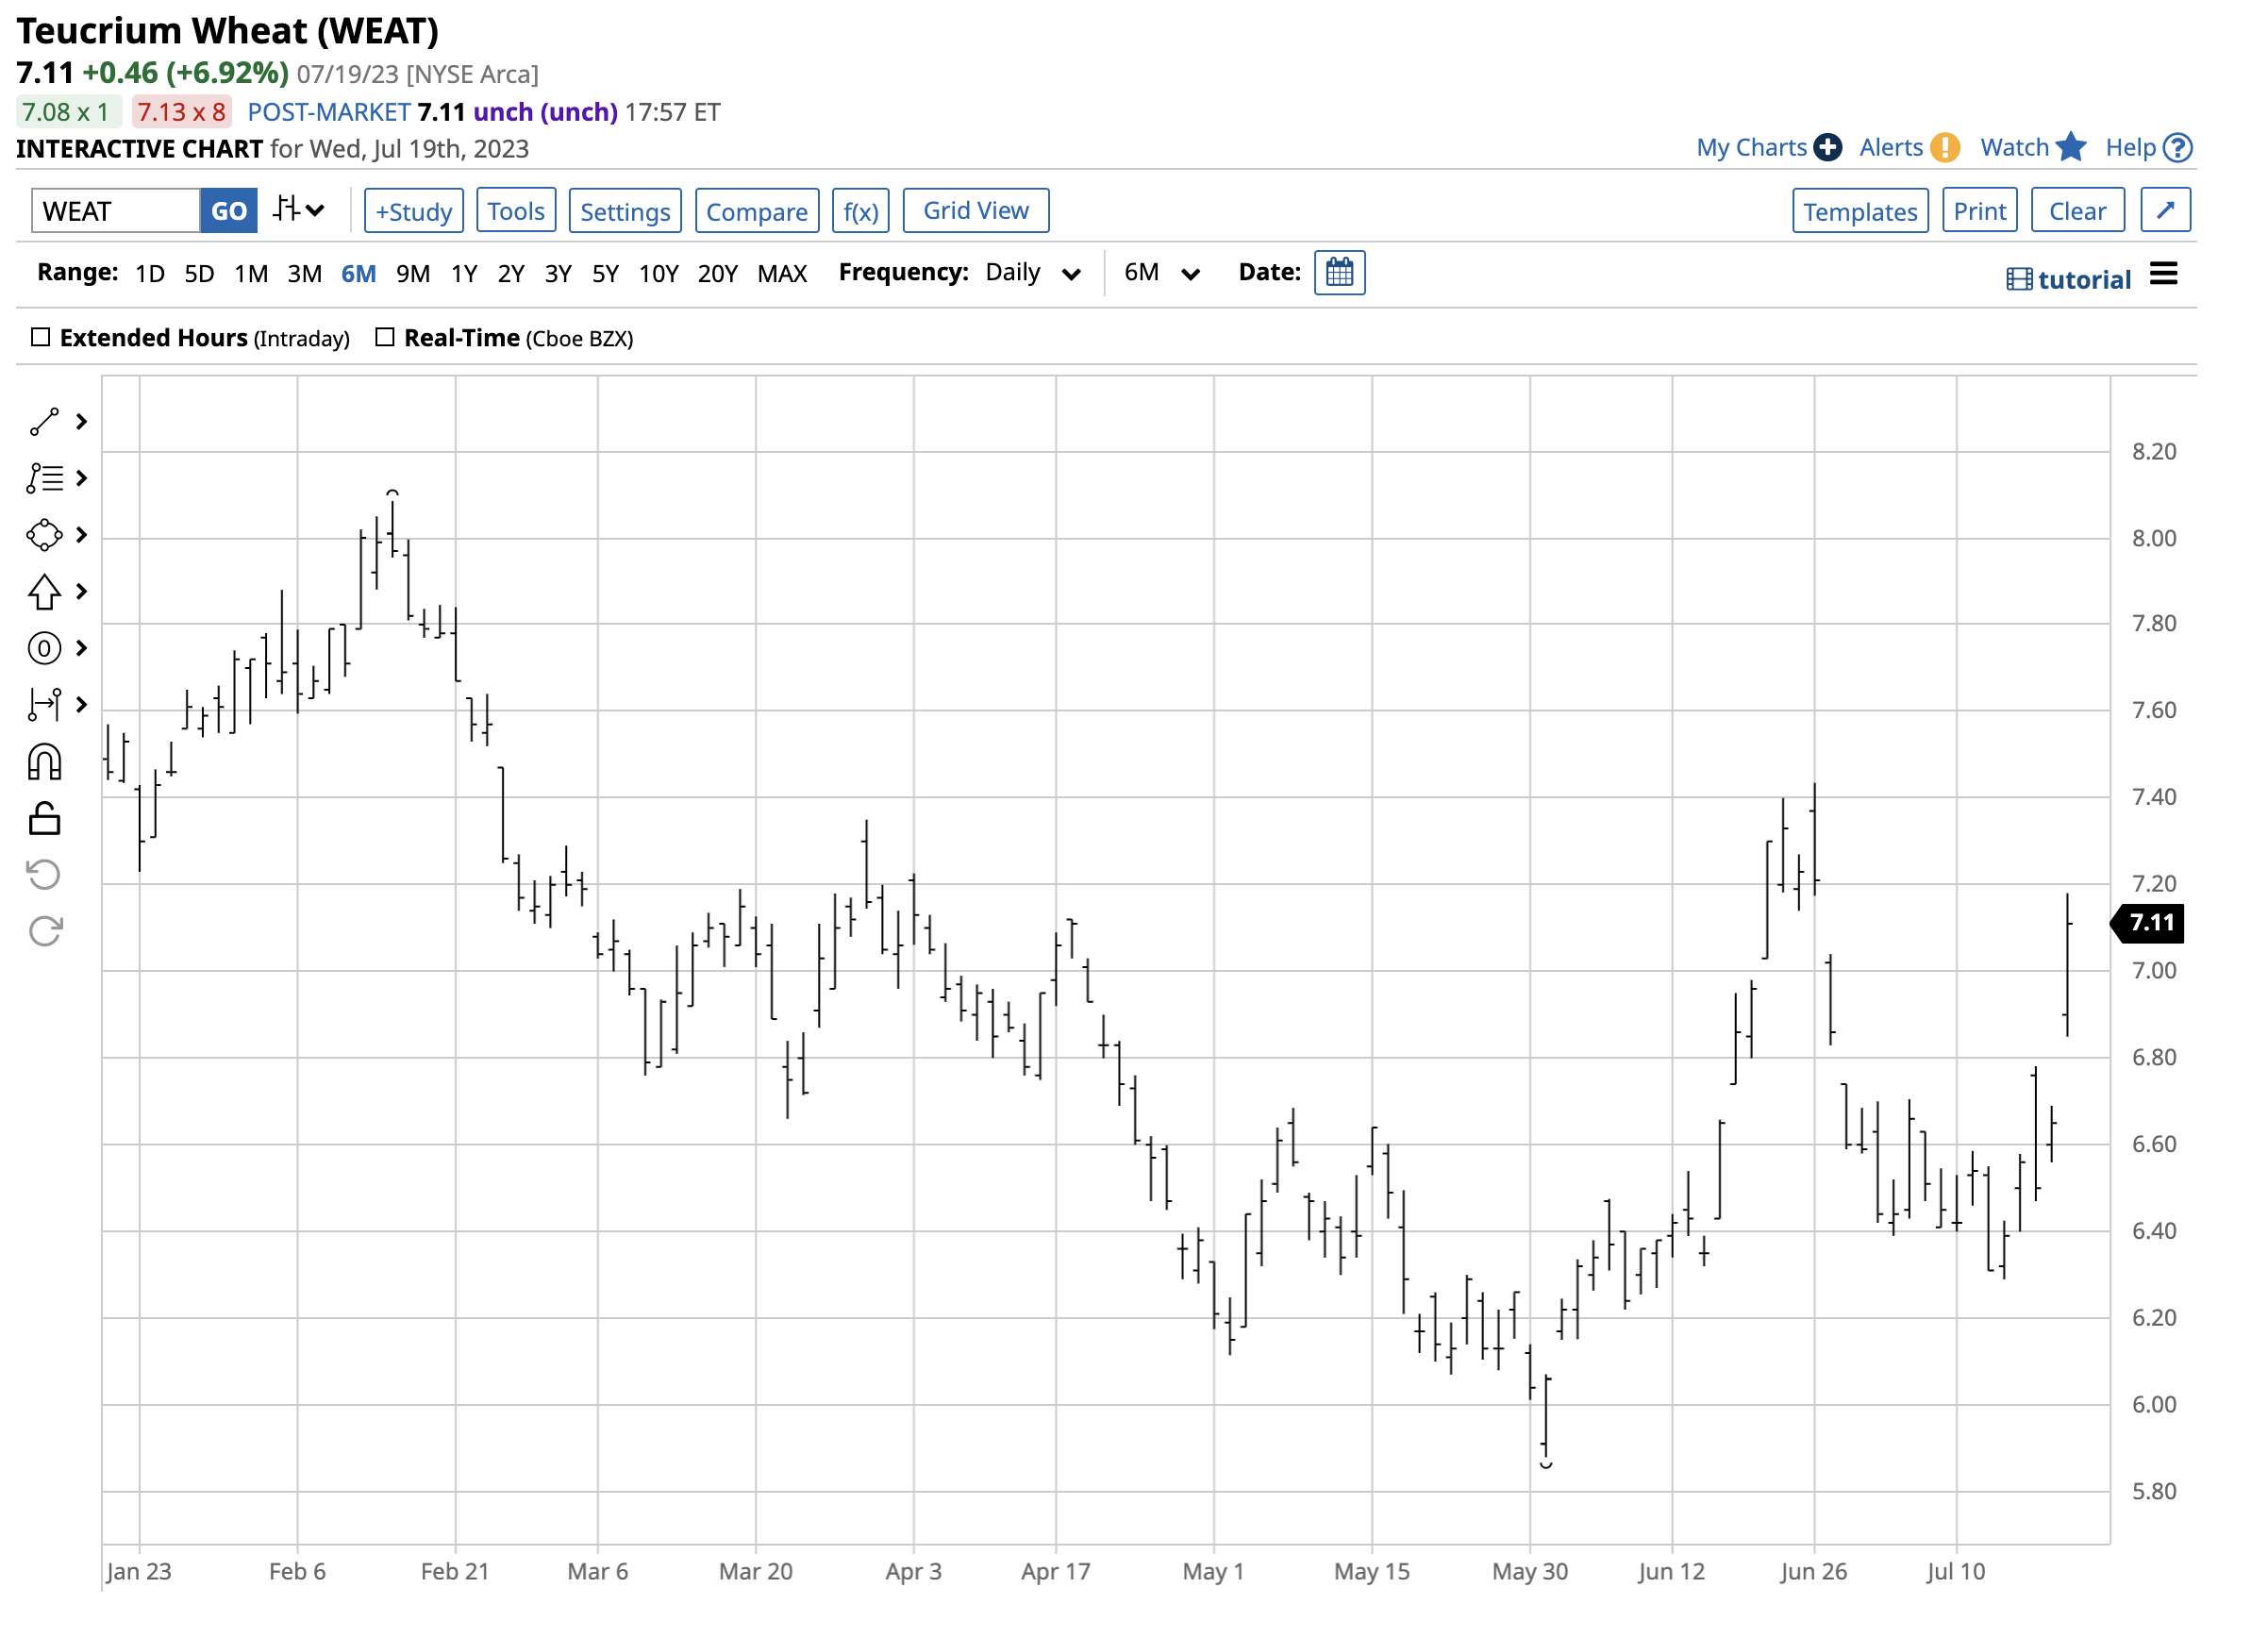
September CBOT wheat futures rose 17.5% from $6.22 on July 13 to $7.3075 per bushel on July 19.
Over the same period, the WEAT ETF moved from $6.29 to $7.18 per share or 14.15%, as the ETF did an excellent job tracking the CBOT wheat futures but underperformed because it holds three CBOT contracts.
Russia's decision to terminate the grain agreement is a compelling reason for higher wheat prices. The WEAT ETF should move higher and lower with the grain's benchmark futures contracts that feed the world.
For further details see:
News From Russia Could Be Very Bullish For The WEAT ETF Product