NXGN - NextGen: A Liquid Diversifier To Equity Risk Continued Buy At 16x P/E
2023-05-10 12:45:54 ET
Summary
- NextGen Healthcare still presents with attractive business economics in my opinion.
- Around 92% of revenue is recurring as of Q3 FY'23 and provides predictability in future cash flows.
- Returns on existing capital are strong, but the incremental investments haven't been as fruitful.
- Net-net, reiterate NXGN as a buy to balance equity risk in single and cross-asset portfolios.
Investment Summary
It has been a continuously flat run over the last 6-months of trade for holders of NextGen Healthcare, Inc (NXGN) common stock. I had argued in favor of this within the last NXGN coverage, noting the company's position as a potential defensive overlay to reduce portfolio variance. The company's long-term congestion in market-value offers plenty of balance to equity risk in my opinion, backed by robust fundamentals. Indeed, that would have been the case from 2018 up until the testing point (see: last NXGN publication , Exhibit 7, Exhibit 8).
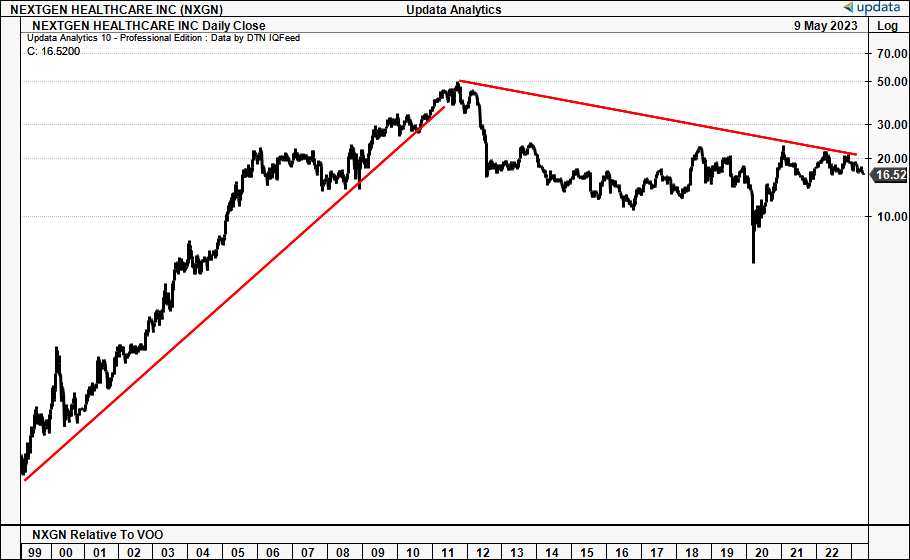
I believe this is still the case today, but it is important to still provide context. This is a mature firm founded in 1974 that found its footing on the NASDAQ back in the mid-90's. NXGN offered life-changing status to its stockholders from listing up until 2011, running from ~$0.40 cents at the low in '98 to an all-time closing high of $50.00, otherwise 12,500% cumulative return [Figure 1]. You're $1,000 investment in c.1998 was worth a tidy $125,000 by mid-2011. It didn't run off course following the dot-com bubble or the GFC, either.
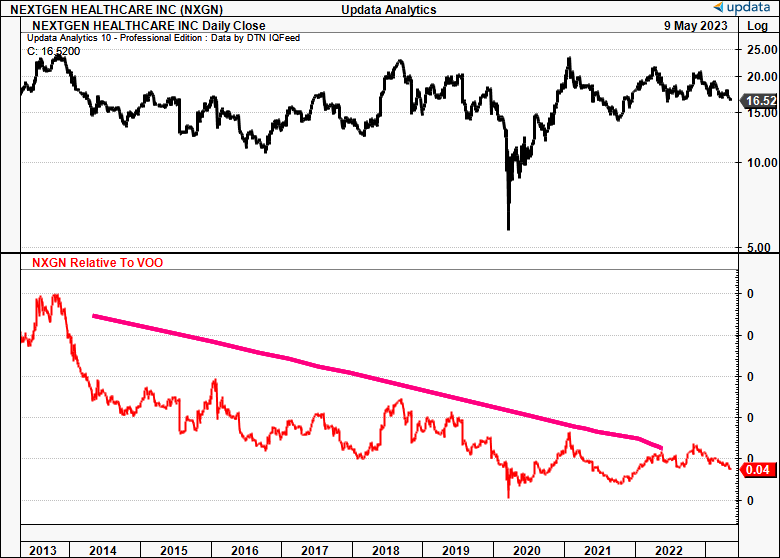
The period from 2011/'12 to date hasn't shared the same performance. Ten-year returns for NXGN investors are negligible at negative 12%, and they are sitting on just ~13% 5-year growth whilst the SPX has rallied >52% in that time. Your $125,000 has pared back to $46,050 for now. For what it's worth, the relative performance of NXGN versus the S&P 500 since 2013 has also drifted lower again in FY'23, in continuation of the longer-term downtrend observed in Figure 2. This kind of underperformance shouldn't be overlooked.
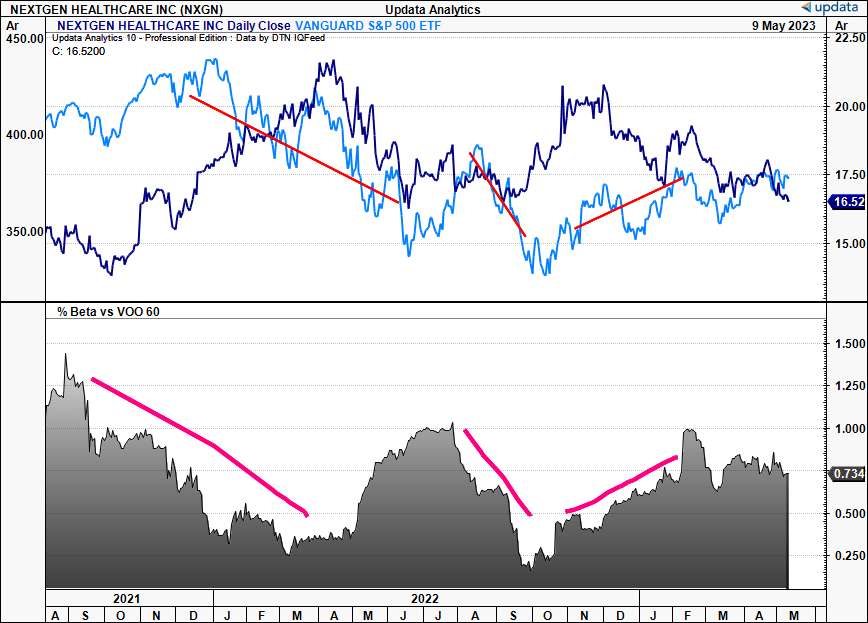
In saying that however, the economic characteristics of NXGN's business did offer investors respite in the 2021 and 2022 selloffs, as seen in Figure 3. The chart shows the directional trend of the S&P 500, including the October 2022 reversal. As shown, NXGN lived up to the defensive thesis. It offered relief during the selloffs as mentioned, but also showed positive correlation in participating in the subsequent rallies. This relationship has started to level off back to range now.
This report will discuss all of the relevant findings in the NXGN investment debate an offer an investment opinion. Net-net, I reiterate NXGN is a buy as a defensive overlay to balance equity risk, and believe the company could be fairly valued at $22-$24 per share.
Note, Figure 1 and 2 are presented in log scale, Figure 3 in arithmetic.
Fig. 1 - NXGN Long-Term Congestion, No Directional Bias (offering plenty of balance to equity risk)
Fig. 2 - NXGN long-term divergence in performance from S&P 500
Fig. 3 - NXGN offering strong respite during 2021 and 2022 selloffs, whilst participating in reversals
NXGN Recent, Long-Term Operating Trends
(1). Overview of current operations
There were positives and negatives worthy of discussion in NXGN's Q3 FY'23 numbers, posted in January. Attention is immediately drawn to the 8% YoY growth in top-line revenues to $162mm. Underscoring the growth was a 19% YoY increase in total bookings to ~45mm, reflecting strength in the core business. It's encouraging to see this trending higher recently as well - 20% sequential increase from Q1, plus a 9% increase in YTD bookings as of January.
Eyes are then drawn to the composition of NXGN's top-line:
- After Q3, we're looking at a record 92% of turnover as recurring revenue, up 11% YoY.
- That equates to c.$149mm in quarterly recurring revenue, $596mm annualized (92% of my FY'23 NXGN revenue estimates).
- Excluding the TSI transaction (discussed later), NXGN's recurring revenue still increased 8% over the year.
This adds a layer of predictability to NXGN's future cash flows in my opinion. To broaden the analysis, using trailing 12 month figures ("TTM") shows the company printed $330mm in gross profit and could do $365mm in gross this year.
A key headwind to watch here is gross margin. It came to 47.3% in Q3 and was down 310bps YoY, as software revenue trends came in weaker. So if you take at potential 43% cost margin in FY'23, I'd be looking at 56% gross this year, below the 5-year average of 57-58%. Keep an eye on this going forward. Gross profit measures a firm's ability to make money. If you scale NXGN's gross margin by its total assets, in the TTM, the firm's assets have produced $0.37 in gross profit for each $1 invested, down from $0.53 in FY'22. Scaling at my FY'23 estimates, I get to gross profitability of $0.42 per $1 in assets for the company.
NXGN also did $28mm in TTM operating income and could do $45-$45mm in core EBITDA this year. In my opinion, this would adjust to ~$100-$127mm pre-tax income when adjusting for R&D as an intangible investment vs. operating expense. I'd argue this is the way to treat NXGN's R&D spend, versus OpEx under GAAP rules. The firm already does capitalize ~$8mm in software costs from gross R&D investment of $28.1mm in FY'22, but in my opinion, the whole amount should be capitalized.
For one, R&D is not tied to the current level of operations. NXGN could operate tomorrow with no further R&D investment. It is therefore capital allocated toward future growth, and should be treated as such. Two, NXGN mention this directly in their filings, that, in order to remain competitive, it must "engage in continuing investments in our research and development to update, enhance and improve our systems".
Reconciling for this in NXGN's OpEx produced adjusted post-tax earnings of $95mm in FY'22, and adjusted net earnings of $9.3mm, compared to $19mm and $1.6mm respectively.
(2). Historical data, future expectations
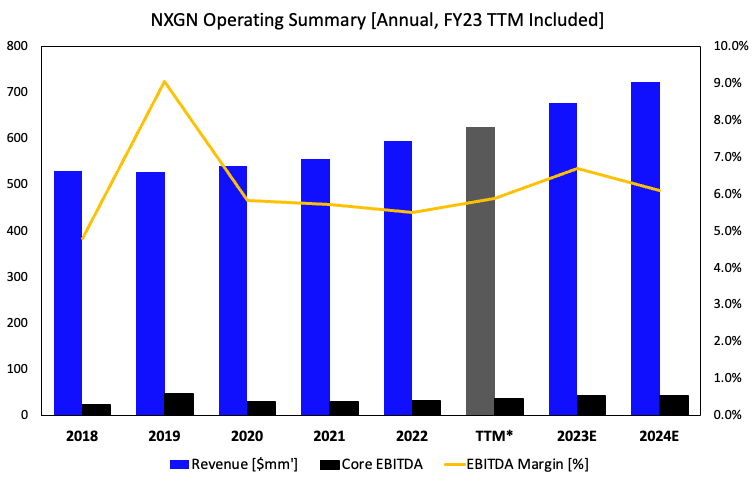
Long-term analysis is important here. Figure 4 shows NXGN's long-term operating performance, pre-tax. The TTM numbers are also presented in the grey bar, along with forecasts for FY'23-24E. Referring to the data presented in Figure 4, the following points are relevant for discussion:
- NXGN's top-line growth is accelerating at an increasing rate of change. It has ratcheted up from 2.1% in 2020 to 7.1% last year, and 4.8% at the midpoint in FY'23.
- Core EBITDA margins have stayed flat on these higher prints at the 5% range, are at ~6% in the TTM.
- The firm could do 8% in revenue upside this year to produce $645mm in my estimation. This is in-line with management's range of $642-$650mm.
- On this, I would call for $44-$45mm in core EBITDA ($127mm adjusted) across FY'23-24 at the 6-7% margin range. On a reconciled basis, this lands in front of management's $115mm forecast in 2023 adj. EBITDA.
The steepening revenue ramp is a good sign. In my opinion, it indicates the defensive nature of NXGN's business model even in the face of macro-volatility. This way, it will continue generating sales despite broader economic pressures.
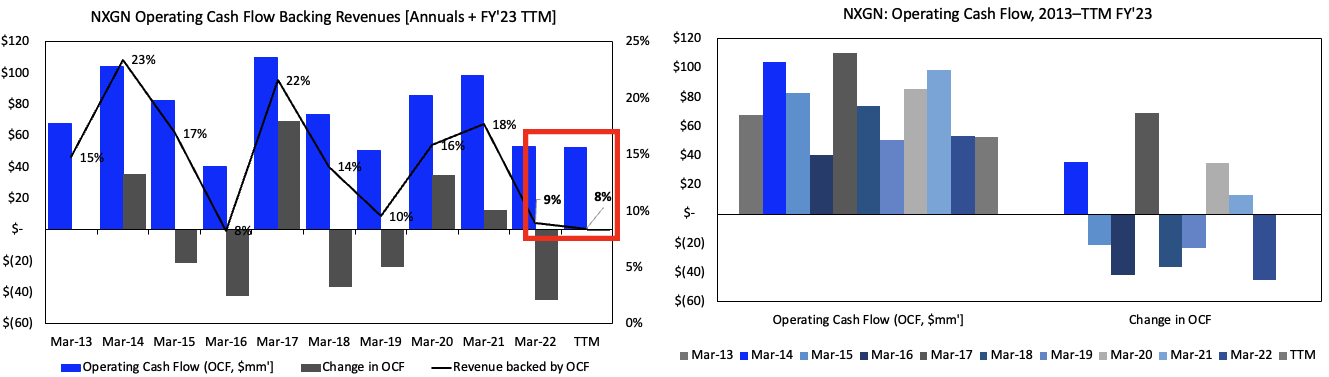
Despite the income profile, there's been less positive momentum looking over to operating cash flow. Figure 5 illustrates the company's annual operating cash flow, along with the yearly changes. It then demonstrates the percentage of revenue backed by OCF.
As observed on the right of Figure 5, OCF growth has been cyclical, but bottom-heavy. Meanwhile, the degree of cash flow backing revenues has dwindled off highs of 22% in 2017 to 8% in the TTM. This could be one reason investors have crimped their ratings on NXGN over the years, as free cash flow growth has mirrored the contraction in OCF, and the firm hasn't increased earnings to owners at a reasonable pace in years.
Fig. 4
Fig. 5
(3). Capital allocation to future growth in corporate valuation
NXGN is reasonably attractive as a defensive name in my investment playbook, given it is a good steward of capital. I'd highlight these points on the firm's capital spending plans moving forward:
- It will focus on M&A as a strategic path to growth looking forward. To that, the firm purchased TSI healthcare last November on a $68mm valuation. It expects $10-$12mm in FY'23 revenue from the transaction, mainly in subscription turnover. It also expects earnings to be accretive within a year.
- The acquisition is a part of a broader strategy of automation at NXGN. Management expects to drive capital to its cyber profile and more robotic/automated production. These plans could well have a good NPV and continuing value for the coming years.
- It raised $275mm via a convertible notes offering and repurchased ~$40mm of stock as part of this. This pays a 3.75% coupon with a $25.68 conversion price, and can be called in 2025 or after. This convertible provides a cheap source of financing for NXGN and plenty of headroom to the $25 mark before conversion.
- Even if investors do convert at $25, consider that, 1) this will wipe the debt from the balance sheet and increase the available equity, and 2) will be a result of a 51% rally in the stock price anyways.
Further, economic profits ("EPs") matter more than accounting profits to intelligent investors. Accounting profits measure earnings, EPs look at a firm's value through its investments in future growth. If you are to allocate precious, scarce capital to any equity investment, you'd want your company to be generating a higher return on the funds it allocates than what you can get elsewhere. Collectively, this is the hurdle rate (risk-free rate + forward S&P 500 earnings yield). As such, a firm creates value for its shareholders when the value of $1 is worth more in the company's hands than in the investors'. This economic profit would suggest the firm is a better use of capital for the investor than simply riding the benchmark (hurdle rate). You specifically measure the economic profitability of a company by taking the spread of the return it generates on its own investments compared to the hurdle rate.
Despite lumpy earnings growth in years, NXGN has remained buoyant given its economic profit [Figure 6]. Here I used a hurdle rate of 12-13% to reflect the long-term averages of the market. The hurdle rate is shown via the red line. The data shows NXGN has averaged 10-16% in EP since 2018. It appears the market will certainly tolerate cyclical earnings growth as long as the underlying economic trends of the business remain intact. That is, even with lumpy growth, the value of $1 is still valuable in NXGN's hands.
Fig. 6
Data: Author, NXGN 10-K's
To me this demonstrates the favourable economic characteristics of NXGN's business. Holding 23-26% return on existing investments enables the firm to hold a steady valuation and the market seems to agree. Breaking this down further, it suggests the firm's high returns on capital arrive from advantages on the production side, versus the consumer/profitability side [Figure 7]. As seen below, capital intensity has narrowed in for NXGN since 2018 with invested capital turnover at 1.6x last year. This could revert to the 1.2-1.3x long-term range going forward in my estimation. Meanwhile, annual NOPAT prints have crimped in this time, as the firm has absorbed a 3-5 percentage points of operating margin. It is therefore pleasing to see NXGN capitalize on its economic advantages in automating production to further improve capital efficiency. I believe this could have a follow-through effect on profitability over time, as well.
Fig. 7
Data: Author, NXGN 10-K's
Valuation & Conclusion
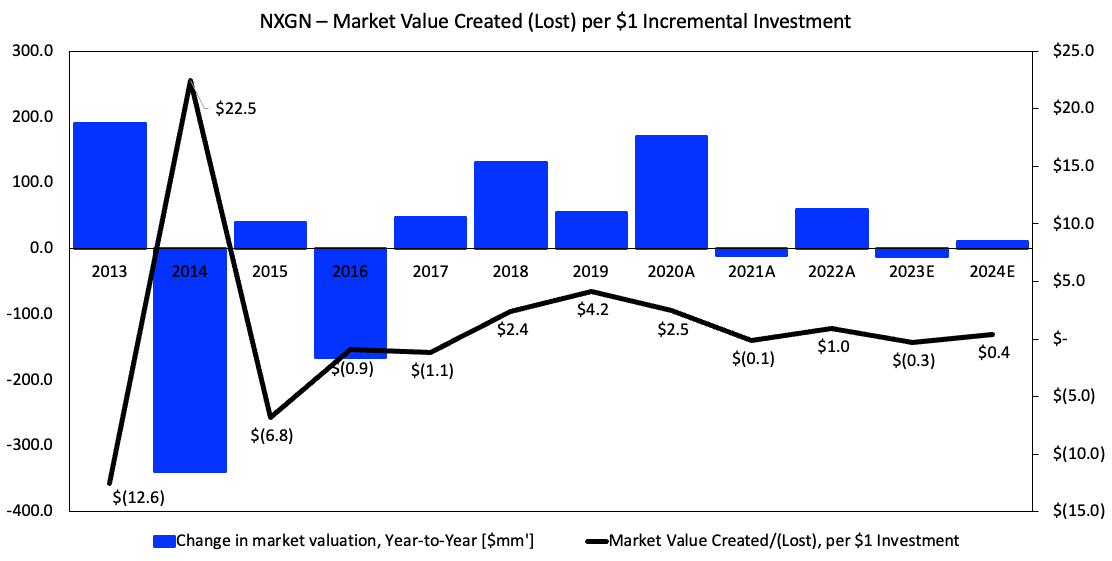
There are several points for discussion in the valuation debate. One, is the additional market value NXGN is creating (or lack thereof) from the capital it is recycling back into the business. Findings show that since 2013, not much. You can see below the change in NXGN's market valuation each year since 2013-2022, including estimates for the next 2-years. Several observations are immediately apparent:
- Investors haven't routinely rewarded NXGN with substantially higher market valuations each year.
- The question turns to the incremental changes over time, to observe how the market values NXGN. Despite a thinner capital base, the company still makes necessary investments into new capital. If this new capital was immediately productive, it would be reflected well in the company's stock price.
- Hence, despite the strong returns on existing capital base each year, the incremental investments haven't been as rewarding.
- For example, since 2018 its invested capital base contracted by $30mm, and it generated $4.3mm additional NOPAT growth, or ~1% CAGR. On these figures, the intrinsic valuation increased just 1% over 5-years.
- To illustrate additional investments NXGN made since 2018 corresponded with a cumulative $9.9mm in additional market valuation to date. That is, $266mm net cumulative investment over 5-years translates to $9.9mm additional market valuation. I believe the market is a fairly good judge of intrinsic value over time.
- Extrapolating this data going forward, I'd estimate the market to value NXGN at $1.2-$1.3Bn in the coming 2-years. Key assumptions to this are the firm reinvesting 37% of post-tax earnings at negative 2%-positive 4% incremental returns.
Fig. 8
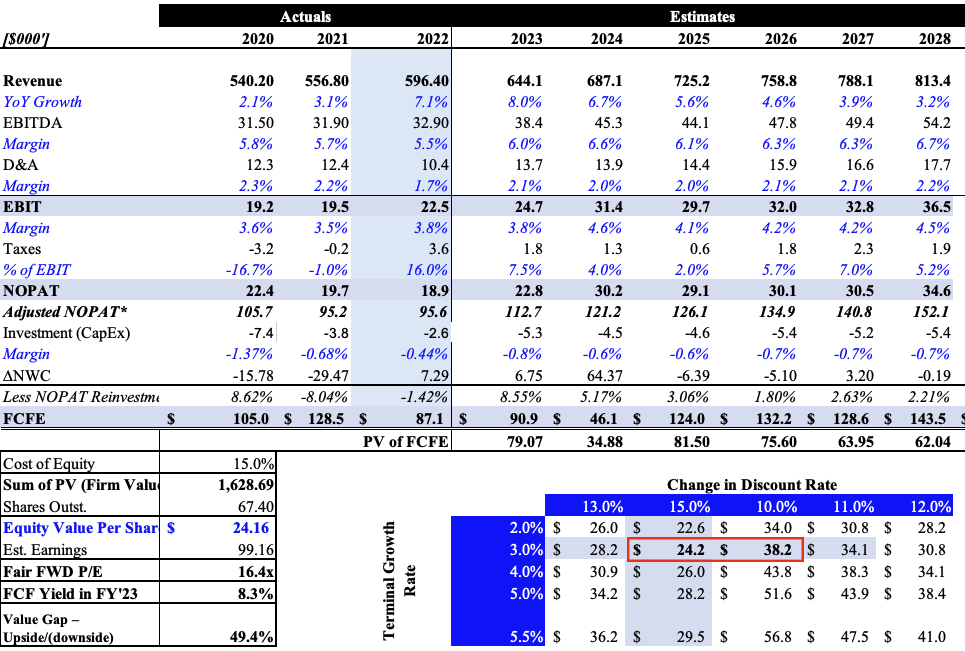
I get to similar numbers projecting the cash NXGN could throw off to shareholders into 2028. Even discounting this at an appropriate 15%, the firm could be worth $1.6Bn, giving some upside scope on the $1.2-$1.3Bn outlined earlier. This would equate to $24, similar to the $22 range I argued for in the last publication. On these numbers, you'd pay 16x my FY'23 earnings estimates in my opinion. At the consensus number, this translates to a 24x forward P/E and tells me the market has undervalued NXGN at current multiples. In that vein, I reiterate NXGN as a buy.
Fig. 9
In summation, NXGN still presents attractive business economics. The hurdle it faces stems from the ability to create additional value above its steady state. For example it routinely delivers c.20% returns on existing capital, well above the hurdle rate. But the incremental investments it is making over time aren't in the same steed, leading to unstable returns. The market has recognized this in my opinion and continues to rate NXGN at a firm $16-$18 per share. I believe there is scope for a further rating to $24 over time, and still advocate NXGN as a defensive holding to balance equity risk. Rate buy.
For further details see:
NextGen: A Liquid Diversifier To Equity Risk, Continued Buy At 16x P/E