VTI - No Signs Of A Major Top Yet Staying Long
2023-09-19 13:58:38 ET
Summary
- The market does not currently show signs of a major top. I remain bullish until certain criteria are met.
- When used together, the VIX, McClellan Summation Index and the 40-week moving average seem to provide a strong signal for when to consider getting cautious.
- In the sections that follow, I will take you through these indicators in detail and explain my current investment stance.
Editor's note: Seeking Alpha is proud to welcome Mean Reversion Investor as a new contributor. It's easy to become a Seeking Alpha contributor and earn money for your best investment ideas. Active contributors also get free access to SA Premium. Click here to find out more »
The market does not yet display any of the characteristics that would have me concerned about a major top and, as such, I am long this market and will remain so until certain criteria are met. Below, I will take you through these indicators, how they work, and what I look for in regards to how they are behaving to determine if I am going to be long the market or raise cash.
Indicator #1: What kind of a market are we in?
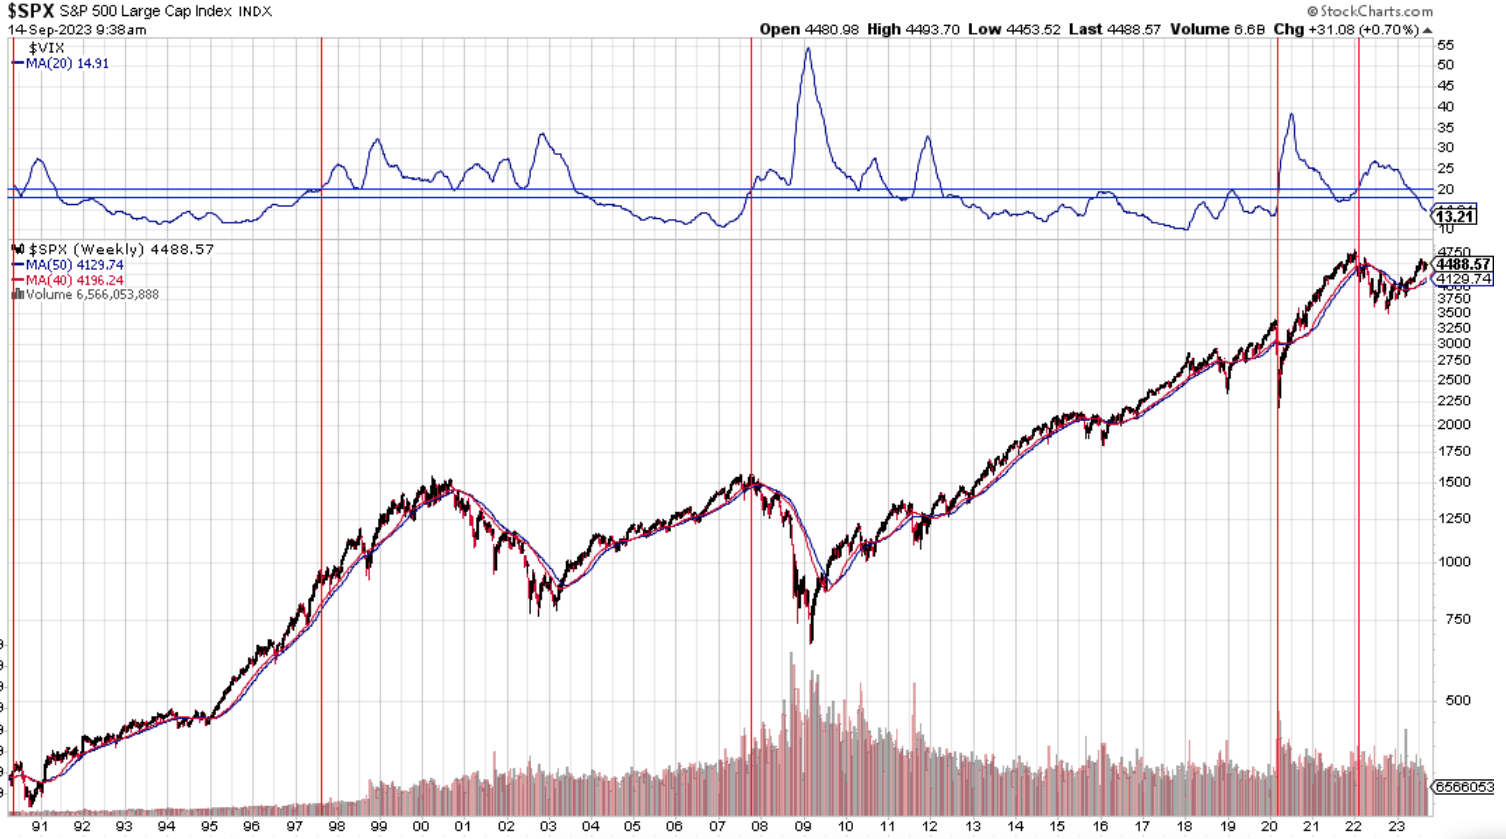
Often we hear "pundits" on TV telling us the VIX (volatility index) is low which suggests the market is complacent and you should brace for a correction or bear market. The problem with that is if one looks at history they will actually find the opposite to be true. The VIX tends to get and stay elevated prior to market tops and tends to remain low in trending bull markets. And it makes sense, bull markets, especially trending ones, are not generally marked by high volatility. They are marked by low volatility that rips the face off of investors that try over and over to short these markets, go to cash or get defensive. (for example, 1995 was overbought almost the entire year with low volatility). If one believes that the markets are "generally" efficient then we should understand that the VIX is telling us what it expects future volatility to be and it will be relatively accurate. Since the VIX on a daily basis can be quite volatile which makes it difficult to make anything of, I smooth out the noise and use the 20 week simple moving average of the VIX to help me identify what kind of environment we are in.
What do we find (see chart below) ? Well, the 20 week VIX (VXO prior to 1993) got over 20 in mid-1986 and stayed there through the 1987 crash. It then crossed over 20 in mid-1990, dipped briefly down to around 18 and then over 20 again throughout the 1990 market sell-off. It rose above 20 in mid-1997 and stayed above 20 through the .com crash of 2000-2002, and then rose again over 20 in late 2007 and stayed there throughout the Great Financial Crisis. It even remained north of 18 throughout the 2010 Greek Debt Crisis, 2011 EU-IMF bailouts and US debt downgrade. So, does the elevated VIX mean "GET OUT OF STOCKS"?! Well, no, I don't think that's what it's saying. I do think it is saying that one can expect volatility but in what direction one can't say. Let's not forget 1997-1999 were bull market years but had lots of volatility. Since tops are a process, I am not surprised to see that the VIX gets elevated while the market goes through the topping process despite most not realizing a top is in fact forming.
When was volatility persistently low? From 1991 to mid-1997 timeframe and from 2004 to mid-2007. Was that the time to ring alarm bells or ride the bull market?
Indicator #2: How's the health of the market?
Again, we often hear "pundits" telling us that "breadth is bad. Not enough stocks are participating" so be cautious, raise cash or get out of the market. Haven't we been hearing this for some time now regarding the "Magnificent Seven"? Side note for those investing in the late 90's…we heard the same thing as breadth from mid-1997 on was terrible. And, yes, the market EVENTUALLY came undone but it took years for that to occur and I'm sure investors would have liked to participate in the gains of 1997 - 1999. So, how do I look at breadth? I use the McClellan Summation Index, ratio adjusted. It looks at the net advances of the underlying index being used (see here to learn more about the McClellan Summation Index). But since issues traded publicly on an exchange can decline over time, it is important to use the ratio-adjusted version of the summation index. When breadth is under 0, you have a more bearish bias and above 0 a more bullish bias (because of the strength in advances vs. declining issues and vice versa). But I would never use one indicator in a vacuum. It would lead to lots of whipsaws and results few would be happy with. So, let's then move on to Indicator Three.
Indicator #3: What about moving averages?
I use the 40-week moving average (similar to the 200-day SMA). A moving average is just an arbitrary number based on backward looking price action so it's not my favorite thing to look at. That said, in combination with other factors like the ones discussed above, rather than by itself, I believe one can avoid whipsaws or at least reduce the likelihood of them occurring.
Indicator #4: Is the market oversold and on a buy signal?
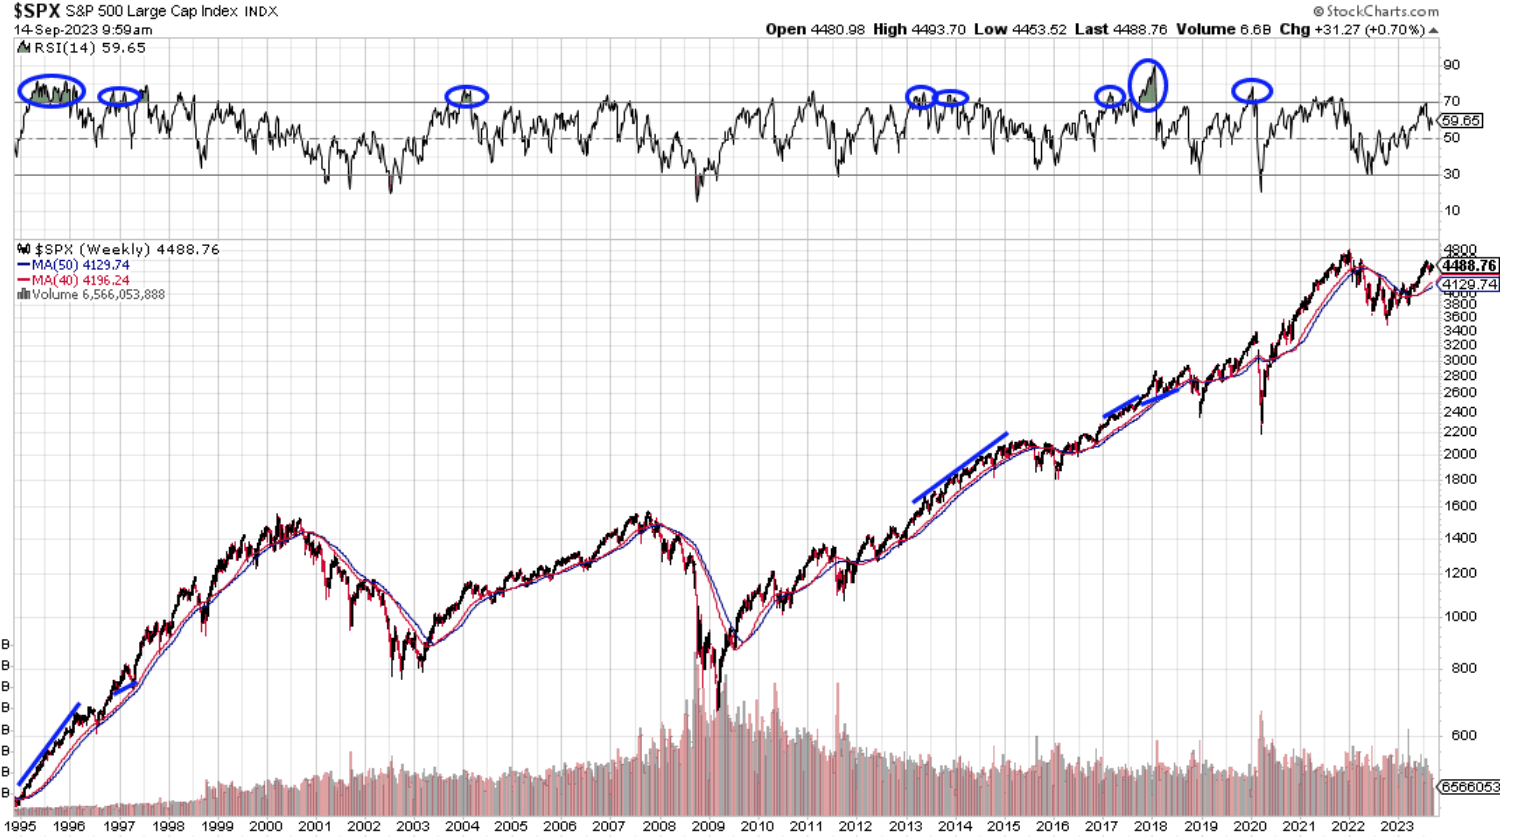
The issue with using oscillators like RSI and others, is like the VIX, I've noticed most investors use them incorrectly. I read far too often how the market is overbought and one should raise cash because RSI is over 70 and overbought. Well, remember 1995 or other bull markets? RSI 14 stayed over 70 for a very long time and the market continued to rip higher. Markets can get and stay overbought for very long periods of time and grind bears to pieces that misunderstand and misuse RSI and other relative strength indicators. In a bear market, the opposite is often true. Markets often do not stay over bought for very long and as a result bounces can be sold relatively quickly. Conclusion, while investors regularly use indicators the same way across all market environments, investors should instead recognize that they should be used differently in different market environments. You can see in the chart below that while "sometimes" an overbought RSI can happen before bigger selloffs, more often than not RSI remains overbought in bull markets.
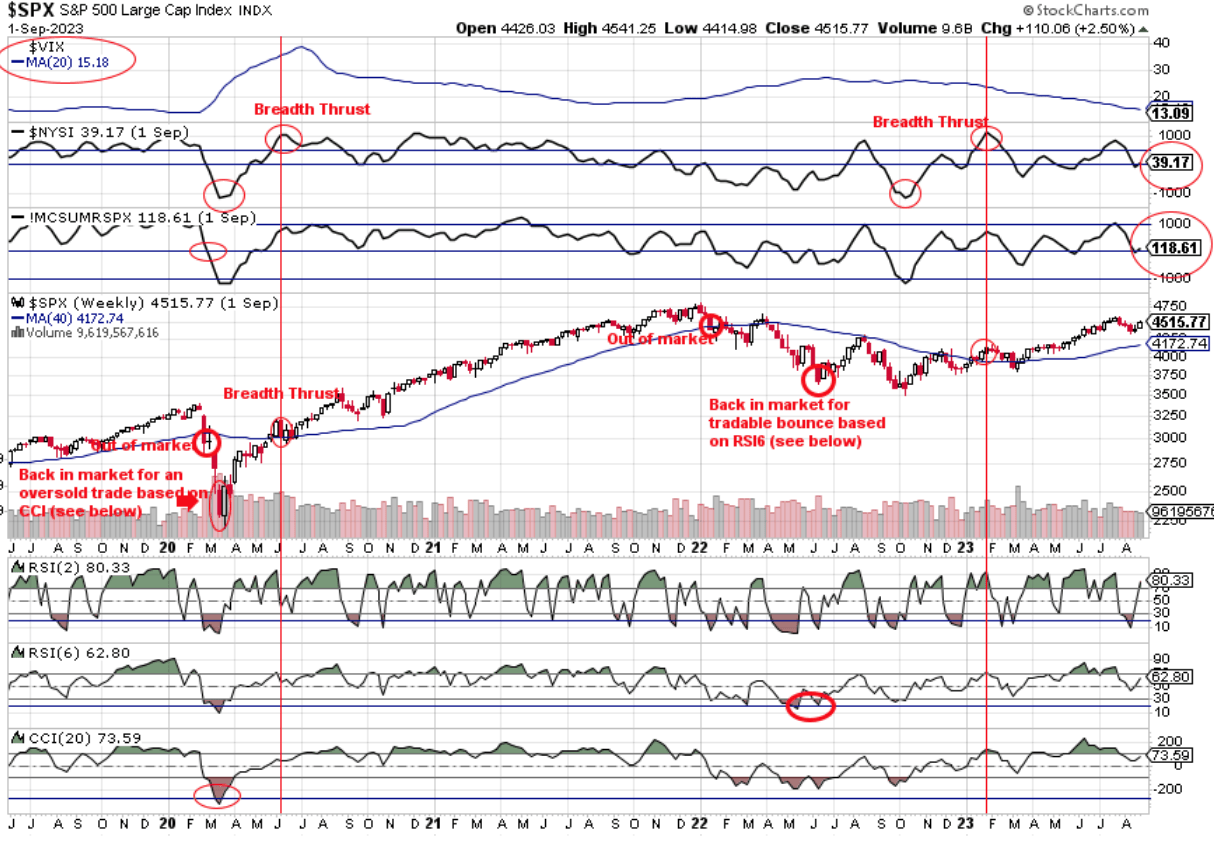
This is the case when observing if the market is in a more or less volatile environment by looking at the 20 week VIX. If it is below 20 (ideally 18) then I will look at indicators and adjust them to be very sensitive (for example, RS2 vs RSI6 for a more volatile market). Why? Because when one is in a less volatile environment pull backs tend to be more shallow or when they are sharp they tend to also be shorter lived so I am more forgiving and will lean toward the market being in a correction within a bull market and either hold my position or buy more of the market with more ease rather than having very strict criteria. If we are in a more volatile environment then the market can easily fall further and be more persistent and therefore the requirement to be oversold is more strict (for instance, 1998 and 2000-2002). I don't want to buy too early in this environment. For less volatile markets environments I will use weekly RSI2, Daily RSI14, ULT Oscillator, and Daily CCI20. For more volatile markets I look at RSI6 (more strict than RSI2), and weekly and daily CCI 20.
See the chart below. Circled are times when weekly RSI6 went under 20 or Weekly CCI went under -275. These are very strict oversold reading and I use them to increase the probability that at least a short term bottom is in or near. In March of 2020, CCI 20 met my oversold criteria and in June of 2022 because RSI6 met my criteria. I will share more specifics in future articles regarding the criteria I use in order for me to be willing to add back to the market after I've moved to cash. It is not urgent to address in this article since we are not even yet on a sell/raise cash/get defensive signal.
When will I take action
- If the summation index breaks below 0 (breadth is weak) AND
- The market breaks below the 40-week SMA on a weekly close (strength of trend is weakening) AND
- The market is not oversold then
I will look to get defensive. The chart below shows this happened in February of 2020 and January of 2022. It also happened in 2000 and 2007, with those two being the more important time to have gotten defensive.
When to consider adding back to market?
One a short-term basis, I look for one of two things to happen: 1) the market gets oversold using the indicators mentioned above RSI, CCI, etc.
On an intermediate to longer term basis, the market recovers the 40-week moving average on a weekly close AND the summation index recovers to over 500 on a weekly close, showing breadth strength. This would indicate health based on both breadth and trend.
A bullish occurrence to note
When a bullish breadth thrust happens I am all in and then some. For me, that is when the summation index goes from -1000 or lower to 1000 or higher. This is a market that goes from very oversold to terrific breadth. I do not believe the market has ever been down 12 months later when that has occurred and in fact I believe 12-month returns post-thrust tend to be very strong.
FYI: We had a breadth thrust complete in January 2023 and June of 2020, as you can see in the chart below. This was a reason for me to get very bullish.
Conclusion
Today, the market does not display any of the characteristics that would have me concerned being long the market. The 20-week VIX is currently at 14.91 (comfortably low), we are trading above the 40-week moving average, and breadth is better than the talking heads will have you believe with both the SP500 and NYSE summation indexes above 0. Even if they weren't, given the first two indicators mentioned, I wouldn't yet be concerned. As such, I am long the broad market via SCHB, VTI, SCHX and if I owned the SP500 via SPY, IVV or VOO, I would remain long those ETFs as well.
I hope my thoughts and insights were worth the read. While there is no "Magic Formula", I do believe there are ways to increase the probability of being correct as to market direction and in turn increase the chances of reducing large drawdowns of capital, even if temporary and increase the chances of staying with a bull market rather than making the mistake of getting defensive too early.
I will provide updates even when nothing is changing to reinforce that nothing is changing despite TV pundits always wanting us to think something important is always happening and, of course, when I see something happening that might lead me to make a move in my more active accounts.
For further details see:
No Signs Of A Major Top Yet, Staying Long