JJE - Non-OPEC's December 2022 Oil Production Drops
2023-04-12 02:45:00 ET
Summary
- December Non-OPEC oil production decreased by 317 kb/d to 50,784 kb/d. The largest decrease came from the US, 276 kb/d.
- Output is expected to reach 52,569 kb/d in December 2024, which is 167 kb/d higher than the December 2019 peak of 52,402 kb/d.
- From January 2023 to December 2024, oil production in Non-OPEC countries is expected to increase by 1,389 kb/d.
A guest post by Ovi
Below are a number of Crude plus Condensate (C + C) production charts, usually shortened to “oil”, for Non-OPEC countries. The charts are created from data provided by the EIA’s International Energy Statistics and are updated to December 2022.
This is the latest and most detailed world oil production information available. Information from other sources such as OPEC, the STEO and country specific sites such as Russia, Brazil, Norway and China is used to provide a short-term outlook for future output and direction for a few of these countries and the world. The US report has an expanded view beyond production by adding rig and frac spread charts.
December Non-OPEC oil production decreased by 317 kb/d to 50,784 kb/d. The largest decrease came from the US, 276 kb/d.
Using data from the April 2023 STEO, a projection for Non-OPEC oil output was made for the period January 2023 to December 2024. (Red graph). Output is expected to reach 52,569 kb/d in December 2024, which is 167 kb/d higher than the December 2019 peak of 52,402 kb/d.
From January 2023 to December 2024, oil production in Non-OPEC countries is expected to increase by 1,389 kb/d . The major contributors are expected to be US, Canada, Norway and Guyana. Russia is expected to provide the largest decrease.
From January 2023 to December 2024, production in Non-OPEC countries w/o the US is expected to increase by 916 kb/d. This implies that 473 kb/d of the output increase seen from January 2023 to December 2024 in the previous chart is expected to come from the US.
Listed above are the World’s 10 largest Non-OPEC producers. The criteria for inclusion in the table is that all of the countries produced more than 1,000 kb/d.
December saw a reversal of the previous months’ increases. The December production decrease for these ten Non-OPEC countries was 253 kb/d while as a whole the Non-OPEC countries saw a production drop of 317 kb/d. The US had the largest production drop in December, followed by China and Russia. On a YoY basis, Non-OPEC production increased by 1,310 kb/d.
In December 2022, these 10 countries produced 83.1% of the Non-OPEC oil.
OPEC C + C rose by 167 kb/d in December while increasing YoY by 902 kb/d. World MoM production decreased by 150 kb/d while YoY output increased by 2,212 kb/d.
Non-OPEC Oil Production Charts
The EIA reported Brazil’s December production dropped by 2 kb/d to 3,093 kb/d.
Brazil’s National Petroleum Association (BNPA) reported that January’s output increased by 188 kb/d to 3,274 kb/d, another new record high, before dropping 12 kb/d in February to 3,262 kb/d.
Much of Brazil’s 2023 production growth will be from the highly productive pre-salt fields partially offset by maintenance interruptions.
According to the EIA, Canada’s December output increased by 72 kb/d to a new record high 4,783 kb/d. Using information from the Canada Energy Regulator, January production is expected to drop by 135 kb/d to 4,648 kb/d. The drop was due to extreme cold weather and plant maintenance at an oil sands facility
Rail shipments to the US in December decreased by 6 kb/d to 120 kb/d.
The EIA reported China’s oil output decreased by 64 kb/d to 4,016 kb/d in December . The China National Bureau of Statistics reported that the average production during January and February, red markers, was 4,228 kb/d, a significant increase over December.
Kazakhstan’s output increased by 8 kb/d in December to 1,948 kb/d.
Mexico’s production as reported by the EIA for December was 1,751 kb/d an increase of 20 kb/d over November.
The January and February estimates, red markers, were obtained by using the Pemex increments over December production and adding those to the EIA’s December output because Pemex reports higher production than the EIA. January and February production was essentially the same as December.
According to OPEC, “the total crude production decline in Pemex’s mature fields is projected to outweigh production ramp-ups, mainly from Mexico’s foreign-operated fields. In its latest investor presentation, Pemex highlighted the importance of its priority fields (mainly condensate and light crude) to achieve its goal of production. However, persistent declines in Pemex’s heavy mature oil fields were set to mostly offset its other grades.”
The EIA reported that Norway’s December production increased by 20 kb/d to 1,797 kb/d.
The Norway Petroleum Directorate ((NPD)) reported that production in January decreased by 18 kb/d to 1,779 kb/d and then increased 21 kb/d to 1,800 kb/d in February. (Red markers).
In the past, the NPD has stated that once the Johan Sverdrup 2 oil field came on stream, Norwegian oil production will hit a new post pandemic high. According to Equinor , “The entire Johan Sverdrup field is now on stream.” as of December 15, 2022. It will be interesting to see if the December 2021 post pandemic production high of 1,861 kb/d will be exceeded.
According to the NPD : “Oil production in January was 3.0 percent lower than the NPD’s forecast. For February they wrote, “Oil production in February is 2.8 percent lower than the NPD’s forecast and 2.5 percent lower than the forecast so far this year.”
Oman’s production has risen very consistently since the low of May 2020. However Oman’s November and December production decreased by 38 kb/d to 1,056 kb/d.
December’s output was unchanged at 1,322 kb/d. I assume the EIA is not getting monthly updated info. I also note that the OPEC MOMR shows no change in production.
The EIA reported that Russian output decreased by 25 kb/d in December to 10,352 kb/d.
December Russia Ministry production is shown unchanged at 10,900 kb/d based on this statement : Russia will keep oil production in December at the November level amid the EU’s embargo and the price cap, Deputy Prime Minister Alexander Novak told reporters.
Argus Media is reporting that Russian crude production in March 2023 was 9,700 kb/d. If the typical Russian monthly condensate output of 900 kb/d is added to the crude production, Russian C + C in March would be close to 10,600 kb/d, blue marker. This production level is also being reported by TASS . Note the last line “We had 10.2 mln barrels per day in February,” Novak said.”
A later article by Bloomberg claimed that Russia cut its oil output by 700,000 kb/d in March. However the article further states that: “Russia watchers have started following the nation’s seaborne oil exports and domestic oil-processing rates as gauges for crude production estimates. However, both indicators showed no visible declines last month.”
The EIA reported UK’s production decreased by 80 kb/d in December to 696 kb/d.
According to this source , January’s production dropped to 689 kb/d.
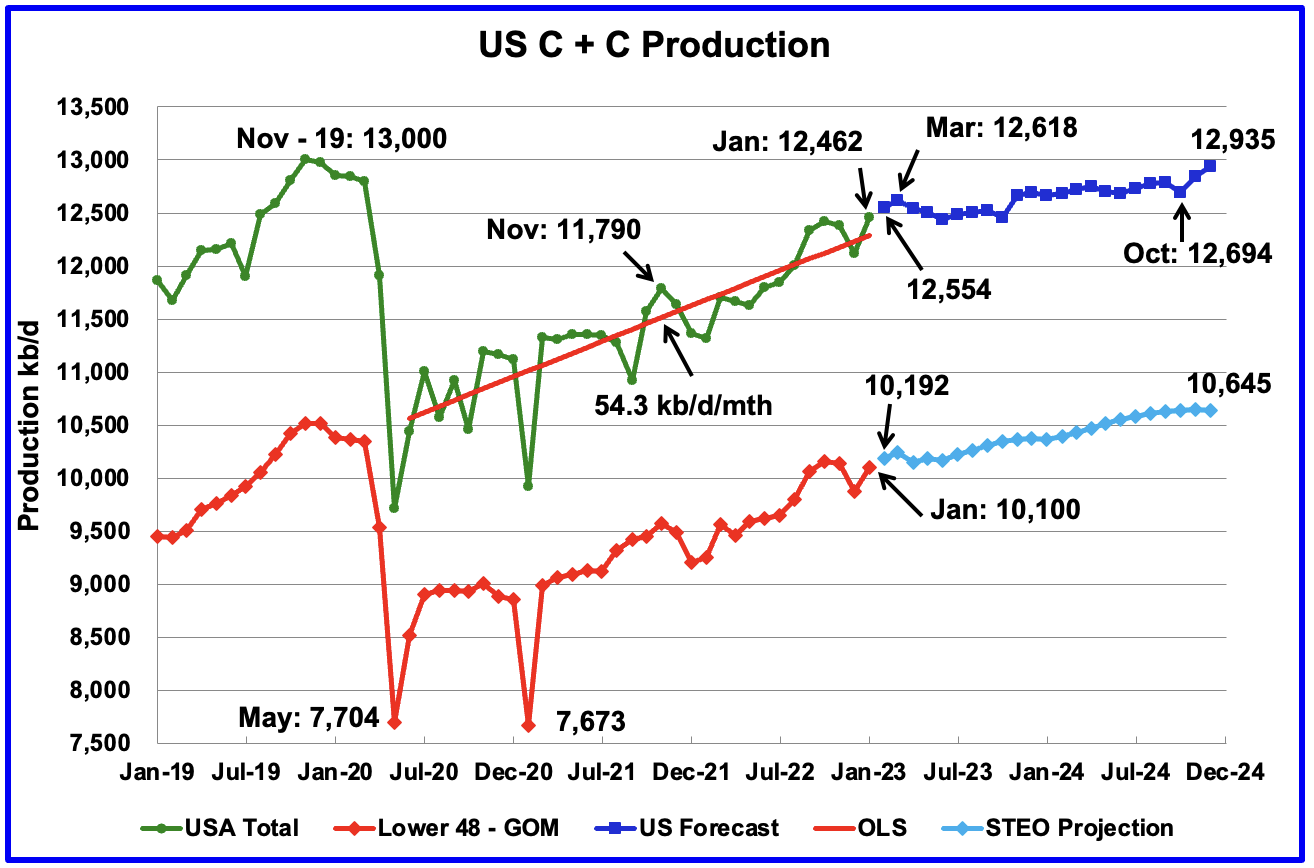
U.S. oil production in January increased by 437 kb/d to 12,462 kb/d, a post pandemic high. For January, the GOM contributed 125 kb/d to this high.
The dark blue graph, taken from the April 2023 STEO, is the forecast for U.S. oil production from February 2023 to December 2024. Output for December 2024 is expected to be 12,935 kb/d, 111 kb/d higher than posted in last week’s US update. From March 2023 to October 2024, production is forecast to increase by 76 kb/d . February’s production is expected to increase by 92 kb/d to 12,554 kb/d.
From January 2023 to December 2024, production in the lower onshore 48 states is expected to increase by 453 kb/d. Light blue graph.
Since the beginning of April 2021 through to the week ending July 29, 2022, the US added horizontal oil rigs at a rate of close to 3.76 rigs/wk, orange OLS line, and peaked at 551 rigs in the week ending July 29. However since then the number of operational rigs has wandered primarily sideways.
A high of 572 rigs was reached in the week ending November 25, 2022. In the week ending April 6, 2023, the number of rigs decreased by 3 to 542 and are down 30 from the recent high of 572.
In the week ending April 6, Permian rigs were unchanged at 337 and Texas rigs increased by 2 to 312. Note that the trend for rigs in the Permian is showing a slow increase from September 2022 and is currently 6 above the high of 331 on July 1, 2022.
For frac spreads, the general trend since the week of January 6, 2023 can best be described as recovering from the slowdown associated with the 2022 Thanksgiving and Christmas holidays.
This trend is a repeat of what happened last year. However there is one difference. Last year the recovery took place over 9 weeks while this year it has taken 13 weeks so far. How far above 300 will the Frac count get in 2023 .
For the week ending April 6, the Frac count decreased by 8 to 287.
Note that these 287 frac spreads include both gas and oil spreads.
WTI settled at $81.53/b on April 11, 2023, up $1.79/b and 10¢ lower than the recent high of $81.62/b on January 23, 2023. There is a lot of resistance at $81.50/b, six mini tops.
These six countries complete the list of Non-OPEC countries with annual production between 500 kb/d and 1,000 kb/d. Note that the UK has been added to this list since its production has been below 1,000 kb/d since 2020.
Their combined December production was 3,882 kb/d, down 84 kb/d from November. The UK contributed 80 kb/d of the 84 kb/d decrease.
The overall output from the above six countries has been in a slow steady decline since 2014 and appears to have accelerated after 2019.
World Oil Production Ranked by Country
Above are listed the World’s 11 largest oil producers. In December 2022, these 11 countries produced 74.6% of the world’s oil. On an MoM basis, production fell by 248 kb/d while on a YoY basis, production increased by 2,136 kb/d.
World production decreased by 150 kb/d in December. The largest decrease came from the US, 276 kb/d while Canada and Iran added a combined increase of 149 kb/d.
World Oil Production Projection
World oil production in December decreased by 150 kb/d to 81,775 kb/d according to the EIA (Green graph). January is expected to drop by an additional 283 kb/d to 81,492 kb/d.
This chart also projects World C + C production out to December 2024. It uses the April 2023 STEO report along with the International Energy Statistics to make the projection. (Red markers).
It projects that World crude production in December 2024 will be 83,540 kb/d. Note that the December 2024 production is 1,046 kb/d lower that the November 2018 high of 84,586 kb/d.
The production increase from January 2023 to December 2024 is 2,048 kb/d.
Note that the production spike between December 2023 and January 2024 is OPEC’s introduction of a production increase of 1,000 kb/d to reverse previous decreases.
I do not think that the latest March cut of 1,000 kb/d has been added to the EIA forecast.
World without the US oil output increased by 115 kb/d to 69,660 kb/d in December.
World oil production w/o the U.S. from December 2022 to December 2024 increases by a total of 945 kb/d. Note the addition of 1,000 kb/d by OPEC in January 2024.
Editor's Note: The summary bullets for this article were chosen by Seeking Alpha editors.
For further details see:
Non-OPEC's December 2022 Oil Production Drops