NESRF - Northern Star Resources: A Strong Finish To FY2023
2023-07-20 03:27:02 ET
Summary
- Northern Star had a solid FY2023 overall even if it slightly missed its guidance midpoint, with strong margins helped by gold price strength.
- Looking ahead to FY2024, it will be a capital-intensive year, but Northern Star is well positioned for its growth with a strong balance sheet and Pogo performing much better.
- That said, while Northern Star offers growth at improved margins, especially with its recently approved KCGM Expansion, I don't see enough margin of safety at current levels.
The Q2 Earnings Season for the Gold Miners Index ( GDX ) begins later this week at the same time as the Australian gold producers are reporting their fiscal Q4 2023 earnings (calendar year Q2-2023). One of the first companies to report its results was senior producer Northern Star Resources ( OTCPK:NESRF ), which delivered at the low end of its FY2023 guidance with ~1.56 million ounces sold, a marginal increase vs. the year-ago period. And while the miss on the guidance midpoint might have disappointed some investors, this was a solid performance overall given the labor challenges in Western Australia and minor downtime events at its newly expanded Thunderbox Plant. In this update, we'll look at the Q4 and FY2023 results and see whether the stock has dropped into a low-risk buy zone:
All figures are in United States Dollars unless otherwise noted.
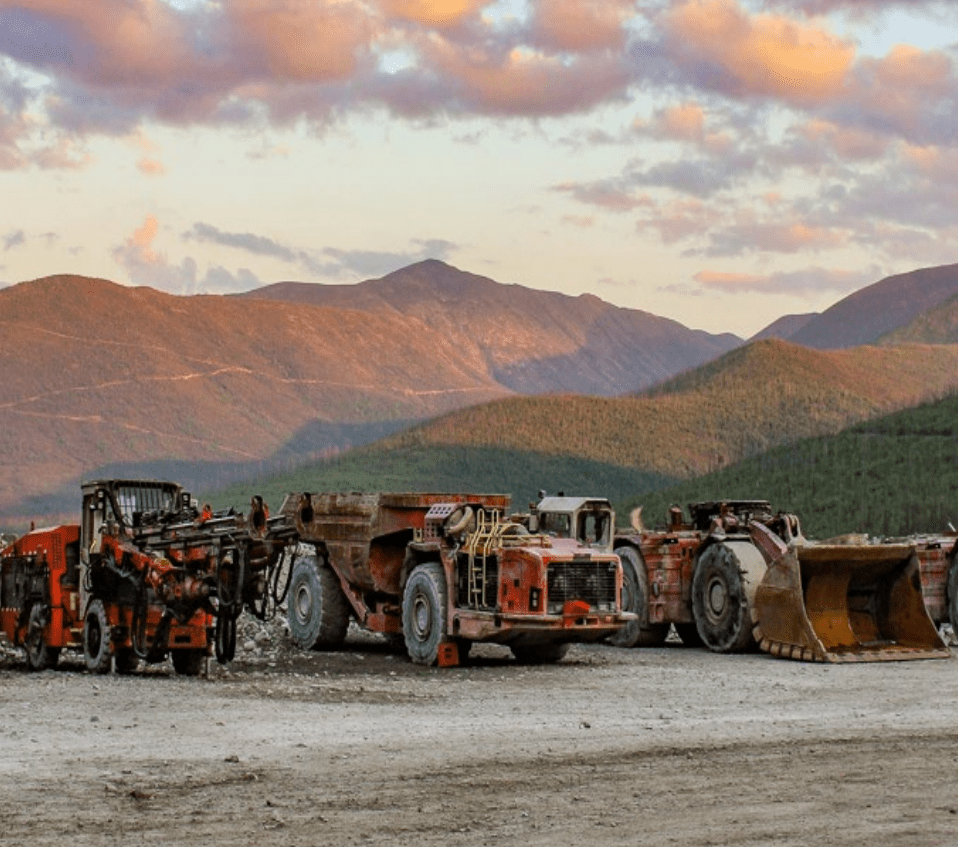
Pogo Mine Operations (Company Website)
Q4 & Full Year Production
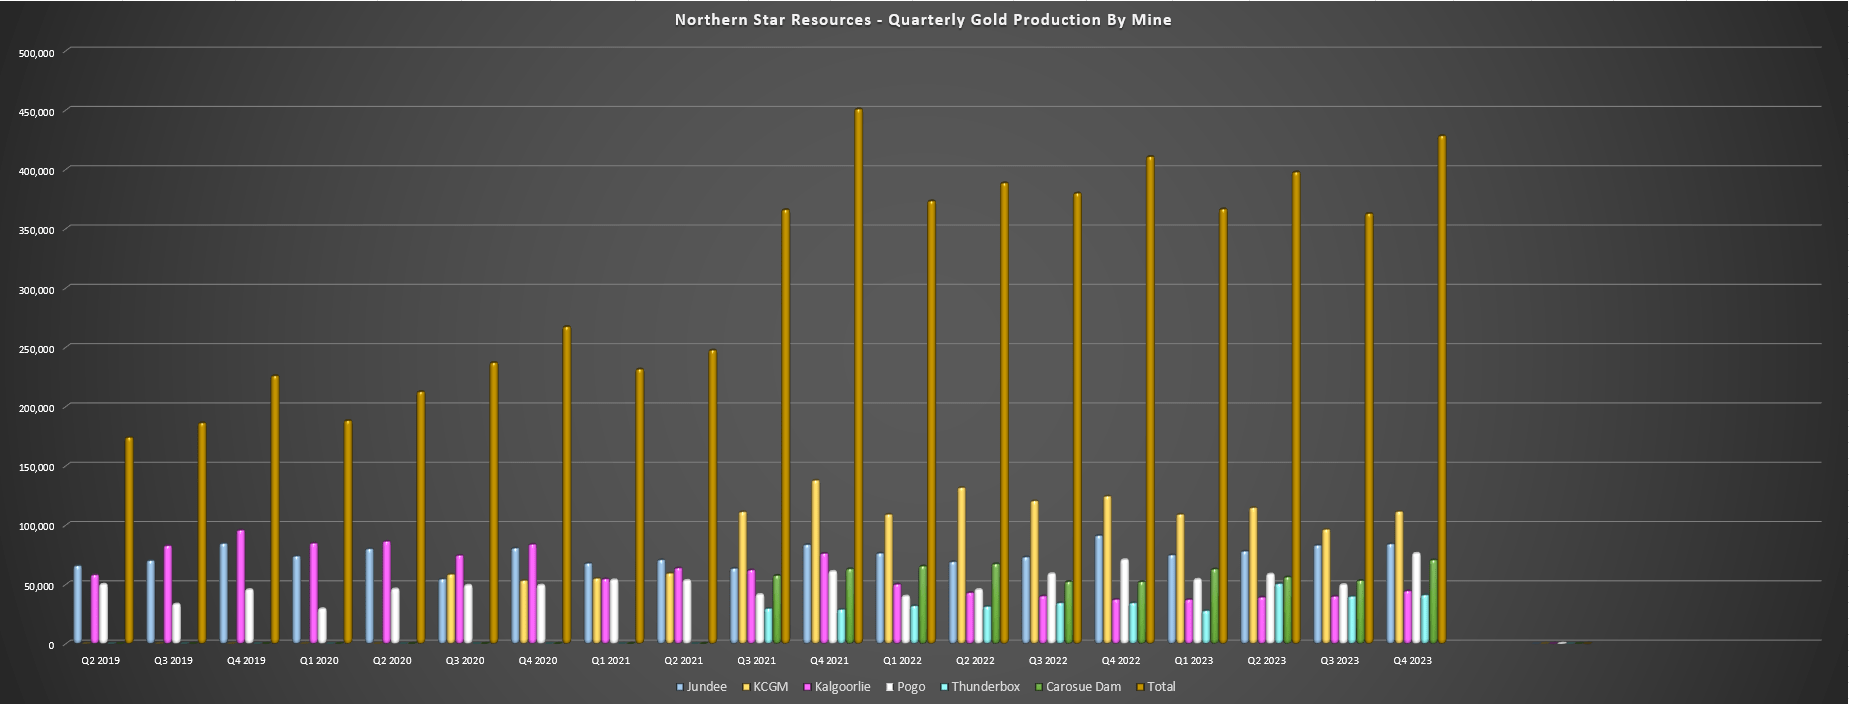
Northern Star Resources ("Northern Star") released its fiscal Q4 and FY2023 results this week, reporting quarterly production of ~426,300 ounces of gold, its second-best quarter on record since fiscal Q4 2021 when the company reported a monster quarter of ~444,000 ounces following its merger with Saracen Minerals. Broad-based strength across its portfolio helped to deliver the solid finish to the year, with Jundee contributing ~84,200 ounces, KCGM contributing ~111,600 ounces, and Pogo bringing up the rear with ~76,200 ounces, translating to annualized production rate of over 300,000 ounces per annum. This impressive finish to FY2023 allowed Northern Star to deliver into what looked to be an elusive annual guidance range of 1.56 to 1.68 million ounces of gold, and although sales came in well below the midpoint (1.62 million ounces), cost controls were solid with all-in sustaining costs [AISC] of A$1,759/oz, with these costs coming in below the industry average.
Northern Star Resources - Quarterly Production by Mine (Company Filings, Author's Chart)
Digging into the operations a little closer, the company's higher-grade Jundee Mine had a very solid quarter and year, producing ~84,200 ounces at A$1,355/oz (Q4 2022: ~91,400 ounces at A$1,172/oz), and ~320,200 ounces for the full year, a 3% increase vs. FY2022 production of ~310,200 ounces. The increased production was helped by higher throughput of ~3.02 million tonnes per annum that offset the decline in grades (3.6 vs. 3.9 grams per tonne of gold). Also of note is that Jundee reported record underground ore tonnes mined in the period of ~830,000 tonnes, up over 20% sequentially. The solid performance from Jundee more than offset lower mill volumes at Thunderbox, with its Yandal Production Center (Jundee, Thunderbox, Bronzewing) generating mine operating cash flow of A$124 million and net mine cash flow of A$63 million in fiscal Q4.
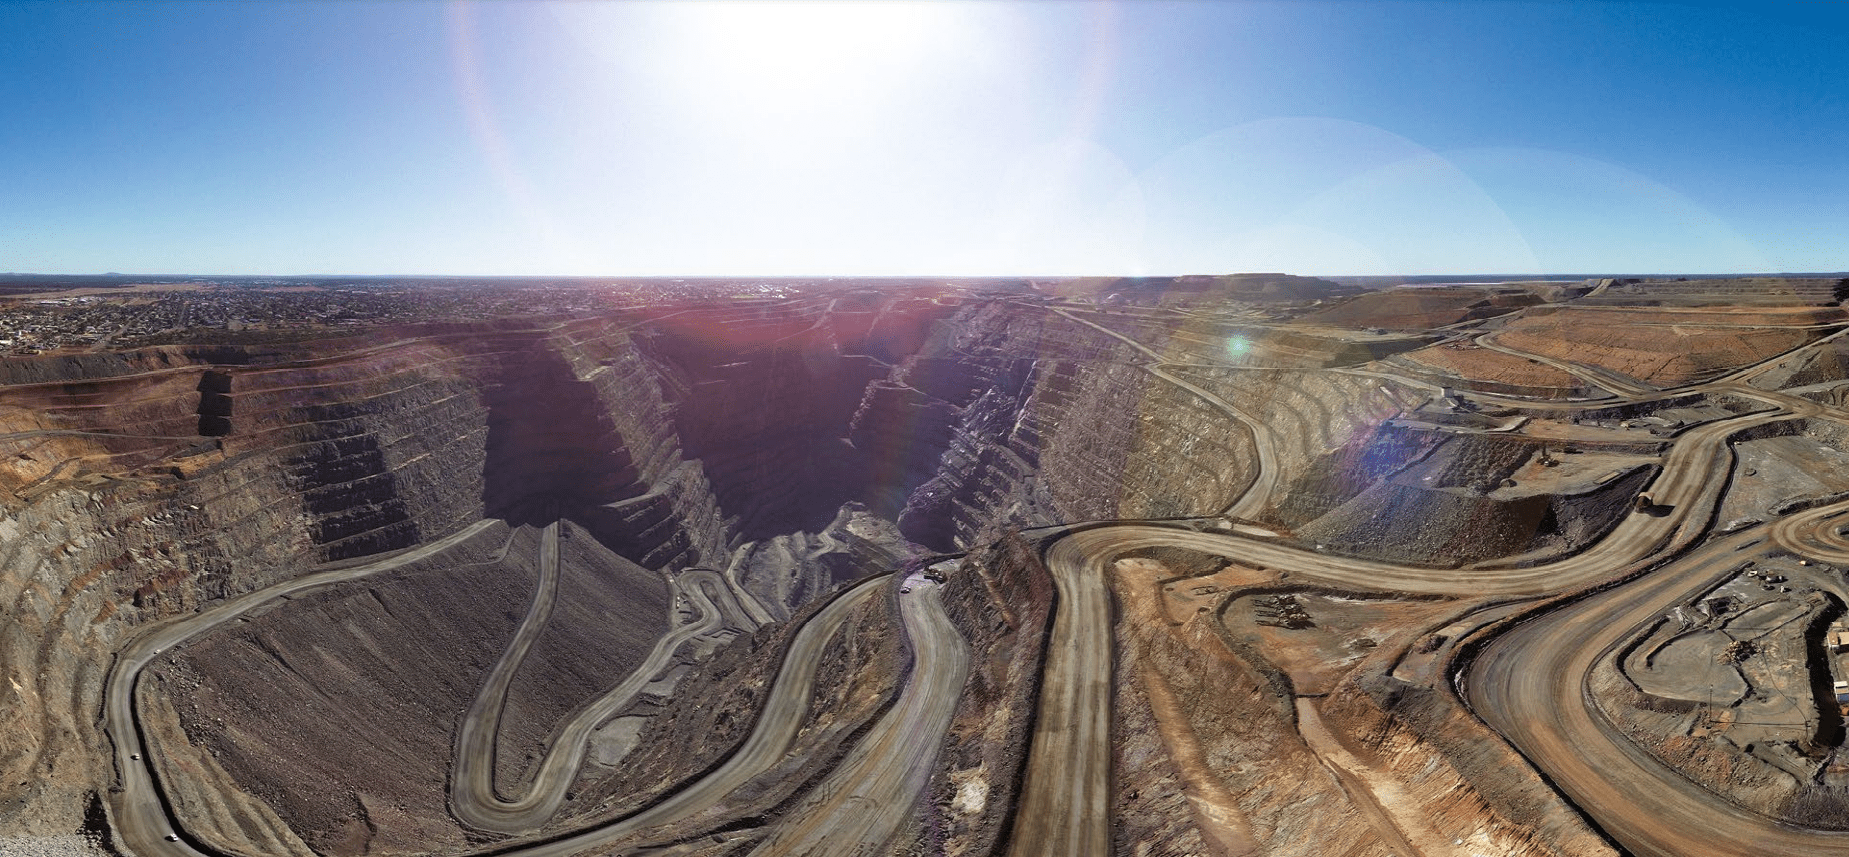
KCGM Operations (Company Website)
Moving over to KCGM, the mine was up against difficult comps with a huge quarter in fiscal Q4 2022 (~124,500 ounces produced), and while it wasn't able to lap these comparisons with a beat, it had a solid quarter with ~111,600 ounces produced at A$1,604/oz. And while fiscal Q4 2023 production was lower due to lower throughput (~3.14 million tonnes processed vs. ~3.40 million tonnes processed in fiscal Q4 2022), grades remained strong with increased underground contribution (~514,700 tonnes of ore mined vs. ~403,600 tonnes of ore mined), tracking at an annualized rate of ~2.0 million tonnes per annum. Just as noteworthy, total material movement came in at ~21.8 million tonnes per annum in fiscal Q4 while annual material movement was ~87 million tonnes, up 26% year-over-year and tracking in line with the ultimate FY2026 target of 80 - 100 million tonnes per annum.
On a full-year basis, KCGM produced ~432,200 ounces, helping its Kalgoorlie Production Center to produce ~836,600 ounces in FY2023, albeit down slightly from ~894,700 ounces in FY2022. The lower production was primarily due to lower throughput and grades at KCGM, partially offset by a better year at Carosue Dam with slightly higher grades. However, the major news in fiscal Q4 was Northern Star approving the Fimiston Mill Expansion, which will increase mill throughput from ~13.0 million tonnes per annum to ~27 million tonnes per annum. The result is that KCGM will be set up to produce ~900,000 ounces per annum in FY2029 at sub US$1,000/oz costs and will leapfrog Barrick's ( GOLD ) Pueblo Viejo and Kibali mines in terms of scale, and come in just behind Nevada Gold Mines' Carlin Complex and smaller Cortez Complex at ~1.4 and ~1.0 million ounces post-2025 on a 100% basis.
Finally, while there has been little to write home about regarding Northern Star's Alaskan Pogo Mine after what's been a slower than planned turnaround and delivery of its 300,000-ounce per annum goal, fiscal Q4 2023 and FY2023 was a much better year. This was evidenced by fiscal Q4 production of ~76,200 ounces of gold at all-in sustaining costs of US$1,254/oz, a nearly 10% increase from ~70,800 ounces in the year-ago period. Notably, this was despite processed grades being below reserve grades with one-third of feed coming from development ore, and FY2023 performance was also impressive, with ~244,000 ounces sold at AISC of US$1,431/oz, beating Northern Star's FY2023 guidance midpoint of ~233,000 ounces at US$1,448/oz. And in terms of financial performance, Pogo reported net mine cash flow of A$48 million, up 380% year-over-year helped by higher margins and lower growth capital.
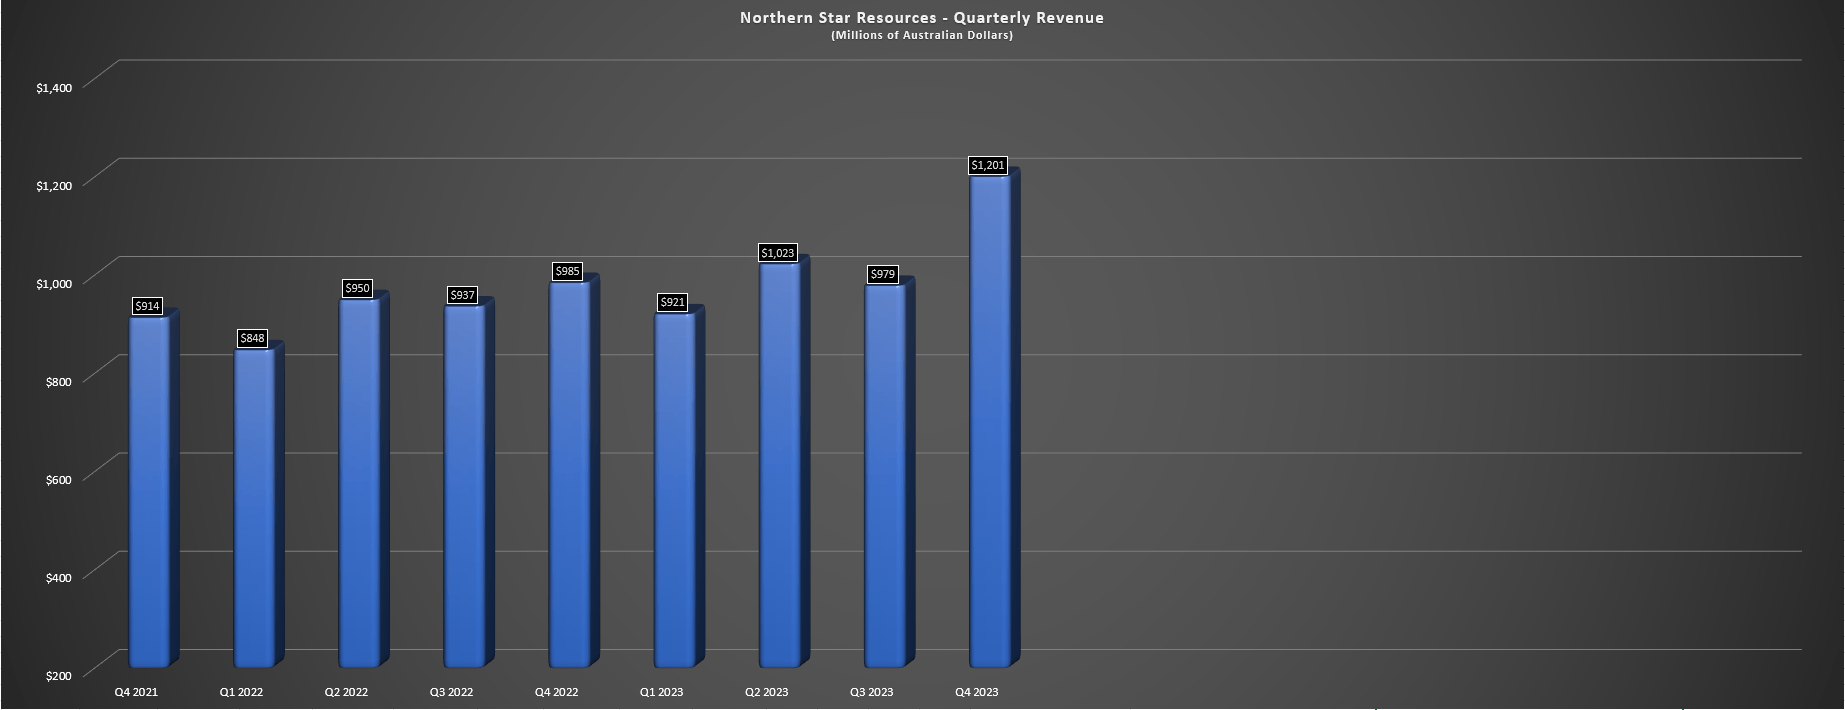
Northern Star Resources - Quarterly Revenue (Company Filings, Author's Chart)
Moving to Northern Star's sales performance, fiscal Q4 revenue came in at a record A$1,201 million, helped by higher gold sales (~426,300 ounces), lower deliveries into hedges, and a higher average realized gold price of A$2,800/oz. And while fiscal Q1 will be a softer quarter with FY2024 output expected to be back-end weighted, fiscal Q1 should get a lift from continued strength in the gold price, helping Northern Star to put up another solid quarter compared to an average realize d gold price of A$2,484/oz in the year-ago period. As for full-year guidance, Northern Star has guided for FY2024 sales of ~1.60 to ~1.75 million ounces at AISC of A$1,730/oz to A$1,790/oz, and although costs will remain at similar levels, the company is not factoring any cost relief into guidance.
Costs & Margins
Looking at costs and margins, Northern Star reported all-in sustaining costs of A$1,700/oz in fiscal Q4, up from A$1,650/oz in the year-ago period. And while this cost increase on slightly higher sales was disappointing, this can be attributed to inflationary pressures and a tight labor market in Western Australia throughout most of the year. Meanwhile, FY2023 costs were up nearly 8% to A$1,759/oz compared to A$1,633/oz in FY2022. Fortunately, the company noted that costs were stabilizing even if it is seeing stickiness on labor/contractor costs, and although costs were up, a higher average realized gold price allowed Northern Star to report margin expansion on a year-over-year basis. In fact, AISC margins improved to A$900/oz, up from A$834/oz in fiscal Q4 2022.
Northern Star - Average Realized Gold Price & AISC (Company Filings, Author's Chart)
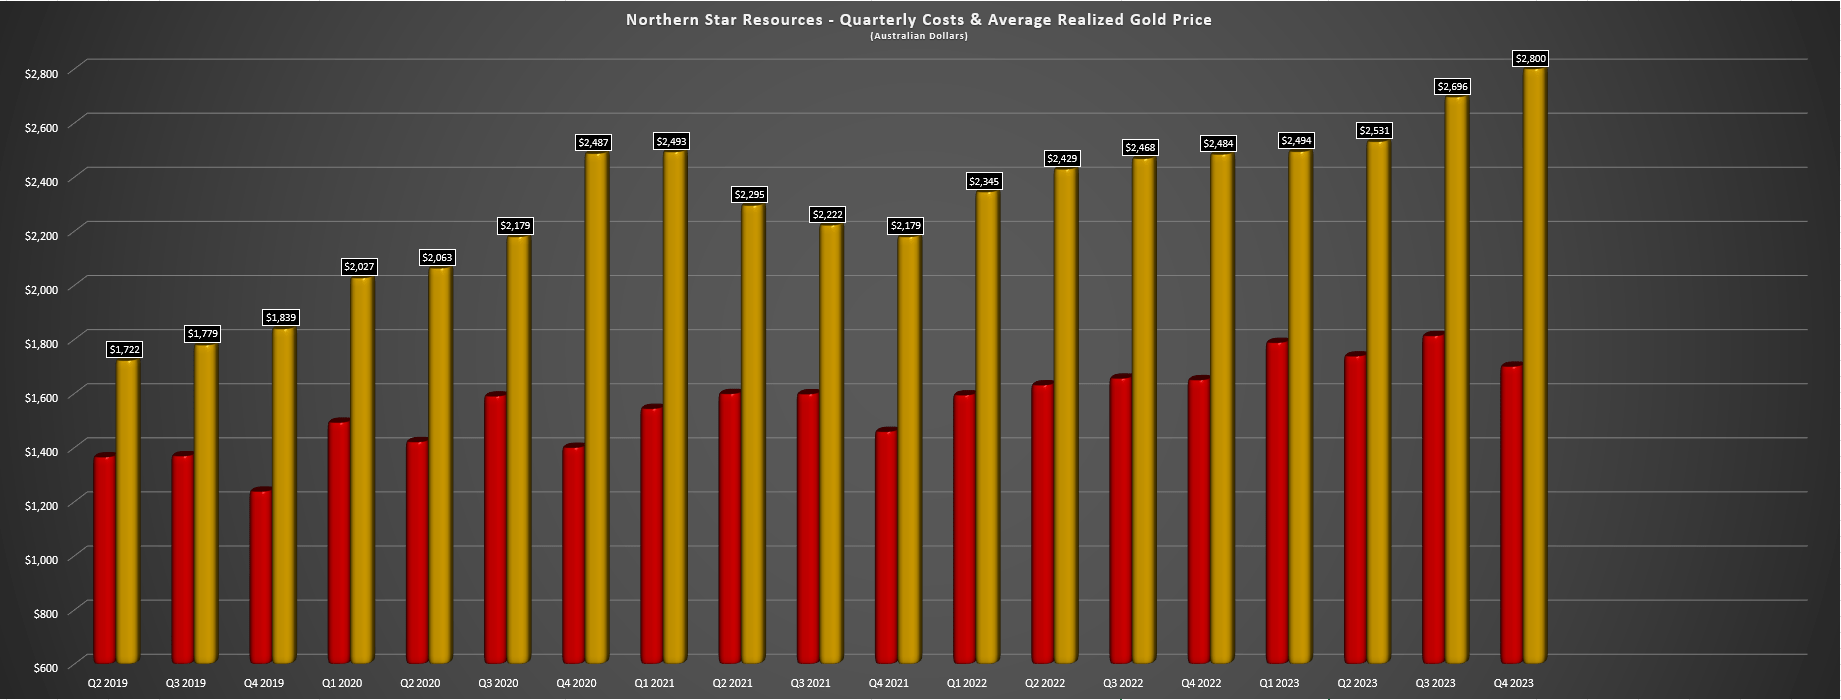
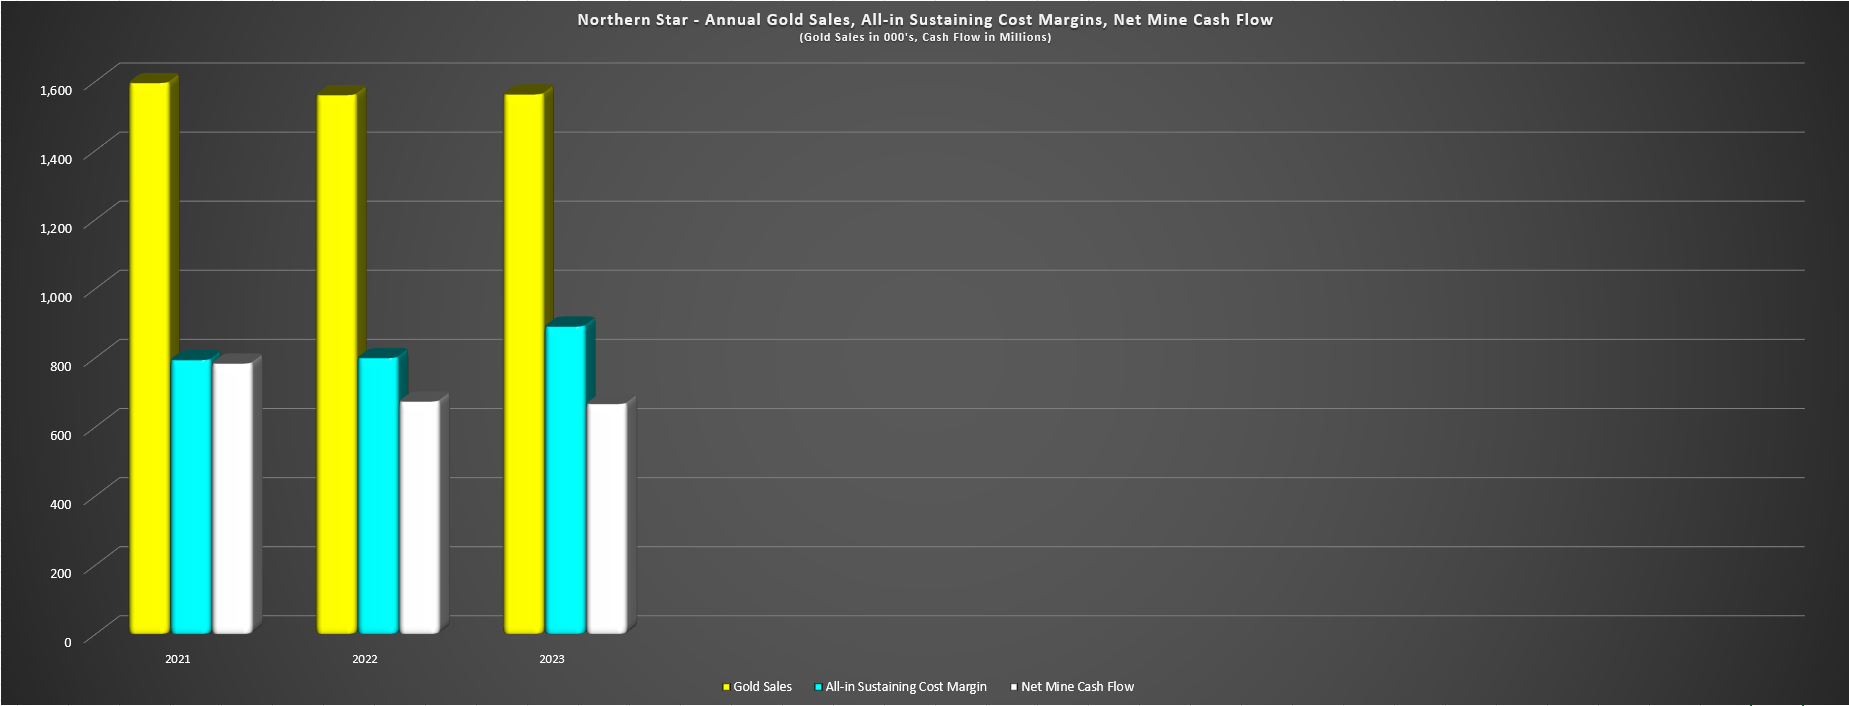
Looking at Northern Star's margin performance on a full-year basis, AISC margins improved to A$891/oz, helped by a much higher average realized gold price (A$2,650/oz vs. A$2,433/oz) that offset the slight increase in unit costs. This allowed Northern Star to report significant growth in full-year revenue and operating cash flow to A$4.12 billion and A$1.39 billion, respectively, and the company held the line on net mine free cash flow despite a busy year from a growth capital standpoint. The latter was partially related to early works and procurement of long-lead items for its KCGM Expansion Project. Let's take a look at the financial results below:
Financial Results
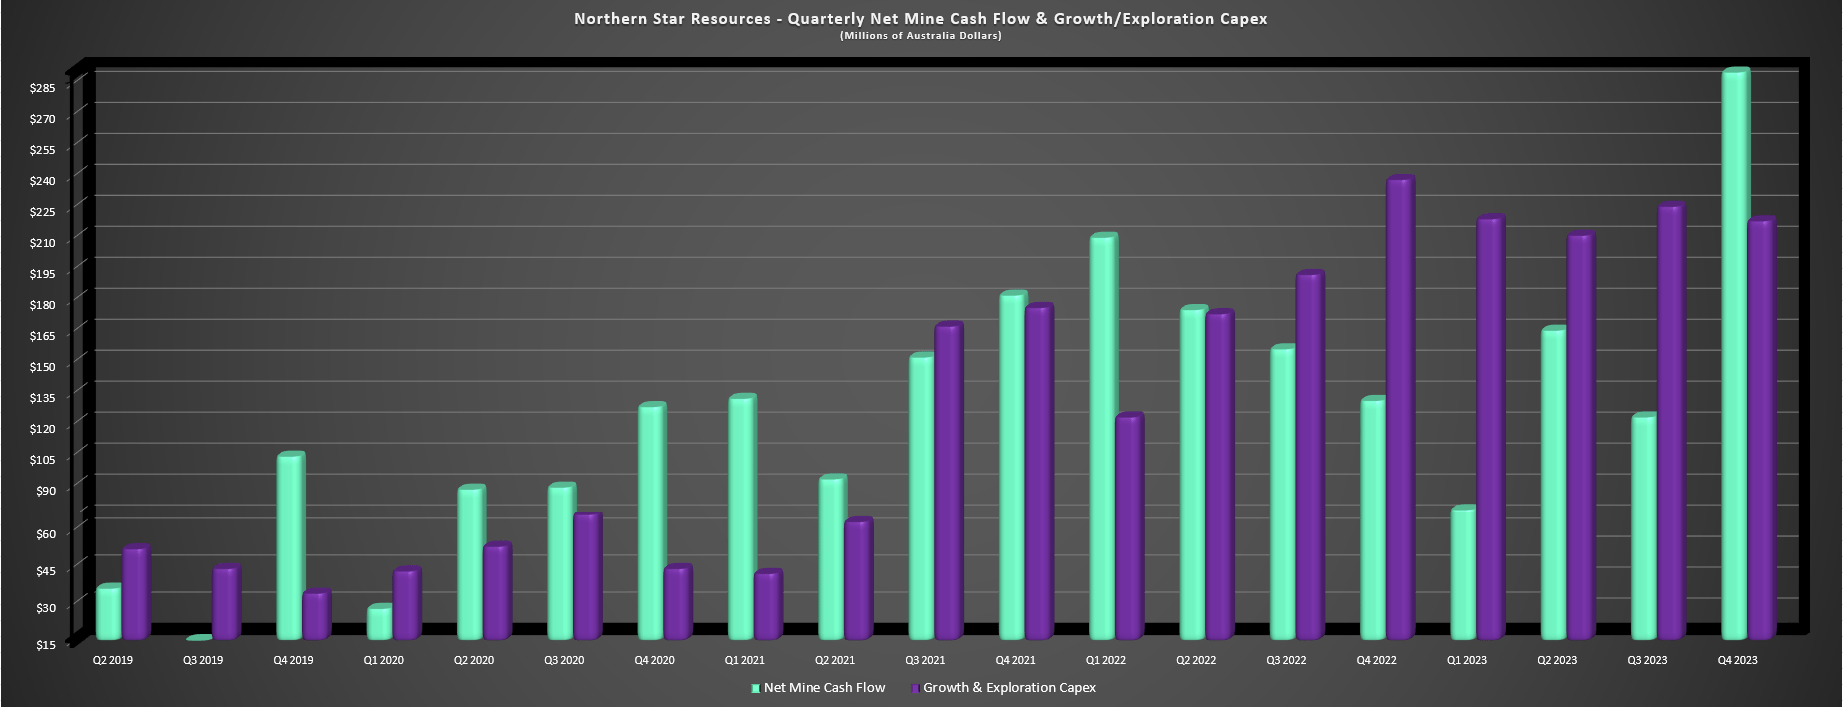
Digging into Northern Star's quarterly performance, net mine cash flow hit a record A$302 million in fiscal Q4 despite significant growth capital in the period (A$192 million), while operating cash flow came in at A$494 million. This massive finish to FY2023 helped Northern Star to report just shy of A$670 million in net mine cash flow for the year, a marginal decrease year-over-year despite A$727 million in growth capital. That said, while FY2023 was a great year that helped Northern Star to exit FY2023 with a net cash position of over US$220 million, FY2024 will be a higher cost year with growth capital of A$1.15 billion to A$1.25 billion with A$525 million in planned spending on the KCGM Mill Expansion. Fortunately, Northern Star has ample liquidity and the gold price is cooperating, suggesting another strong year financially even if it will be a costlier year with a major step-up in investments across its business.
Northern Star Resources - Quarterly Net Mine Cash Flow vs. Growth/Exploration Capex (Company Filings, Author's Chart) Northern Star - Annual Gold Sales, AISC Margins & Net Mine Cash Flow (Company Filings, Author's Chart)
Valuation
Based on ~1160 million fully diluted shares and a share price of US$9.15, Northern Star trades at a market cap of ~$10.6 billion and an enterprise value of ~$10.4 billion, placing it well ahead of other producers of similar size on valuation like Endeavour Mining ( OTCQX:EDVMF ), Harmony Gold ( HMY ), and Pan American Silver ( PAAS ). That said, Northern Star is unique from a jurisdictional standpoint, being one of the few large-scale producers with over 90% of production from Tier-1 ranked jurisdictions. For this reason, and given that its costs have dropped beneath the industry average (US$1,180/oz vs. US$1,320/oz), the stock trades at a premium multiple relative to its peer group. And with the company approving the KCGM Expansion, there is an argument for Northern Star to maintain this premium multiple, given that it will be the proud owner of one of the largest gold assets globally post-2027, with KCGM expected to produce ~900,000 ounces at sub US$1,000/oz costs once at steady state.
However, while Northern Star certainly deserves a premium multiple, the stock continues to trade at a healthy premium to its estimated net asset value (~$8.7 billion), and also a premium cash flow multiple, with the stock currently trading at ~10x FY2024 cash flow per share estimates. Meanwhile, there are other producers like Barrick Gold trading at deep discounts to fair value (below 1.0x P/NAV) and less than 7x FY2024 cash flow per share estimates with a similar cost profile, better diversification, and a stronger pipeline, even if Northern Star is the clear winner from a jurisdictional. So, with Barrick offering a larger margin of safety at current levels, I see it as the more attractive reward/risk setup currently. In addition, Northern Star is more extended from a technical standpoint with it up over 120% off its lows, so I would view any rallies above US$10.60 before September as profit-taking opportunities.
Summary
Northern Star put together a solid FY2023 performance given the continued labor challenges over the past year, even if gold sales came in at the low end of its guidance range (~1.56 million ounces vs. guidance of 1.56 - 1.68 million ounces). Meanwhile, costs were better than I expected, helped by strong years from Pogo and Jundee, and a decent year from KCGM, which had to lap tough comps from FY2022. However, Australian producers like Northern Star and Evolution Mining ( OTCPK:CAHPF ) have significantly outperformed many of their North American intermediate/senior producer peers, and I prefer to buy only when stocks are hated, which typically provides a meaningful margin of safety for investment. So, while I see Northern Star as a top-10 producer sector-wide, I don't see nearly enough margin of safety at current levels, hence why I continue to focus elsewhere for the time being in terms of putting new capital to work.
For further details see:
Northern Star Resources: A Strong Finish To FY2023