NOV - NOV: A Balanced Approach For Long-Term Investors
2023-10-24 12:33:06 ET
Summary
- NOV reported in July a 21% YoY increase in Q2 2023 revenue, showing strength in the oil and gas sector.
- While NOV has growth potential, supply chain challenges and geopolitical risks temper the outlook, making it less of a clear "Buy.".
- The current market price of NOV falls within the calculated fair value range, indicating that the stock is fairly priced at the moment.
Investment Thesis
NOV Inc. ( NOV ) has demonstrated strength in the oil and gas sector. Its Q2 2023 revenue of $2.09 billion, marking a 21% year-over-year increase, and a 68% recovery from pandemic lows, is impressive.
While NOV has growth potential and strategic initiatives in place, there are serious considerations to account for, such as supply chain challenges and geopolitical risks. These factors temper the outlook and make the stock less of an outright "Buy."
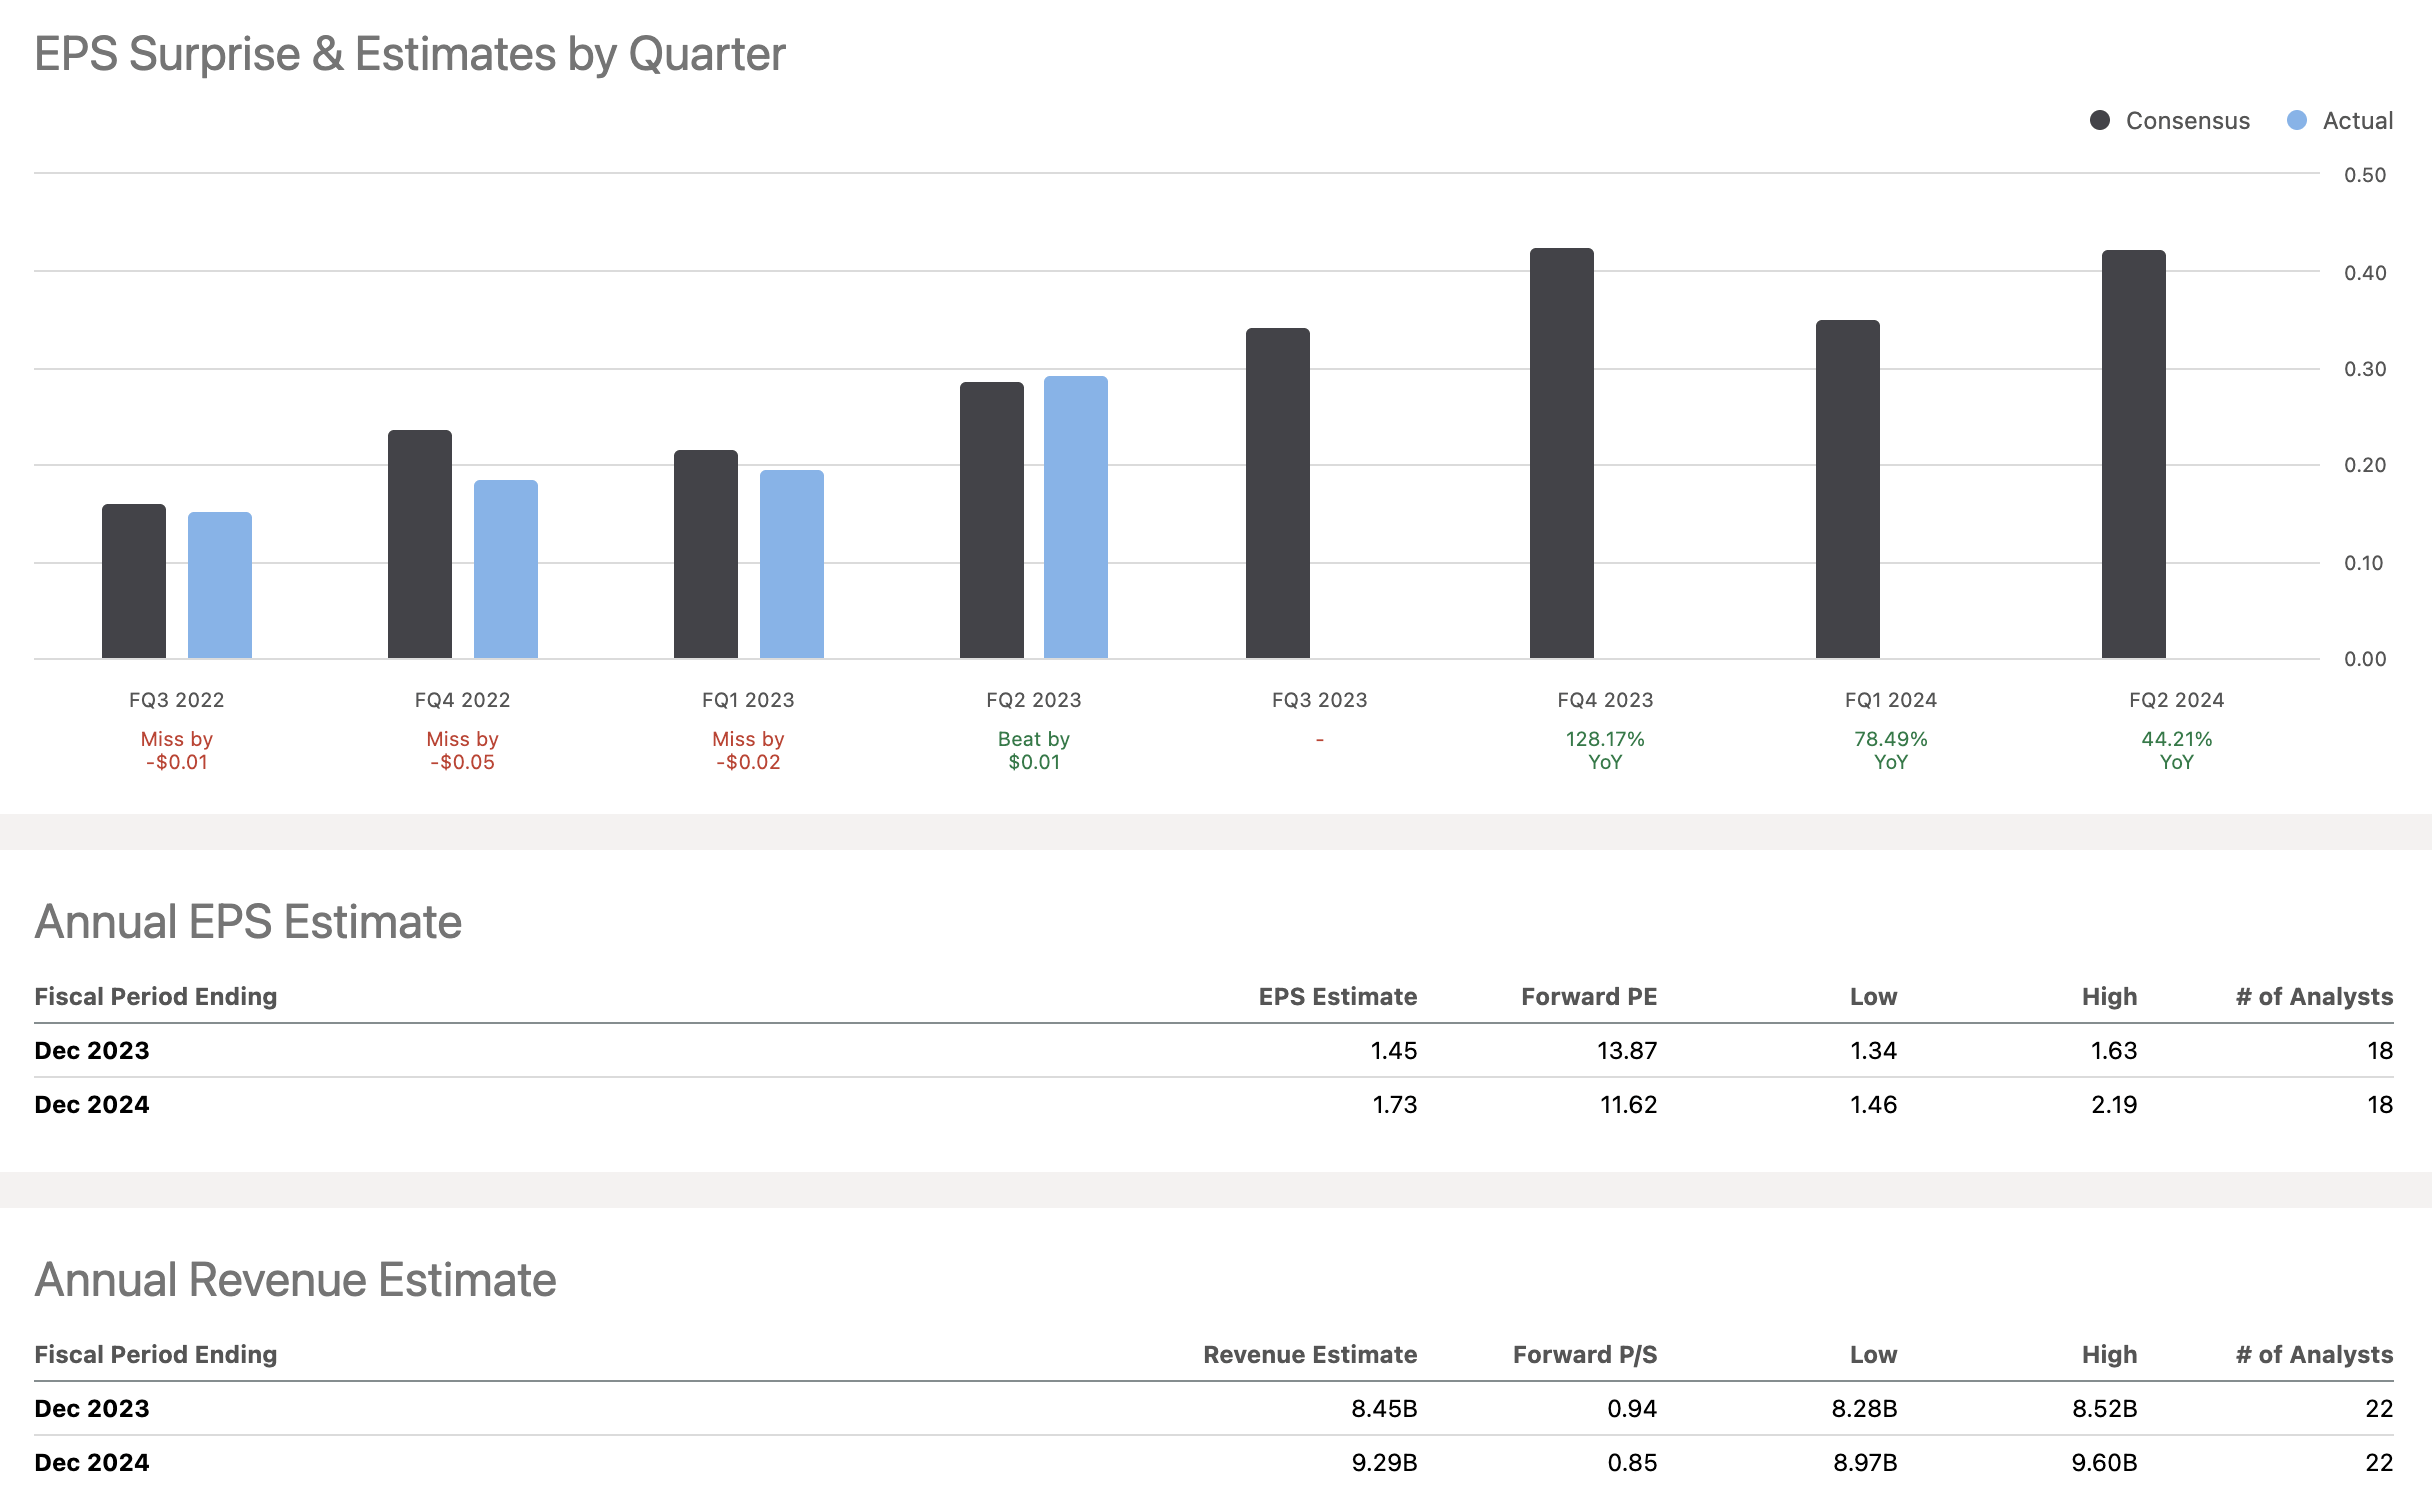
For the earnings to be announced in the September quarter on October 26th, 2023, analysts expect a 2.6% quarter-over-quarter growth in revenues and 14.3% growth in EPS against June 2023. The revenue and EPS figures exhibit positive momentum, pointing towards a stronger financial performance in the September quarter. Hence, the company appears to be on a positive financial course, as indicated by the incremental increases in both revenue and EPS forecasts from June to September.
Additionally, in the valuation analysis, the current market price of NOV at $20.09 falls within the calculated fair value range of $19.86 to $22.40. This indicates that the stock is fairly priced at the moment. The downside risk of -1.1% is minimal, but the upside of 11.5% is also not overwhelming. In such a situation, neither buying more shares nor selling existing ones provides a clear advantage.
Overview
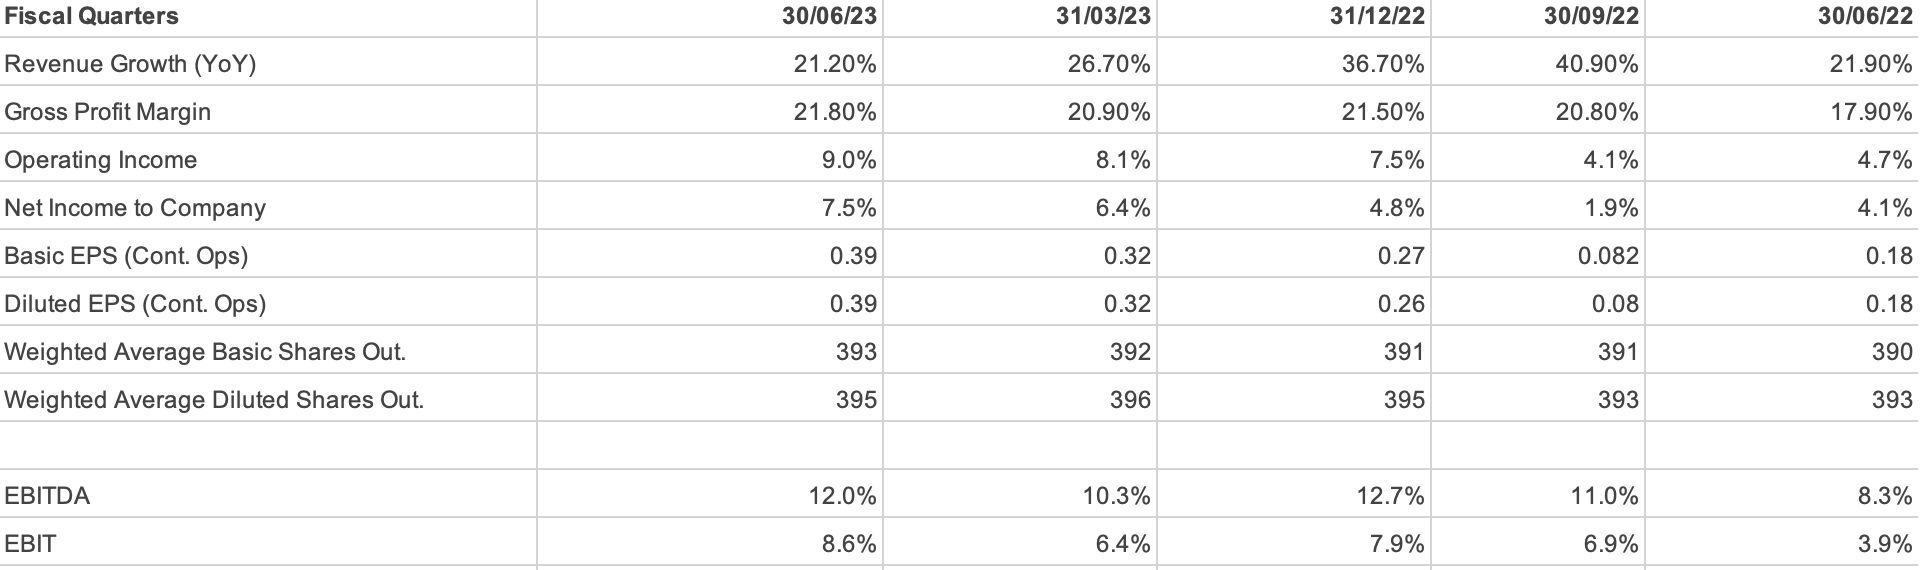
NOV Inc. provides technology and equipment to the oil and gas sector. In Q2 2023, released on July 2023, the company reported revenues o f $2.09 billion, a 7% sequential increase from the last quarter and a 21% year-over-year increase. Further, the company reported an Earnings Per Share of $0.39 and EBITDA of $245 million, making up 11.7% of the total sales. This growth trajectory is substantiated by a 68% revenue increase from the pandemic's low point in Q1 2021. When we talk about the flow-through rate, which essentially means how much of the revenue is turning into profit, NOV scored a 38% sequential QoQ increase, making its operations increasingly efficient. However, the company faces challenges in its supply chain, which it is actively addressing.
On the strategic front, the company has initiated plans aimed at improving business margins, with a strategy to save around $75 million annually within the coming year.
The robustness in NOV's financials is driven by growth in international and offshore activities. This international focus has allowed the company to tap into markets like West Africa, Asia, the North Sea, and offshore Mexico. Moreover, they are diversifying their product offerings to include gas processing and Floating Production Storage and Offloading (FPSO) products, which are expected to witness increased demand shortly.
From an industry perspective, NOV's growth coincides with the overall recovery of the oil and gas sector. Despite experiencing headwinds in North America, the international markets appear strong, further driving the company's growth. These market conditions position NOV as a potentially beneficial long-term investment, especially given its focus on sustainability through initiatives to reduce greenhouse gas emissions.
The company's low leverage in the Rig Technologies segment and its increased working capital intensity could be red flags, although they are expected to be temporary.
Speaking of future prospects, NOV forecasts revenues to increase by 5% to 10% higher than Q2 levels, backed by market expansion and operational efficiency. As for liquidity, the free cash flow is expected to be breakeven for the current year, but the outlook for 2024 is robust, with an expectation of free cash flow exceeding 50% of EBITDA. This is backed by the growth in revenues and EBITDA across multiple business segments, including Wellbore Technologies and Downhole Tools. The company's global reach, particularly in Asia and Africa, adds weight to this projection. Market trends further validate NOV's strong position, as there is a noted improvement in demand in international and offshore markets, sectors where NOV has already been gaining additional market share, particularly in North America.
Therefore, NOV's financials, market trends, and strategic initiatives make it a compelling choice for long-term investment, provided that one also accounts for market risks, especially given the recent conflicts in the Middle East involving Israel and Hamas.
Revenue Analysis
In Q2 2023, NOV reported growth across its business segments, with Wellbore Technologies leading the pack, posting a 20.7% YoY increase in revenue from $666 million to $804 million. Similarly, Completion & Production Solutions and Rig Technologies experienced a YoY revenue growth of 17.8% and 31.2%, respectively. When we look at the half-yearly figures, Wellbore Technologies saw a 21.6% increase from $1,274 million in 2022 to $1,549 million in 2023. The company's total revenue for Q2 2023 came in at $2,093 million, a 21.2% increase compared to $1,727 million in Q2 2022. This growth isn't only limited to revenue; the company's operating profits are also on an uptrend. Wellbore Technologies had a YoY operating profit increase of 58%, jumping from $81 million to $128 million. The other segments also followed suit, with Completion & Production Solutions growing from $20 million to $53 million (165% YoY), and Rig Technologies moving from $31 million to $64 million, marking a 106.5% YoY increase.
The drilling activities also showed interesting trends. These rigs use the types of equipment and services that NOV specializes in, making the number of active rigs a key performance indicator. In the U.S., the year-over-year (YoY) increase of 1% in active drilling rigs suggests a stable slightly growing, demand for NOV's offerings. However, a quarter-over-quarter (QoQ) decrease of 5.1% could be indicative of seasonal variations. The situation in Canada is more concerning, with a 0.9% YoY increase in active rigs and a significant 48.4% QoQ drop. This steep QoQ decline could be a major red flag, possibly indicating a regional downturn in Canada. The international scene appears promising for NOV, showing a strong YoY increase of 17.8% and a QoQ increase of 4.9% in active drilling rigs. This growth in international markets can serve as a buffer against domestic market fluctuations, offering NOV diversified avenues for revenue.
Commodity prices played a significant role in this performance. West Texas Intermediate Crude Prices dropped by 32.2% YoY and 3.0% QoQ. The Natural Gas prices declined by 71.0% YoY and 18.5% QoQ. This is an important indicator because a drop in crude and natural gas prices can lead to reduced spending by oil and gas companies on the kinds of services and products that NOV offers. While the company is diversified across segments, the drop in commodity prices could be a concern. The company's Adjusted EBITDA increased by 63% YoY from $150 million to $245 million, demonstrating strong financial health.
In addition, there are challenges and risks. The $72 million used for increasing working capital could point to liquidity concerns, and volatile commodity prices are always a threat.
Looking ahead, if the current market conditions persist, the momentum in both revenue and operating profit is likely to continue. The YoY and H1 increase in these metrics are indicators of future performance. Another metric that underscores this is the Adjusted EBITDA, which grew from $150 million in Q2 2022 to $245 million in Q2 2023, marking a 63% YoY growth. This indicates the company's strong cash-generating ability, which, in turn, improves its liquidity and reduces financial risk. The expected 5% to 10% growth in revenue for future quarters and the projection that free cash flow will exceed 50% of EBITDA by 2024 further strengthen this outlook.
To sum up the overall financial health through a SWOT analysis: Strengths include strong revenue and operating profit growth and an improved operating margin. Weaknesses are its vulnerability to market volatility and geopolitical risks. Opportunities lie in the expansion into international markets, while threats encompass volatile commodity prices and geopolitical tensions.
Balance Sheet Analysis
The total assets have grown to $10,446 million in H1 2023, a 3.07% increase from the $10,135 million recorded as of December 31, 2022. This growth in assets is backed by a simultaneous increase in stockholders' equity, which has risen from $5,134 million to $5,497 million, registering a 7.07% growth. Interestingly, while assets and equity are on the rise, total liabilities have slightly contracted from $5,001 million to $4,949 million, down by 1.04%. In terms of liquidity, the current ratio has improved from 2.25 in 2022 to 2.35 in 2023. However, the quick ratio, which is a more stringent measure of liquidity, shows a marginal decline from 1.15 in 2022 to 1.04 in 2023. This slight dip could be a point of concern in terms of meeting immediate financial obligations.
The debt-to-equity ratio has slightly reduced from 0.34 in 2022 to 0.31 in 2023?. This indicates a slightly reduced dependence on borrowed funds, which is a positive sign. In examining cash flows, the Adjusted EBITDA for Q2 2023 has seen a 63% YoY growth, up to $245 million from $150 million in Q2 2022. This increase indicates strong cash generation capabilities, which is a positive sign for any future investments and debt repayments the company may need to make. This goes hand-in-hand with the total assets and equity, both of which have been on an upward trajectory, indicating sound financial health and suggesting that the company is well-poised for future growth, as long as market conditions remain favorable.
Some potential red flags include the marginal decline in the quick ratio, which might signal future liquidity issues if it continues to drop. Also, inherent industry-specific risks remain, such as market volatility in the oil and gas sector and geopolitical tensions. Regulatory changes, especially in the energy sector, can also introduce new operational costs.
Free Cash Flow Analysis
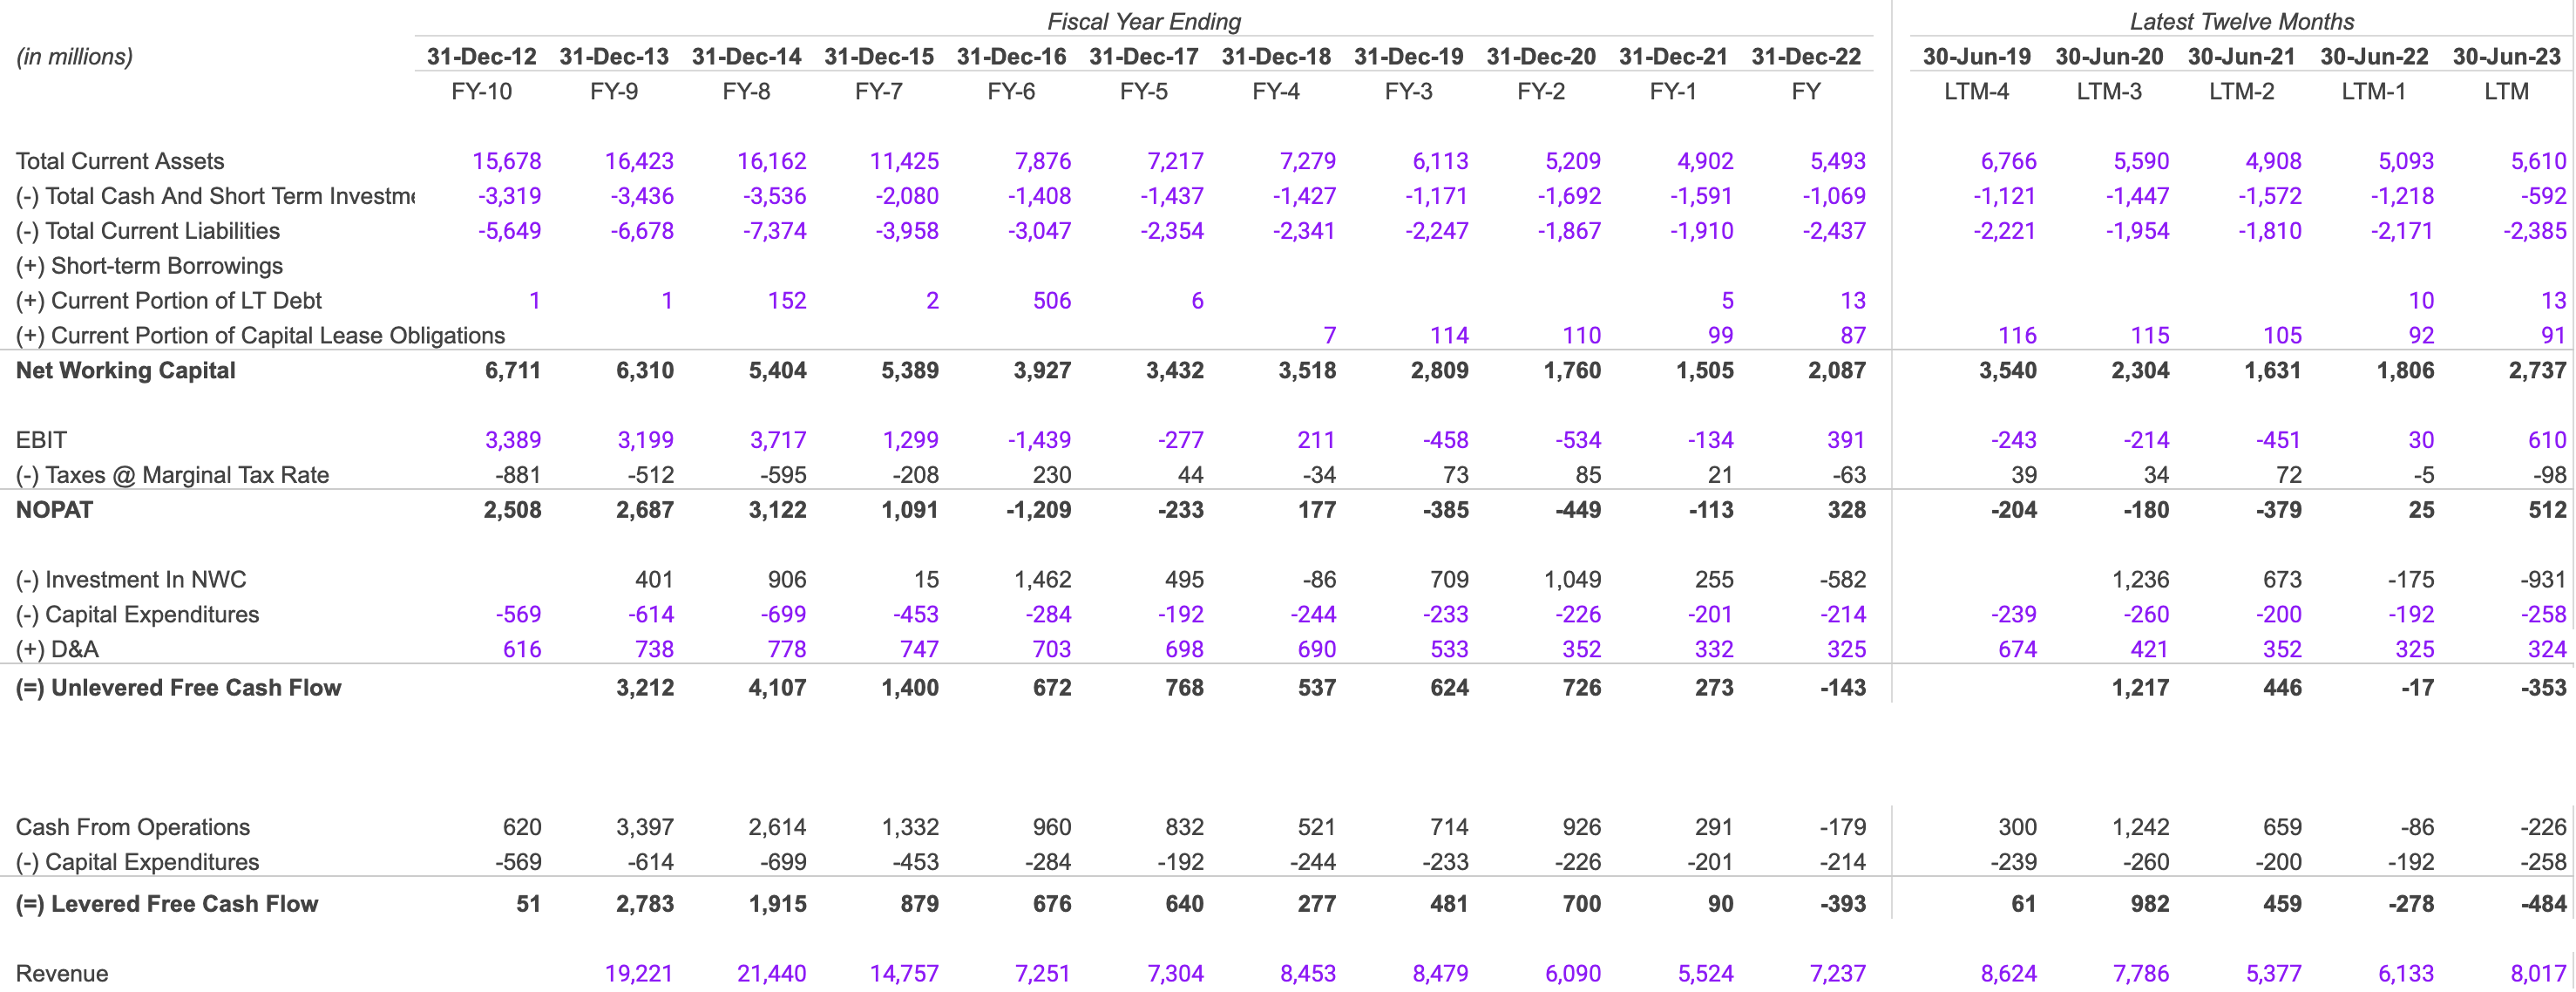
The Net Working Capital (NWC) has a growth of 67.7%, from $1,631 million in 2021 to $2,737 million in 2023. This spike indicates that the company is in a strong position to cover its short-term liabilities. Digging deeper into the components of NWC, the growth is mainly attributed to an increase in total current assets, which rose 14.3% from $4,908 million in 2021 to $5,610 million in 2023. Concurrently, current liabilities also increased but at a slower pace of 31.8%, from $1,810 million to $2,385 million during the same period. This slower rate of liability growth compared to assets further accentuates the company's liquidity position.
The Net Operating Profit After Taxes (NOPAT) has improved from a negative $379 million in 2021 to a positive $512 million in 2023. The growth of 2048% from 2022 to 2023 alone is a clear sign that the company's operations have become more profitable.
There are some red flags. One significant concern is the Unlevered Free Cash Flow, which has seen a decline from $446 million in 2021 to -$353 million in 2023. This downward trend indicates that the company is investing aggressively and failing to manage operational costs.
In 2023, the company decreased its investment in NWC by $931 million, contrasting with an increase of $673 million in 2021. This could suggest that the company is collecting its receivables more quickly. With regard to future forecasts, if the company continues on its current trajectory, we could expect NWC to reach around $4,588 million by 2024. However, if Unlevered Free Cash Flow continues its negative trend, a further 20% decline could place it at approximately -$424 million by 2024.
The company's key risks lie in the severe fluctuation in Unlevered Free Cash Flow, the potential inefficiency in using NWC, and increasing dependence on external financing if the negative cash flow trend persists.
Shareholder Yield
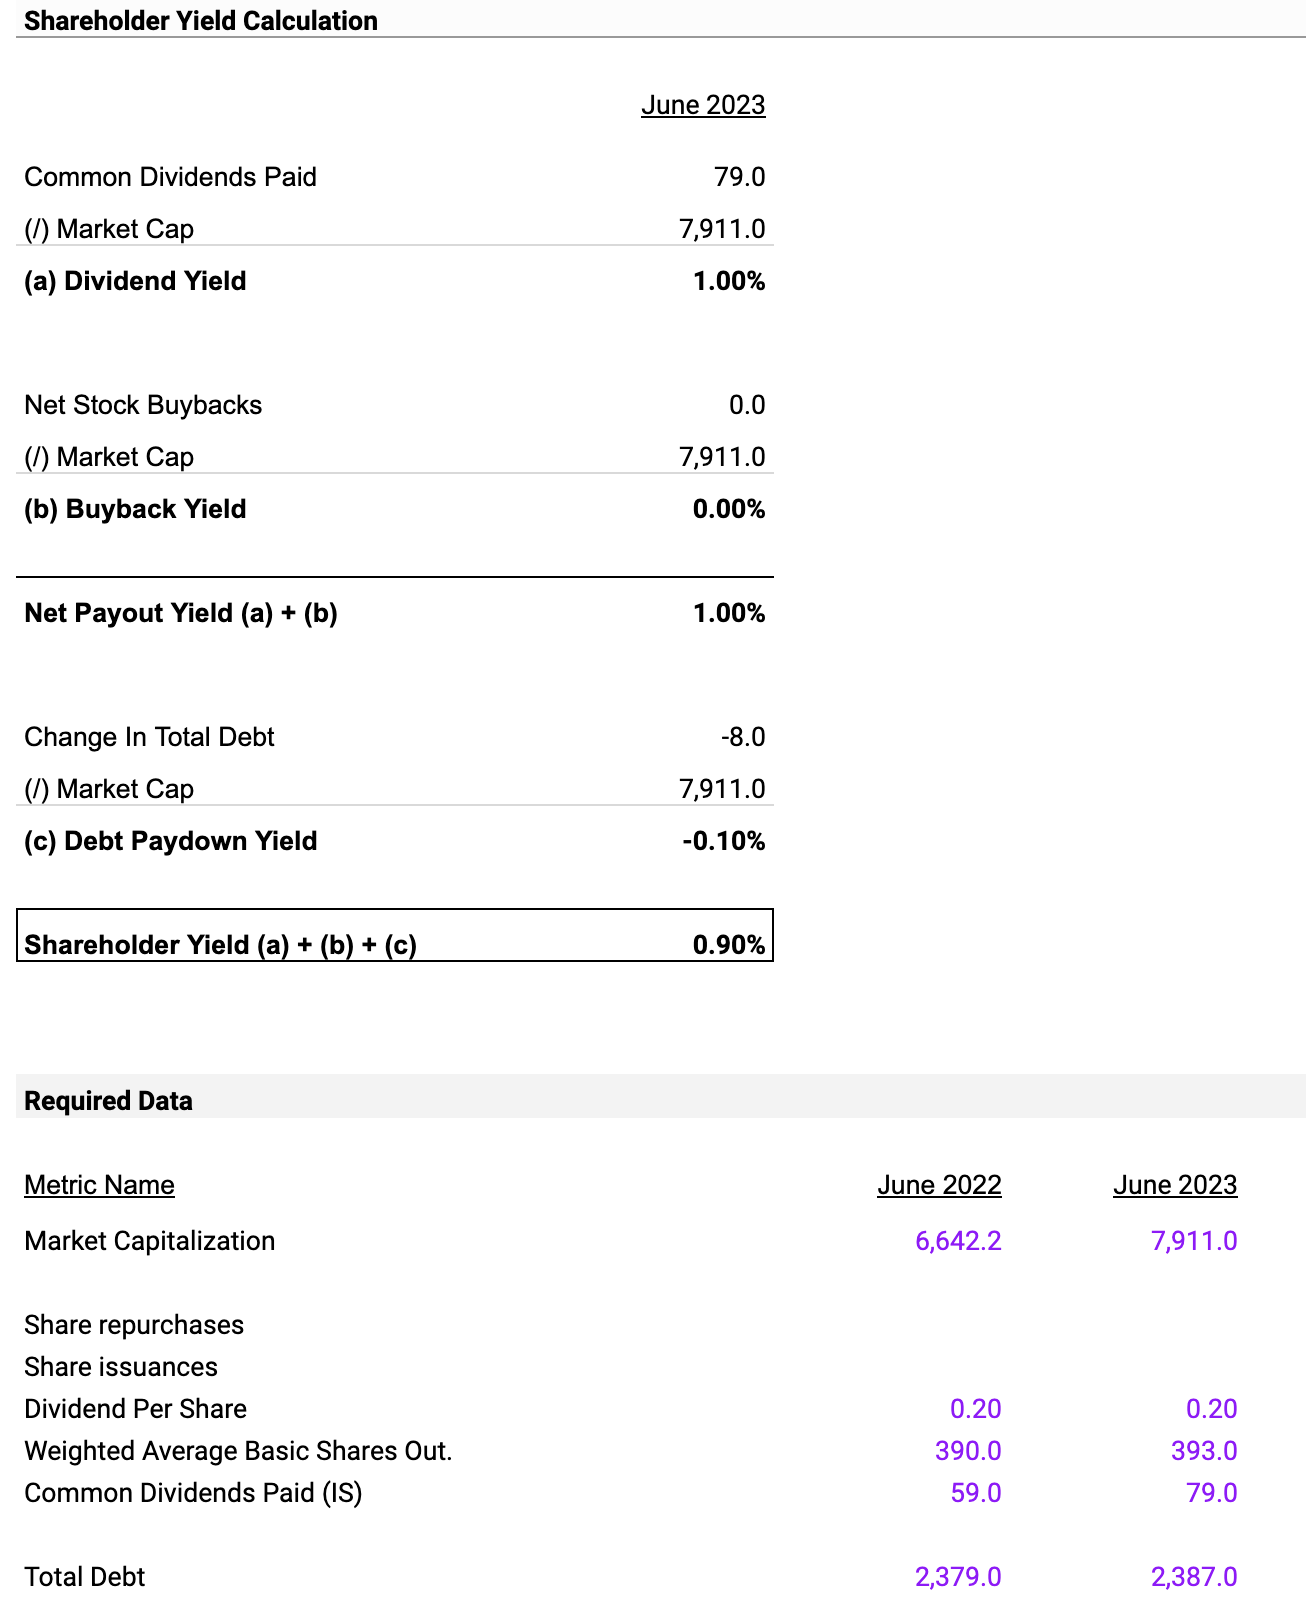
The Dividend Yield in June 2023 is 1%. The company has disbursed common dividends amounting to $79.0 million. Given its market capitalization of $7,911.0 million, the dividend yield stands at 1.00%. Moving to Buyback Yield, the company had zero net stock buybacks. The Net Payout Yield is 1.00%, which is essentially the sum of the dividend and buyback yields.
The Debt Paydown Yield is calculated as -0.10%. The company increased its total debt by $8.0 million, signaling an increase in financial leverage. The Shareholder Yield is 0.90%, which factors in dividends, buybacks, and debt reduction.
Value Assessment reveals that a dividend yield of 1% and a debt paydown yield of -0.10% are key value drivers. These are metrics that investors should closely monitor.
In a Forward-Looking Analysis, if the current trend persists, it's likely that the dividend yield will be around 1%.
Earnings Preview For September 2023
Analysts predict a revenue increase from $2,080 million in June 2023 to $2,134 million in September 2023, representing a 2.6% quarter-over-quarter growth. This upward trajectory is further supported by the increase in the median EPS forecast, from $0.28 in June to $0.32 in September, a 14.3% increase. Both the revenue and EPS figures exhibit positive momentum, pointing towards a stronger financial performance in the September quarter. Hence, the company appears to be on a positive financial course, as indicated by the incremental increases in both revenue and EPS forecasts from June to September.
Valuation
The objective of conducting an EV/EBITDA valuation is to assess the fair value of a company, irrespective of its capital structure. This ratio gives investors a cleaner and more standardized metric for comparison, especially when benchmarking against other companies in the industry. It's particularly useful for businesses with varying degrees of debt or different tax structures.
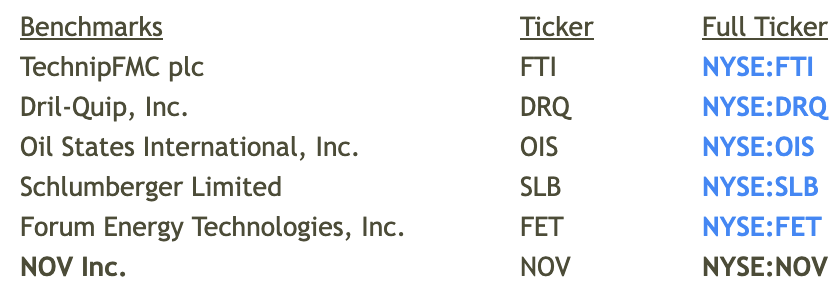
I have taken the following companies, TechnipFMC (FTI), Dril-Quip (DRQ), Oil States International (OIS), Schlumberger (SLB), and Forum Energy Technologies ( FET ) as benchmarks. These companies are appropriate benchmarks because they operate in similar market segments and have comparable business models to NOV Inc.
LTM EBITDA Multiple Analysis
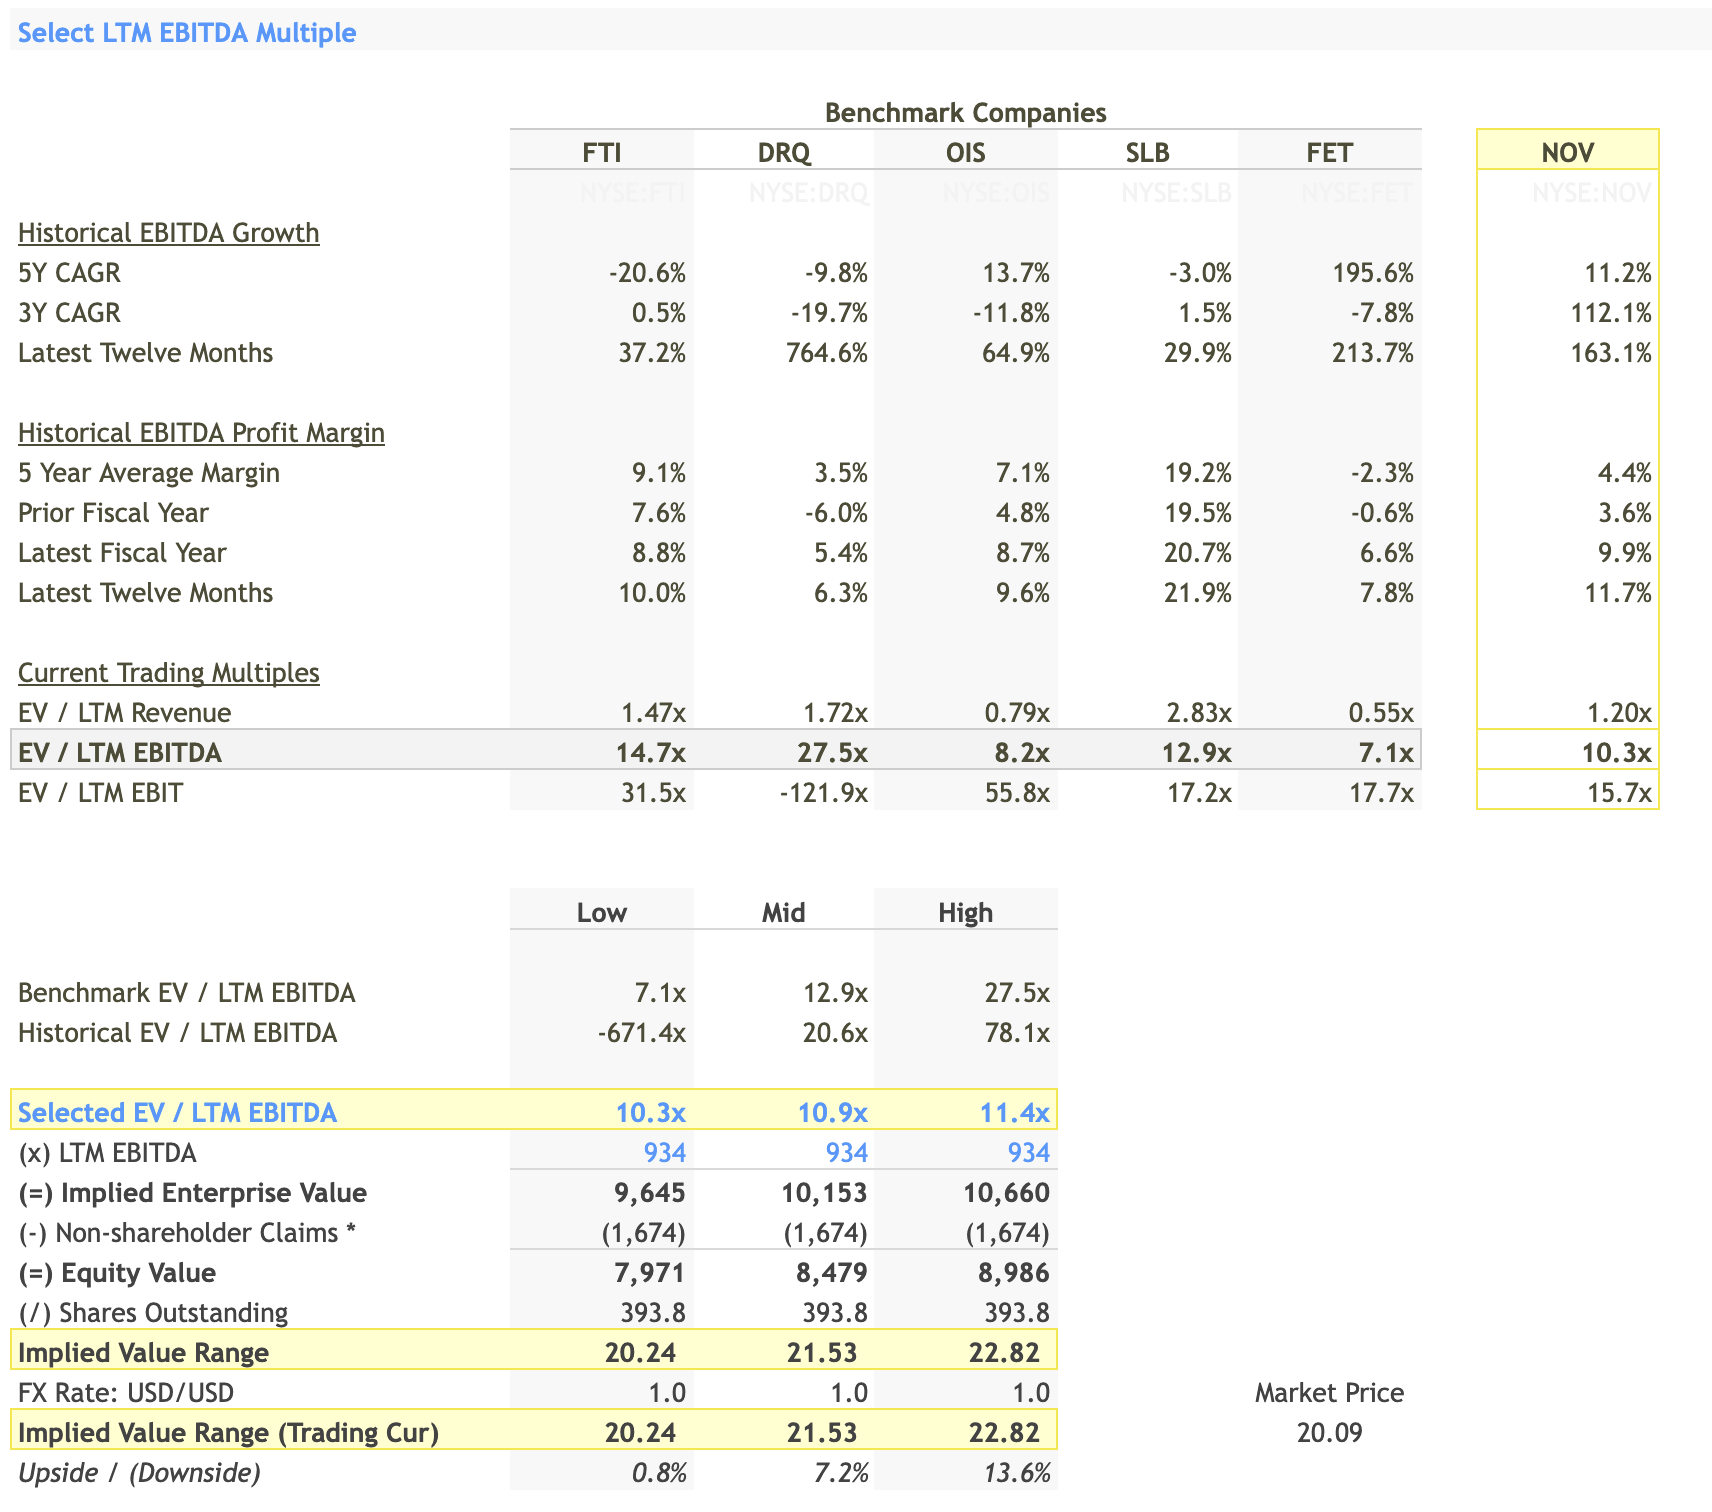
When we look at the Last Twelve Months (LTM) EBITDA multiple, the selected range for NOV is between 10.3x to 11.4x. This range was chosen based on a comparison with the benchmark companies, whose LTM EBITDA multiples ranged from 7.1x ((FET)) to 27.5x ((DRQ)). The implied enterprise value for NOV, when multiplied by its LTM EBITDA of 934 million, ranges from $9,645 million to $10,660 million. The implied stock price, therefore, ranges between $20.24 and $22.82.
Projected EBITDA Multiple Analysis
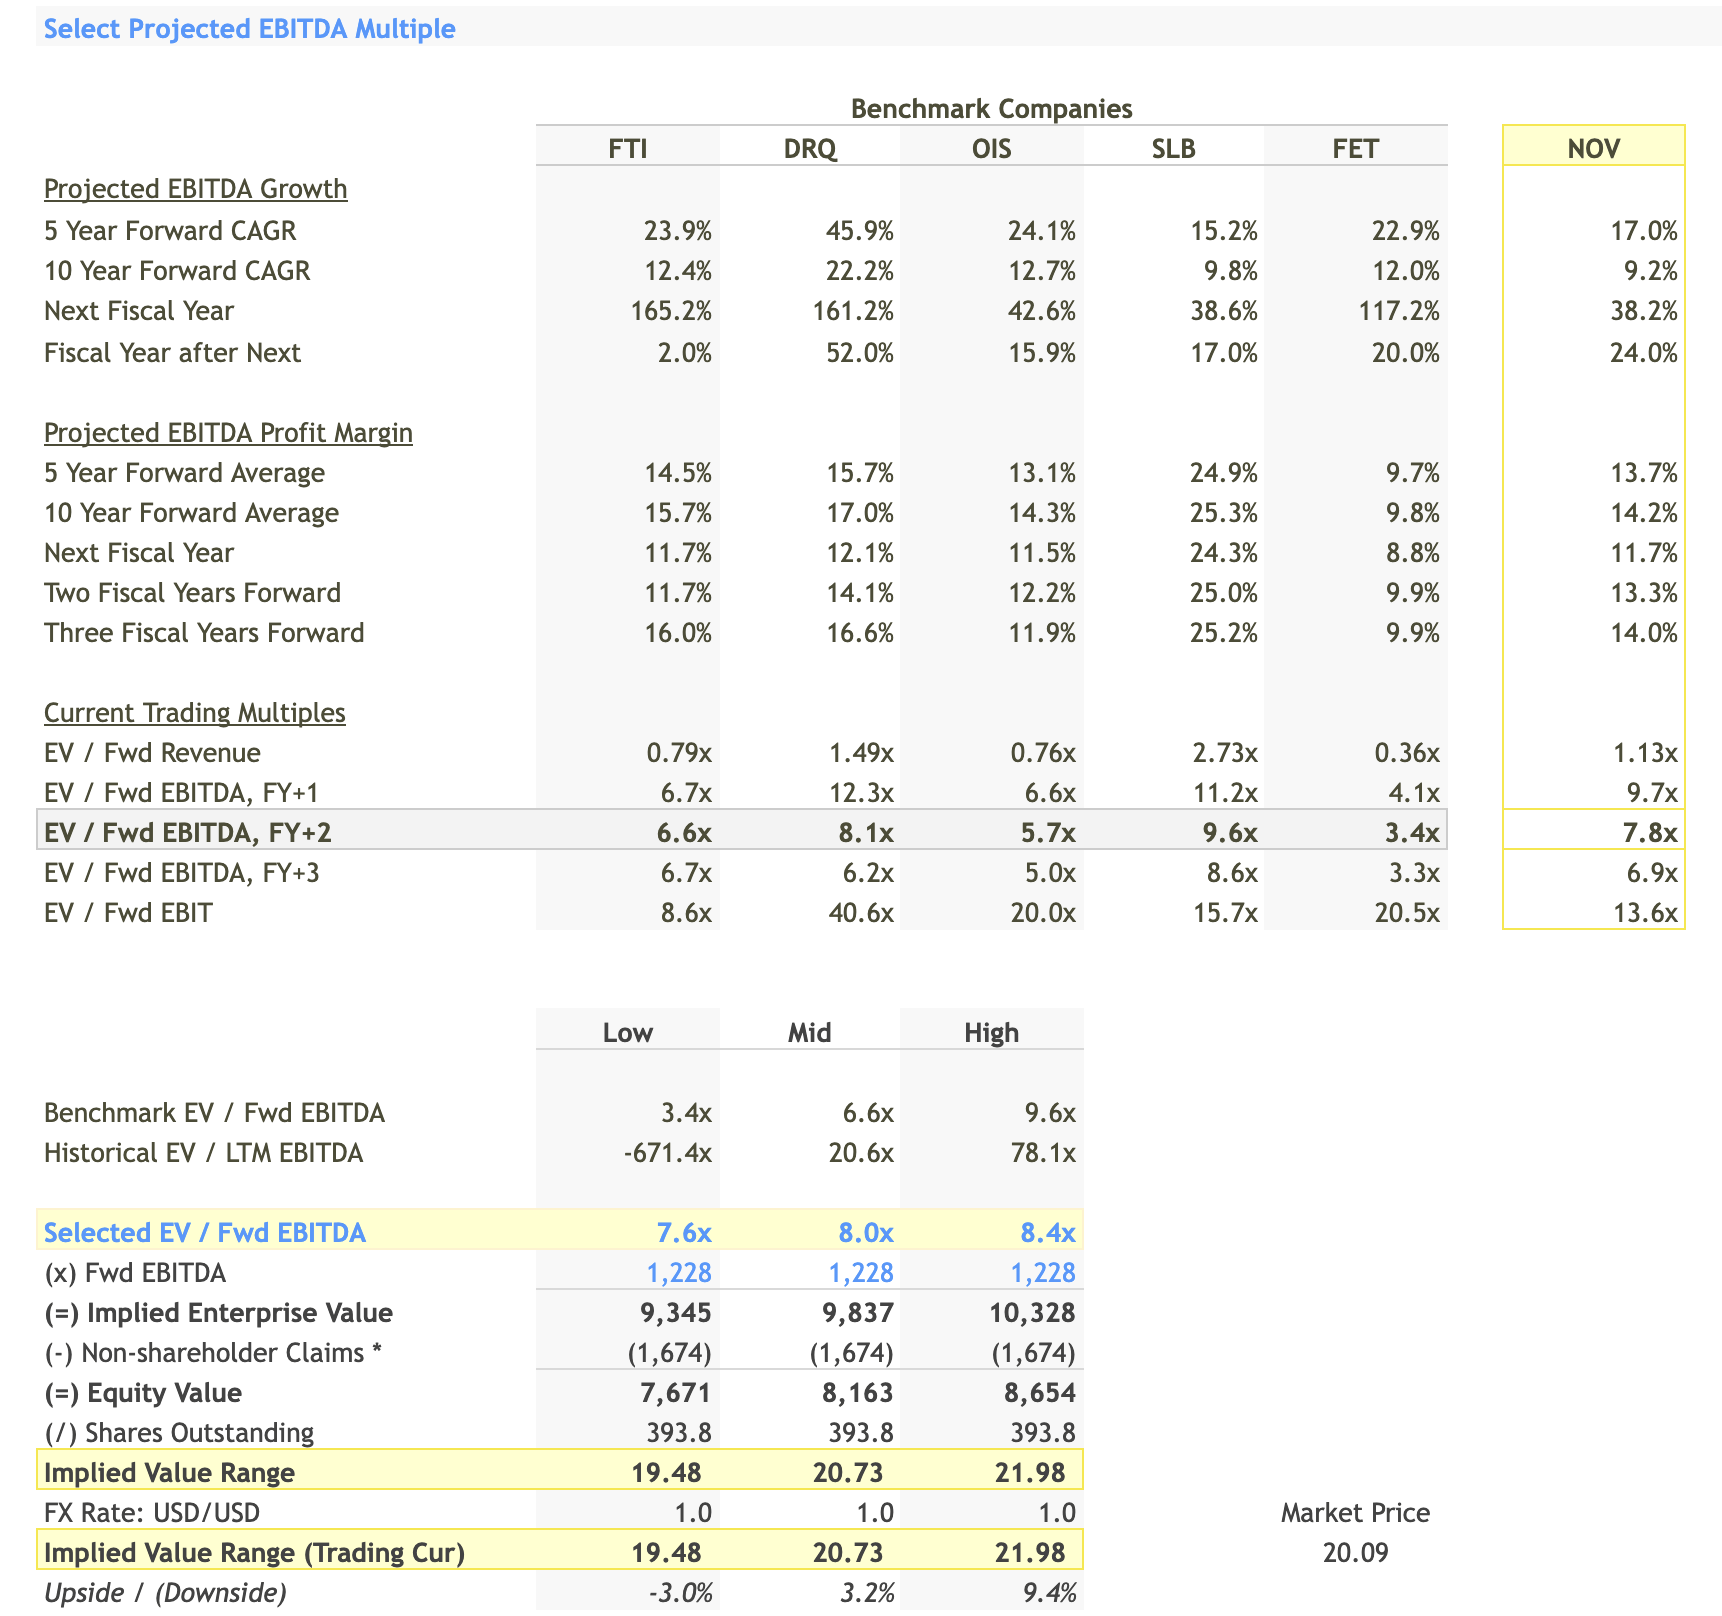
For projected EBITDA, the selected multiple range is 7.6x to 8.4x. This is backed by the projected 5-year CAGR EBITDA growth for NOV at 17.0%, which is in line with the industry benchmarks. The forward EBITDA is $1,228 million. This metric is crucial to watch as the September quarter results get announced on October 26th, 2023. Applying these multiples, the implied enterprise value for NOV ranges between $9,345 million to $10,328 million. The subsequent implied stock price ranges from $19.48 to $21.98. The projected EBITDA multiples are a bit lower than the LTM EBITDA multiples, which could indicate lower expectations for future growth or a higher risk profile.
Fair Value Range
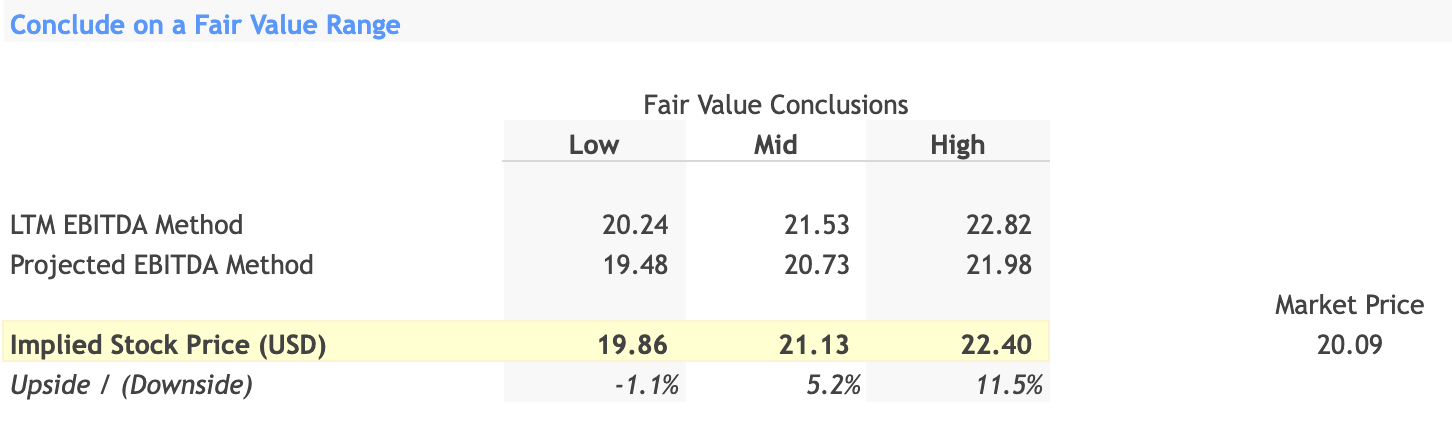
Both the LTM EBITDA and projected EBITDA methods give us a fair value range for NOV's stock. The LTM EBITDA method gives us a range of $20.24 to $22.82, while the projected EBITDA method provides a range of $19.48 to $21.98. Averaging these out, the overall implied stock price is between $19.86 and $22.40.
Conclusion: Investment Decision
Based on the analysis above, the investment decision is a 'Hold.' The current market price for NOV is $20.09, which falls within the calculated fair value range. The downside risk is minimal (-1.1%), while the upside is not overwhelmingly compelling (11.5%). In this situation, neither buying more shares nor selling your existing shares would offer a significant advantage, making 'Hold' the most sensible decision.
The key takeaways are that the stock is fairly valued and that the EBITDA multiples, both LTM and projected, substantiate this valuation.
For further details see:
NOV: A Balanced Approach For Long-Term Investors