RNRG - Now Is The Time To Deploy Your Cash
2023-11-25 08:10:00 ET
Summary
- Cash levels in money market funds have surged over the past year despite the S&P 500's strong performance, indicating investors' conservative approach.
- As interest rates decrease, rate-sensitive sectors such as real estate, utilities, and renewable energy should enjoy a relief rally.
- Now is the time to deploy investable cash into dividend stocks in these rate-sensitive sectors, as they are likely to produce rising income streams while money markets see falling payouts.
I understand the appeal of hoarding cash in virtually risk-free, 5%+ yielding money market funds.
Really, I do.
It feels safe. It feels like a shield from the many economic and geopolitical risks present in today's environment.
But some investors have overdone it on their cash position, becoming too conservative with the degree to which they are hiding in cash.
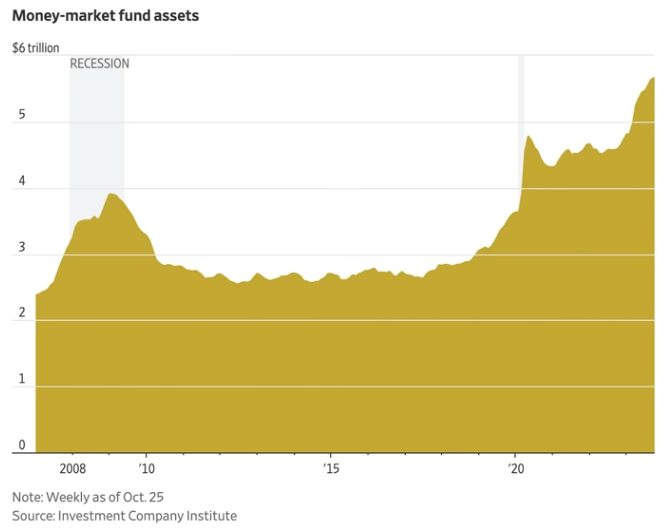
Over the last year, assets in money market funds have soared over 20%, from around $4.5 trillion last year to $5.5 trillion now.
The interesting thing is that this is during a 12-month period when the S&P 500 ( SPY ) is up over 15%!
Normally, during spikes in cash holdings, stock prices are crashing as investors pull money from stocks to hide out in cash.
This time, it appears that investors have pulled money out of a handful of specific sectors such as real estate ( VNQ ), utilities ( XLU ), renewable power producers ( RNRG ), and green energy companies ( ICLN ) while piling into the Magnificent 7 mega-caps ( MAGS ) and cash.
Decide for yourself how much a hunch is worth, but my own hunch is that this trend will reverse in 2024.
As interest rates recede, the rate-sensitive sectors that have been pummeled since the beginning of 2022 should see a nice relief rally. Cash levels should decline as FOMO ("fear of missing out") takes over again. And, finally, I'm guessing that the Magnificent 7 either decline or stay rangebound.
Don't get me wrong. These seven companies are truly magnificent, but at an average P/E ratio of about 35x, how much of that magnificence is already priced in?
Now is the time to deploy your investable cash.
(I say "investable" cash because, as I explained last week in " How To Live Off Dividends Forever ," I'm all for maintaining a situationally appropriate cash savings fund.)
If you wait too long, the Federal Reserve will eventually lower the Fed Funds Rate ("FFR"), immediately reducing the yield on your money market cash, while rate-sensitive dividend stocks will most likely rally from their current level, as they have already begun to do.
We all know that successful long-term investing is about delayed gratification. This is an example of that. Even if you are giving up a slightly higher yield in your money market fund to buy dividend stocks, it is still a good trade.
If you pick your dividend stocks well, you would be selling an asset that is highly likely to produce a falling income stream (money market fund) to buy assets that are likely to produce rising income streams (quality, dividend-paying companies).
Below, I'll highlight some of the high-quality but rate-sensitive dividend stocks that I'm buying. But first, if you would indulge me, I'll provide a brief update on the macroeconomic backdrop.
The Deflating "Higher For Longer" Narrative
How quickly the narrative changed from "higher for longer" to "how soon will the Fed cut?"
The truth is, as I've argued many times, that the Fed's aggressive monetary tightening regime was always likely to result in a recession or crisis of some sort. That's the historical pattern.
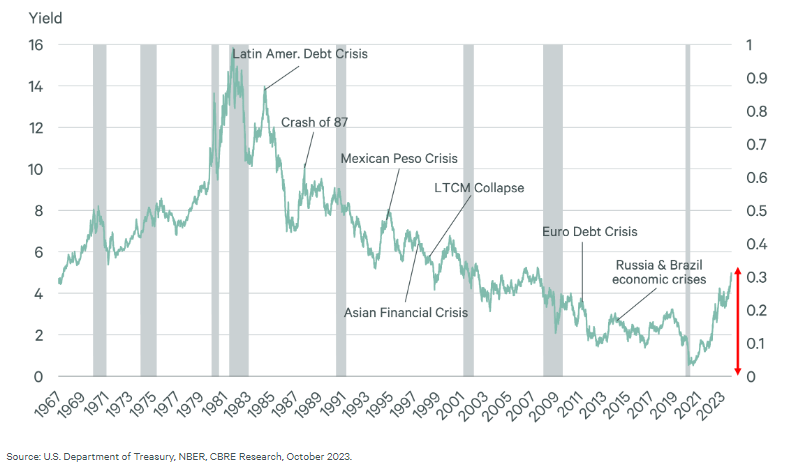
This chart only shows the non-US crises that have coincided with peaks in interest rates, but much the same data could be cited about US crises.
- The Savings & Loan Crisis began amid peak rates in the early 1980s.
- The sudden market crash in October 1987 occurred after a sharp run-up in rates.
- The Dot Com bubble burst after a more than 50% increase in the 10-year Treasury yield in the late 1990s.
- The housing market crash of 2008 intensified as interest rates ratcheted higher.
- A brazenly hawkish Fed triggered a market crash in late 2018.
Thinking that this time is different feels dangerous, to say the least.
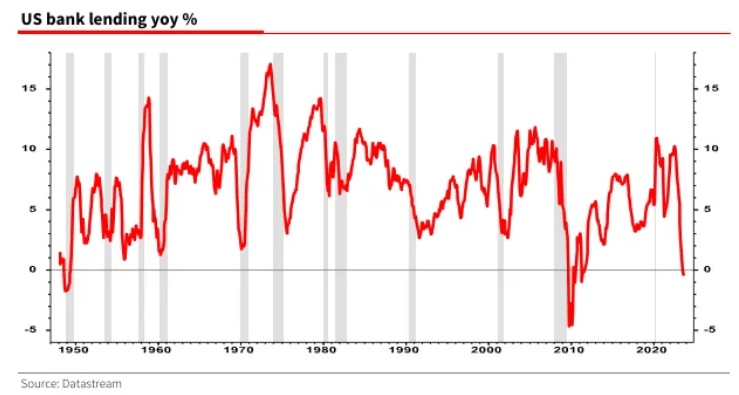
One area this sharp increase in interest rates is being felt is in the banking sector. Some pundits think that the modern economy runs on credit expansion. If that is the case, then the US is already in recession, because bank lending is in contraction.
Notice how few periods of actual contraction there are in bank lending: only the Great Financial Crisis and the late 1940s.
You could argue that banks are becoming less important as non-bank lenders take share of the credit market. Fair enough. But banks are still an integral part of the economy, and bank loan contraction is still meaningful.
And then, of course, there's inflation, which, as I've explained many times, is being artificially held up by lagging shelter data. Excluding shelter, YoY CPI would have been 1.5%, the fifth straight month under 2%.
My argument has long been that we are not in a new, secular inflation environment. Rather, the massive fiscal stimulus of 2020 and 2021 caused a one-time surge in inflation and economic growth. It's a pig in a python, not a hockey stick.
Just as mightily as the tidal wave comes, so also does it mightily recede.
That's what's happening today.
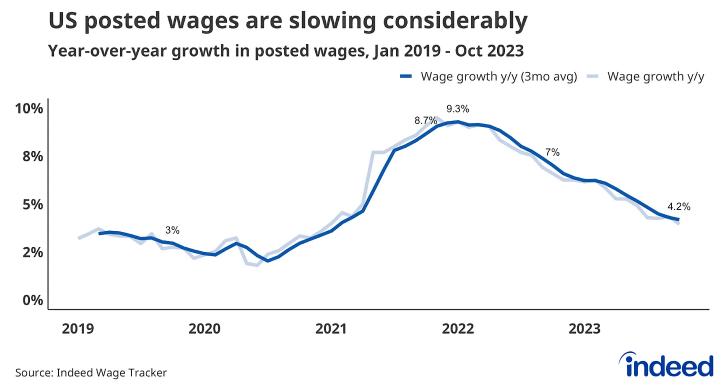
You can see it also in wage growth: a big bump-up in 2021 and 2022, coinciding with real-time inflation, followed by a long, downward slide to today.
Fears of a wage-price spiral taking off because of a sustained labor shortage have been totally overblown.
Today, real (inflation-adjusted) average hourly wages are growing at a crawling pace -- the lower end of the range seen in the 2010s.
In fact, since the beginning of 2020, real average hourly wages have increased less than 1% in total!
Inflation and wage growth have been roughly the same over the last four years.
I repeat: There is no wage-price spiral.
People persistently look for the origins of inflation in the wrong places. It's not caused by labor or wage growth, at least not primarily.
It primarily comes from surges in the money supply from fiscal stimulus.
Interestingly, the same thing happened in the 1970s: a big surge of money growth in the early '70s, followed by a spike in inflation in the mid '70s, followed by another surge in money in '76 and '77, leading in turn to yet another spike in inflation in the late '70s.
I'm not saying that there weren't other issues at play back then. There were. Demographics and peculiarities in the oil market played a role in raising the base level of inflation, as supply couldn't keep up with demand.
But the big surges in inflation are strongly correlated with preceding surges in the money supply.
Today, the waters of the COVID-19 stimulus have receded, leading to an environment of weakening demand and falling inflation.
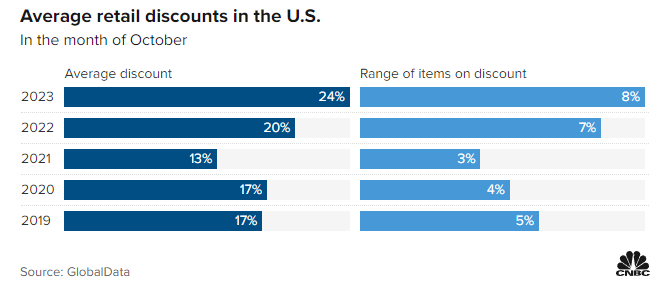
Hence we hear reports from retailers predicting weak holiday sales this year. In October, retail discounts were deeper and more widespread than at any time in the last five years.
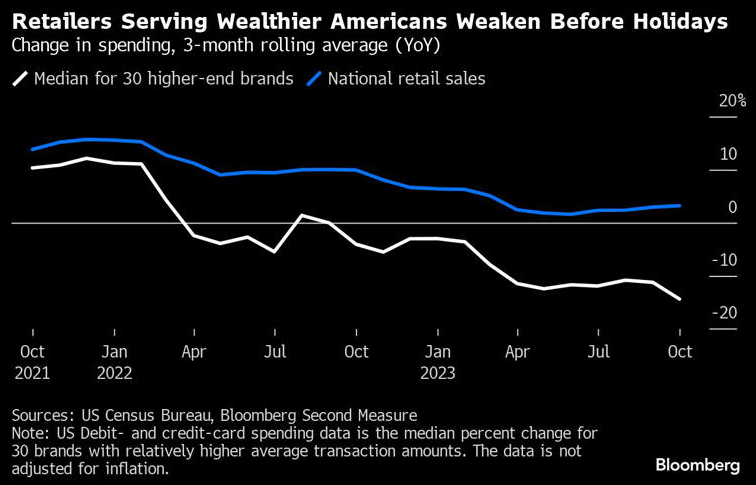
Interestingly, this weakness is not confined to lower-income Americans. Upper middle-class households are pulling back on spending as well.
Luxury brands have been suffering double-digit declines in sales since the early summer months.
That isn't because of weakness in the labor market or wages. It's simply because all of that sweet, COVID-era stimmy money has been spent already.
Consumers have been steadily running out of their COVID-era excess savings all year. First, it was the lower-income folks, then the middle-income households, and now finally the upper middle-class consumers are reining it in.
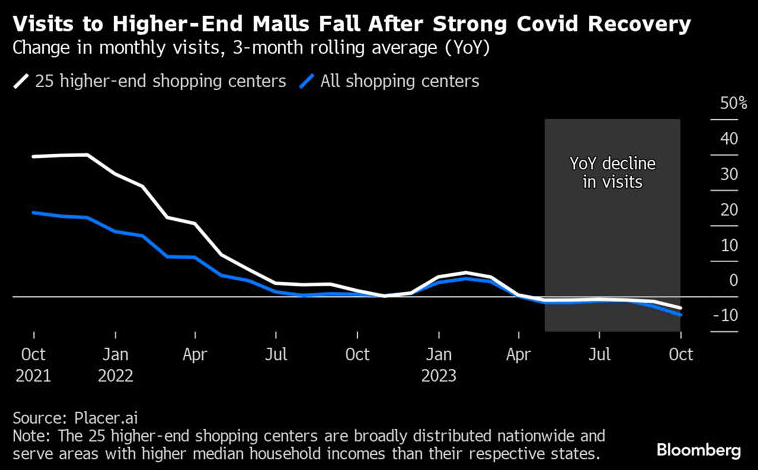
For the first time since the pandemic, foot traffic at high-end malls has turned negative.
Could this portend any weakness at Class A mall landlord Simon Property Group ( SPG )? Probably not on a fundamental basis, as SPG's tenants typically have multi-year leases. But if sustained, this softness could eventually lead to vacancies and declines in variable rents from revenue-sharing agreements.
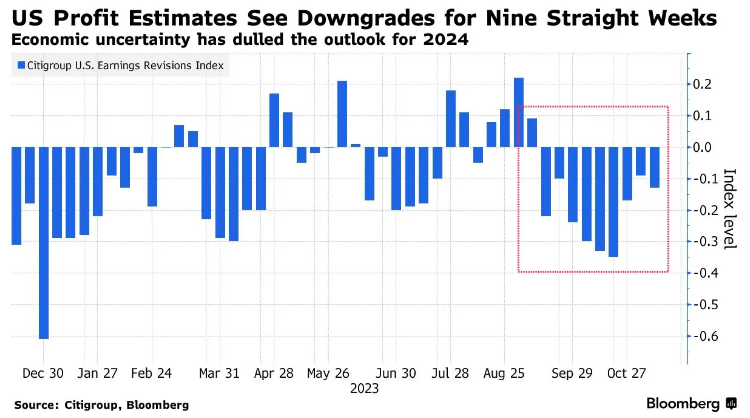
Amid this environment of a weakening consumer, we've seen public stock earnings estimates for 2024 revised downward for nine consecutive weeks.
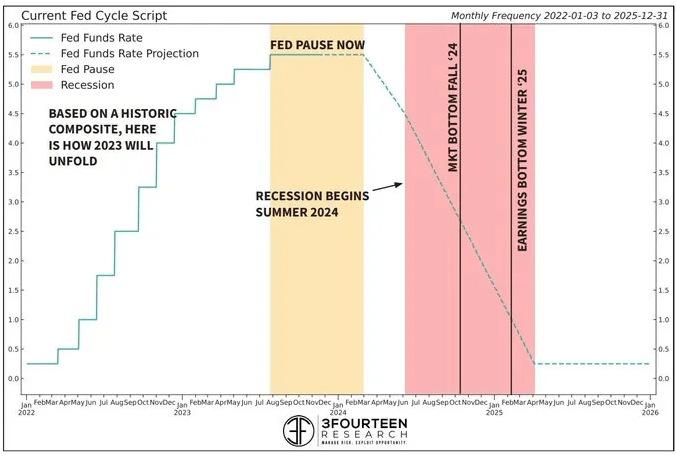
If the current cycle plays out like the average historical cycle, then the first Fed rate cut should come sometime in the mid-Spring months (just as the futures markets are now pricing in), and then the recession will begin shortly thereafter.
By the end of 2024, according to this forecast based on a composite of previous cycles, the FFR should drop to about 1.5% from its current range of 5.25% to 5.5%.
This forecast strikes me as probable, because in previous cycles, the Fed typically began to cut the Fed Funds Rate a few months before the official start of the recession.
The Last Shall Be First
Of course, anything could happen. No one has a crystal ball. Maybe my forecast for a recession and Fed rate cuts in 2024 will prove wrong.
But investing is about probabilities, not predictions. It's about allocating your scarce capital in such a way that the odds of success are in your favor.
Rather than the "higher for longer" outlook that was popular a month ago, I believe the most probable outcome is recession and rate cuts.
I'm stacking my chips accordingly.
How does one stack their chips for such a scenario?
Personally, rather than chase the crowd into a handful of richly valued (though admittedly high-quality) mega-caps, I am allocating my scarce capital toward higher quality names in the rate-sensitive sectors that have been hit hardest over the last year:
- REITs
- Utilities
- Renewables
As shown by one of the charts in the introduction, these sectors have severely underperformed the SPY and especially the Magnificent 7 this year.
In the realm of REITdom, several high-quality REITs remain incredibly attractive. I highlighted 8 of them recently in " Buy REITs Before Everyone Else Does ."
From that list, consider just a handful.
- Agree Realty ( ADC ) owns single-tenant net lease properties leased to the strongest, most recession-resistant retailers in the nation. Its largest tenant industry is grocery stores, and its largest single tenant is Walmart ( WMT ). And ADC's low-leveraged balance sheet has almost no debt maturities until 2028! At a price to AFFO of 14.4x, ADC has about 35% upside to its 5-year average AFFO multiple of 19.5x. By price to operating cash flow, ADC is near its cheapest level of the last decade.
- Alexandria Real Estate Equities ( ARE ) owns and develops Class A life science campuses in top-tier locations, typically adjacent to world-class research universities like MIT, Duke, and UCSF. The REIT also enjoys a low-leveraged balance sheet with no debt maturities until 2025 and a 13-year weighted average debt maturity. Worries about oversupply are overblown, especially as it relates to ARE's top-tier locations. By both price to operating cash flow and AFFO, ARE hasn't been this cheap since the Great Financial Crisis of 2008-2009.
- Mid-America Apartment Communities ( MAA ) owns and develops Class A and B apartments exclusively in the Sunbelt region. The market is worried about oversupply, but supply headwinds will be temporary. Above-average job and population growth in the Sunbelt will endure. MAA's net debt to EBITDA of 3.4x is best-in-class, leaving plenty of balance sheet capacity for opportunistic acquisitions. MAA has touched this low of a valuation only once, briefly, since the GFC.
I am also building positions in two of my favorite utility stocks, American Electric Power ( AEP ) and NextEra Energy Inc. ( NEE ) .
AEP has a commanding market position in transmission and distribution (power lines) as well as aggressive plans to expand its asset base in this area. I explained this in a recent article . The downside is that this expansion plan is capital-intensive, and regulated returns only account for higher interest rates with a lag. Management plans to reduce debt to FFO over the next year, which means capital spending will be funded largely with equity issuance.
The market never likes this, but management's obligation is always to use the lowest-cost form of capital to fund growth. That's exactly what they're doing. If and when interest rates come down, that may change.
NEE has also been wounded recently by the collapse in stock price of its publicly traded subsidiary and YieldCo, NextEra Energy Partners ( NEP ). The market seems to think NEE has no other outlet to fund growth than NEP, but that is incorrect. It can utilize project-level debt and tax equity financing, at least until things are sorted out with NEP.
There's still a long runway for the growth of renewables, and NEE is a market leader in this arena.
And speaking of renewables, there are some phenomenal deals still to be had among renewable power producers and the financiers that facilitate their investments.
Here are my favorites of each:
- Clearway Energy Inc. ( CWEN , CWEN.A ) owns stabilized renewable power assets, acting as the long-term destination for projects developed by its parent/sponsor, Clearway Energy Group. The latter is owned 50/50 by Global Infrastructure Partners and TotalEnergies ( TTE ). CWEN does carry a decent amount of debt, but most of it is project-level financing that fully amortizes before the end of each respective power purchase agreement. The rest of the debt is unsecured, corporate level notes, the first of which doesn't mature until 2028. CWEN hasn't been this cheap since 2019, which means that today's buyers get the benefits of the Inflation Reduction Act for free!
- Hannon Armstrong Sustainable Infrastructure ( HASI ) mainly acts as a financier of green energy and sustainable infrastructure projects. Clearway is one of its partners. The management team is both skilled and passionate about the cause of decarbonization (not to mention heavily invested in the stock themselves), and delinquencies have been ultra-low for the company's entire history. HASI's earnings are a little tricky to measure, but according to the company's own non-GAAP EPS metric, it remains near its cheapest level in over 5 years.
Bottom Line
If you are an income-oriented investor, I think now is the time to deploy investable cash into dividend stocks. And I think the best place to invest money right now is in the sectors that suffered the worst performance over the last year.
My hunch is that, to quote the famous financial advisor Jesus Christ, "the last shall be first, and the first shall be last." That is, the last (of this year) will be first (next year), and the first (of this year) will be last (next year). That is, beaten down, rate-sensitive dividend stocks will enjoy some time in the sun again while high-flying mega-caps will take some time to absorb their lofty valuations.
Maybe.
Or maybe the Magnificent 7 will continue their reign while the market rally broadens out to include the rate-sensitive dividend stocks.
Truthfully, I don't know.
But I would argue that income investors who deploy their cash into quality dividend stocks right now will ultimately be glad they did.
For further details see:
Now Is The Time To Deploy Your Cash