NUS - Nu Skin: Is It Just A Growth Problem?
2023-10-17 01:41:56 ET
Summary
- Nu Skin's revenue growth has been stagnant over the past decade, and growth has been negative in recent years.
- NUS's multilevel marketing business model comes with high operating costs and lower profit margins compared to competitors like Ulta Beauty which have adopted the traditional retail store model.
- A high dividend yield and a low PE are not enough to compensate for the uncertainty regarding future growth.
- The negative stock performance over the last decade has left investors with negative returns even when the dividend is accounted for.
Not Keeping Up
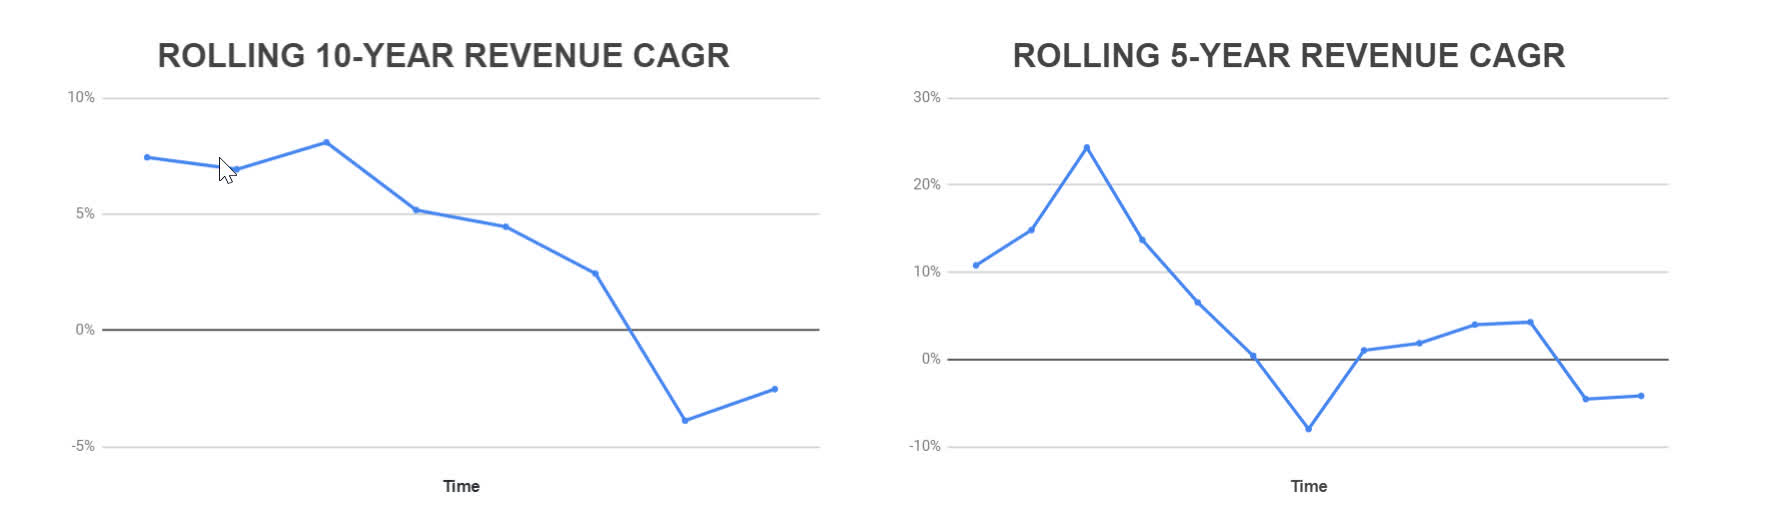
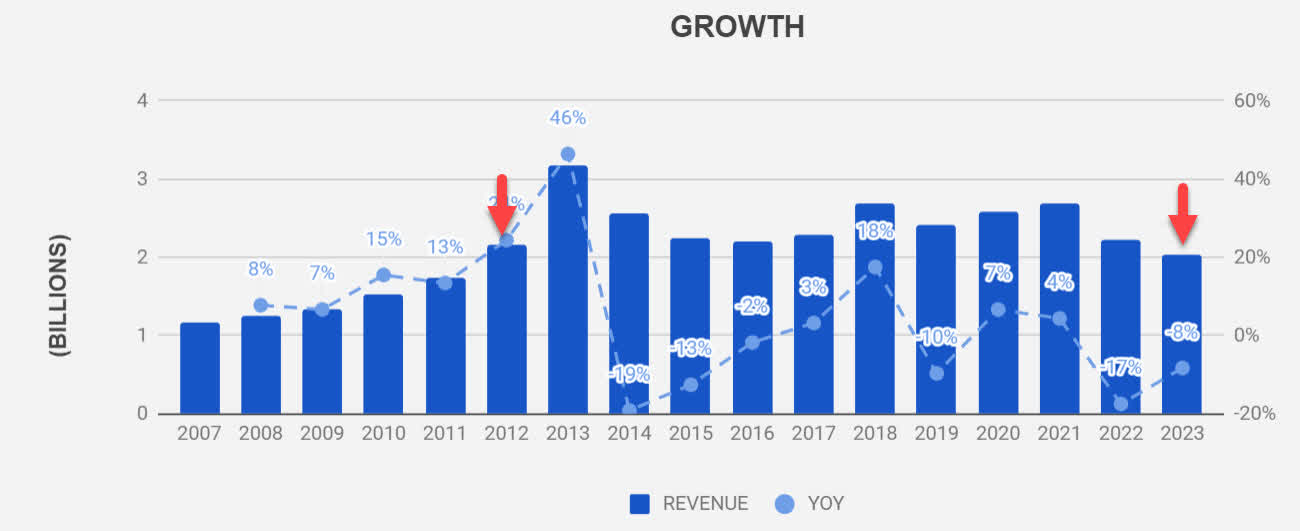
I recently wrote on Ulta Beauty ( ULTA ) and one of the takeaway ideas that I emphasized was that beauty products are not cyclical. According to Statista , since 2004, the cosmetics market has grown 4% annually or thereabouts. The odd years where the rule was broken were the expected ones: 2008, 2009, and 2020. From those expected dips, negative growth only really took place in 2020. ULTA has smashed that market trend though, and one could be led to believe that other companies shared the same success. Not Nu Skin ( NUS ). Over the last decade, with a revenue CAGR of 0.02%, Nu Skin has not gone anywhere. If we look at the rolling revenue CAGR for the last 10 and 5-year periods, the picture is pretty clear: right now, growth is in negative territory (Figure 1). To make it even clear, TTM revenue is at the same level of 2012 as shown in Figure 2.
Figure 1: Nu Skin - Rolling Revenue CAGR (Author) Figure 2: Nu Skin Revenue (Author)
With a price-to-earnings ratio of 13.65 based on TTM revenue and a dividend yield of 8%, is NUS a value opportunity, or a value trap instead?
Problem 1: The Business Model
Unlike Ulta Beauty, Nu Skin has no retail stores. In their words, they "operate in the direct selling channel, primarily utilizing person-to-person marketing". To call it what it really is, it's multilevel marketing. Stepping back just to the previous sentence, I lied. China is an exception. Because the company has gotten in trouble with the Chinese government, they cannot implement the multilevel strategy and they do have retail stores there. Since China is responsible for 16% of its revenue, I will run with the fact that the model is indeed multi-level.
Regardless of what I think of this type of business, what do the numbers say? If we choose to believe the company, this is an effective strategy, but the numbers seem to show a different reality.
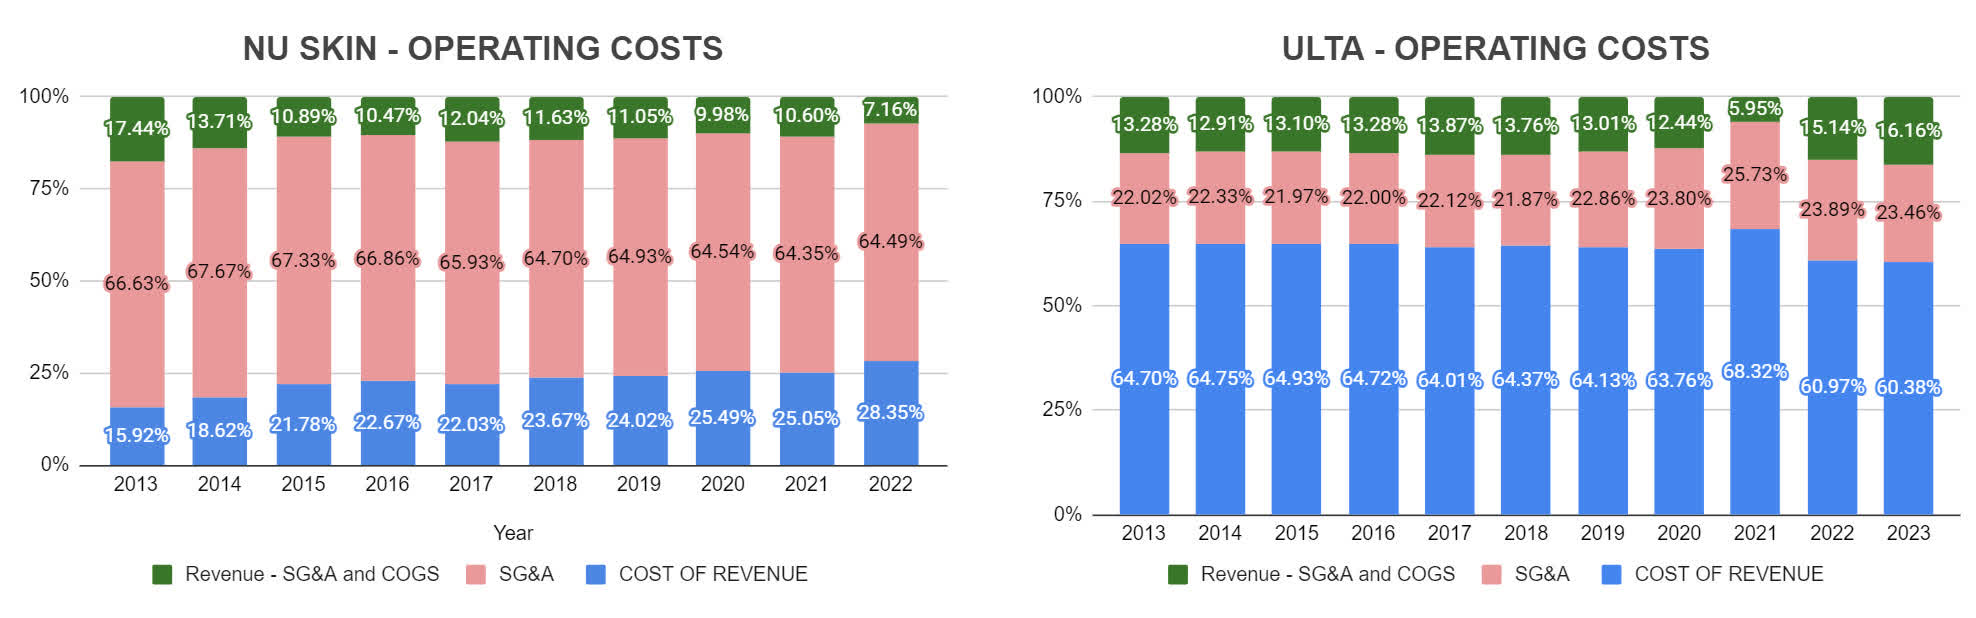
One way I decided to look at this was by analyzing the operating costs of Nu Skin and Ulta. Two things stand out immediately. The multi-level model comes with a lower cost of revenue but requires much higher SG&A expenses, which makes sense given the much larger "workforce". The main takeaway though is what is left after the two main operating costs: only an average of 11.4% of revenue for Nu Skin whereas Ulta is left with 13.6% (Figure 3). The contrast is even starker if we look at the last reported figures: operating costs are 92.8% of revenue for Nu Skin and 83.8% of revenue for Ulta. One company has clearly more maneuvering room after the first level of costs is accounted for.
Figure 3: NUS and ULTA Operating Costs (Author)
And this does not tell the whole story. Ulta is solely dedicated to selling beauty products, and for that reason, does not claim any research and development costs in its financial reports. Nu Skin, however, claims in-house research and development for its wellness products but does not break down what those costs actually are. These costs should also eat away at profitability.
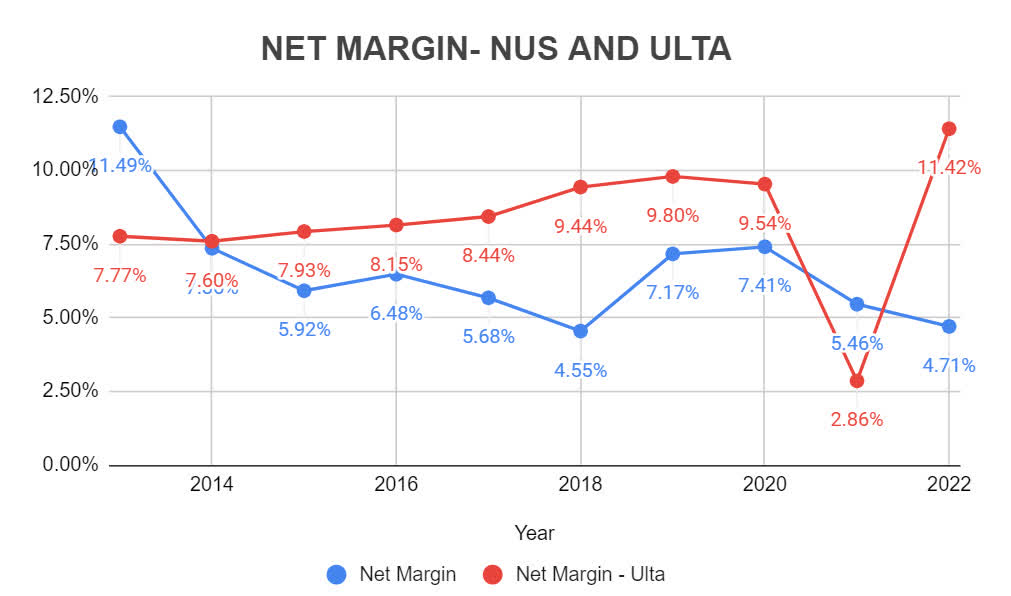
The maneuvering room I mentioned above should translate to margins, and we can clearly see that it does in Figure 4. Ulta has been improving its net margin over the last decade whereas Nu Skin has seen fluctuating profit margins that are nevertheless lower.
Figure 4: Net Margin: NUS and ULTA (Author)
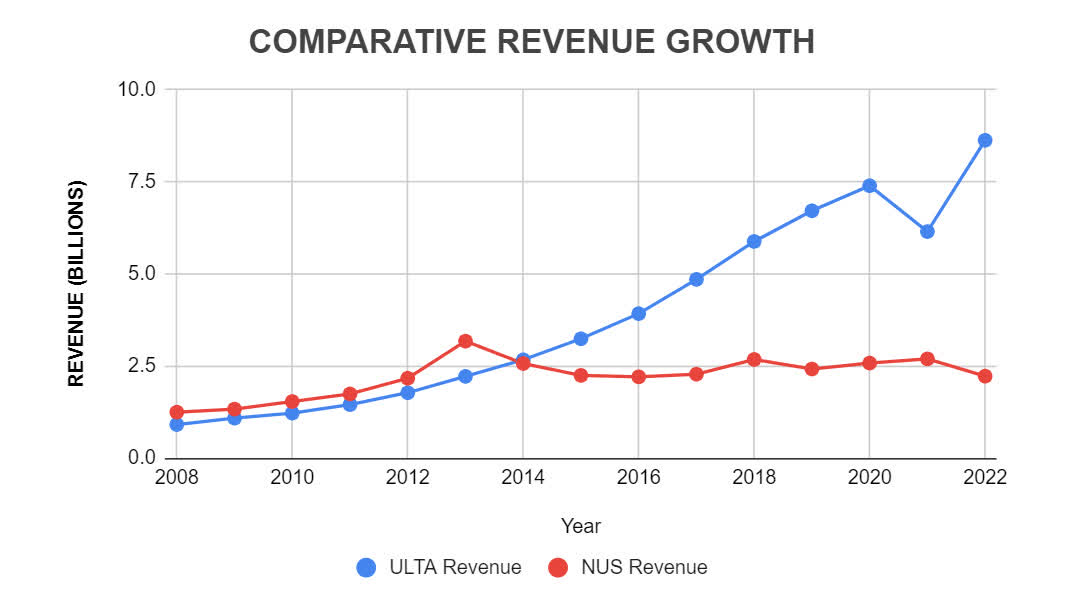
Another way we can analyze the effectiveness of the business model is through comparative growth. If we go back to 2008, Nu Skin had higher revenue than Ulta Beauty. That was true until 2014 when booth companies were on equal footing. Since then, there really isn't a comparison. An image is worth a thousand words and I will leave it at that (Figure 5).
Figure 5: Ulta and Nu Skin Comparative Growth (Author)
Finally, I cannot compare revenue per store because Nu Skin only owns retail stores in China. But I think we can measure revenue per employee to have a better apples-to-apples comparison. I am going to be generous and assume Nu Skin sales are 100% attributable to their "sales leaders". That is not true because in their 2022 financial report, they list the sales channels as 1) Direct-to-consumer, 2) Paid Affiliates, and 3) Sales Leaders. For 48,737 Sales Leaders in 2022 and revenue of $2.2 Billion, my generous assumption gives us a revenue per salesperson of $45 Thousand. Ulta Beauty, on the other hand, currently has about 53,000 employees and a TTM revenue of $10.2 Billion, which yields a revenue per employee of $192 Thousand.
The numbers are clear. One model is working, the other not so much. Although the company claims to be in the middle of a significant transformation, I am not sure if it is not a bit too late.
Problem 2: The Math
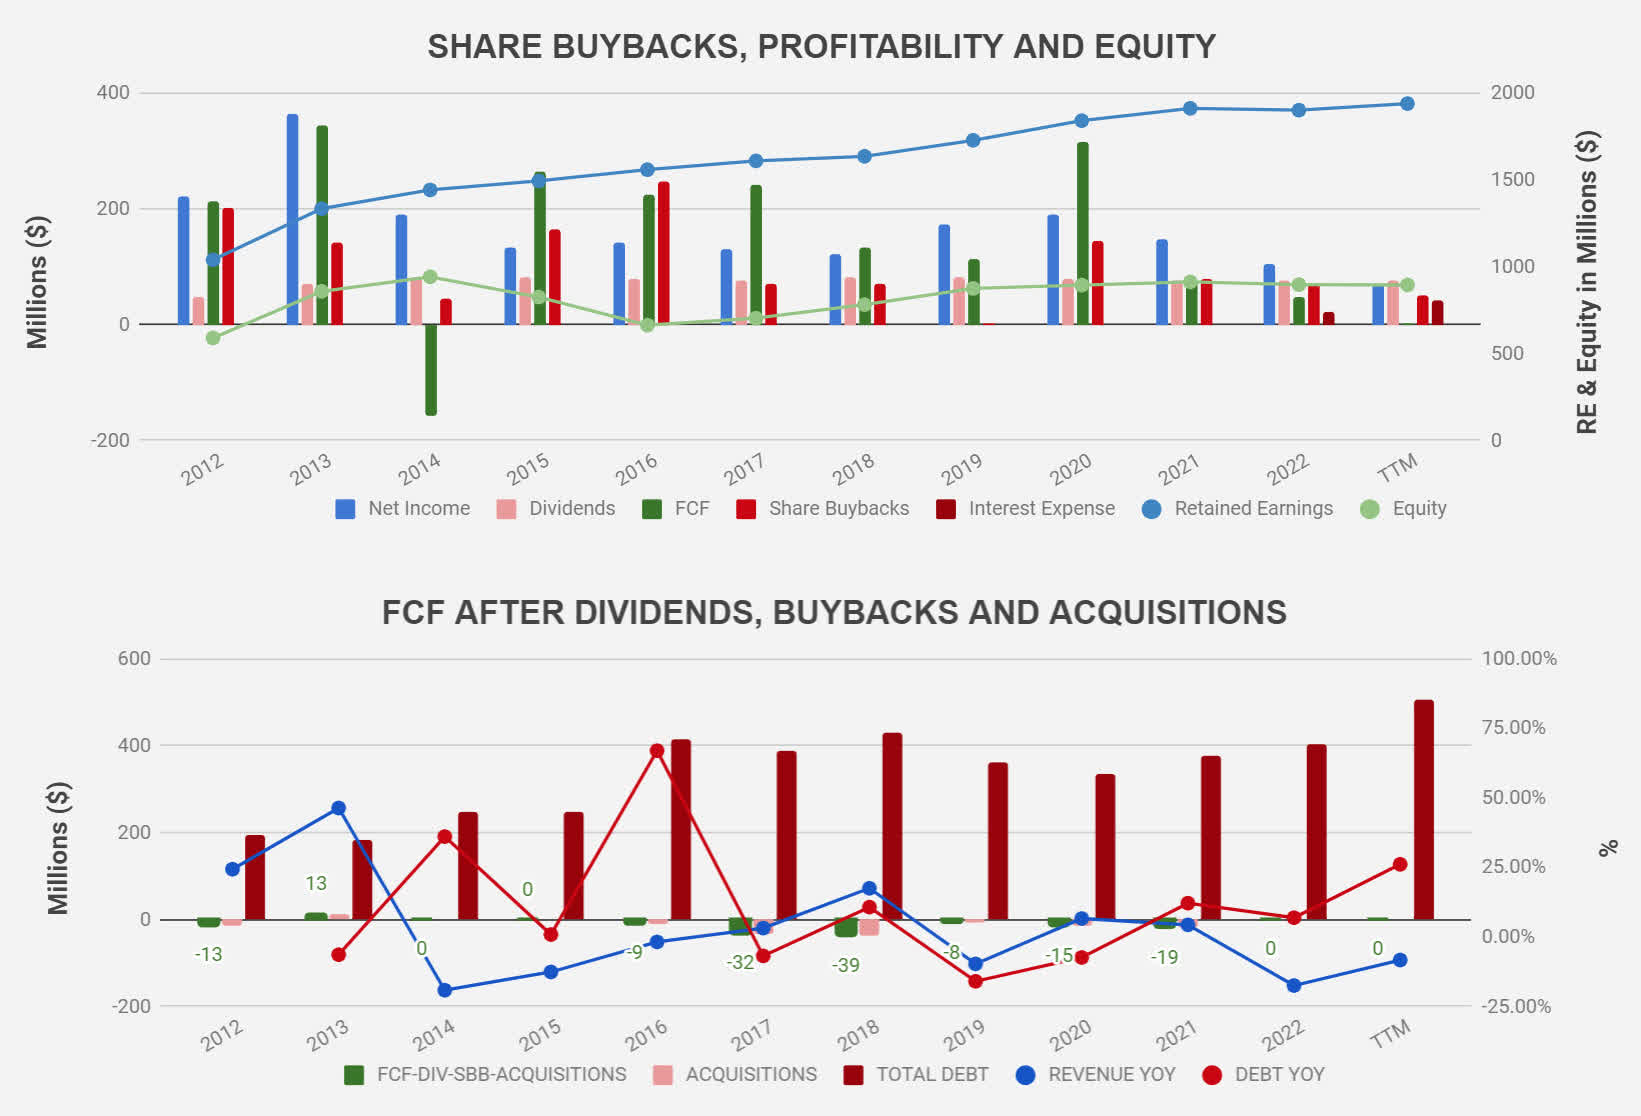
The 8% dividend and low PE ratio might make the company look attractive, but if problem 1 is not solved, the dividend might just be a trap. If we look all the way back to 2012, free cash flow only covered the dividends, share buybacks, and acquisitions in 2013. In all the remaining years, there was either no money left after dividends, buybacks, and acquisitions, or free cash flow was negative to account for those outflows. As a result, we would expect an uptick in debt. Although not alarming by any measure, we have in fact seen debt going up (Figure 6), but in spite of this trend, the debt level stands at roughly 2 times EBITDA, and the balance sheet is solid.
Figure 6: Free Cash Flow, Dividends, Buybacks and Debt (Author)
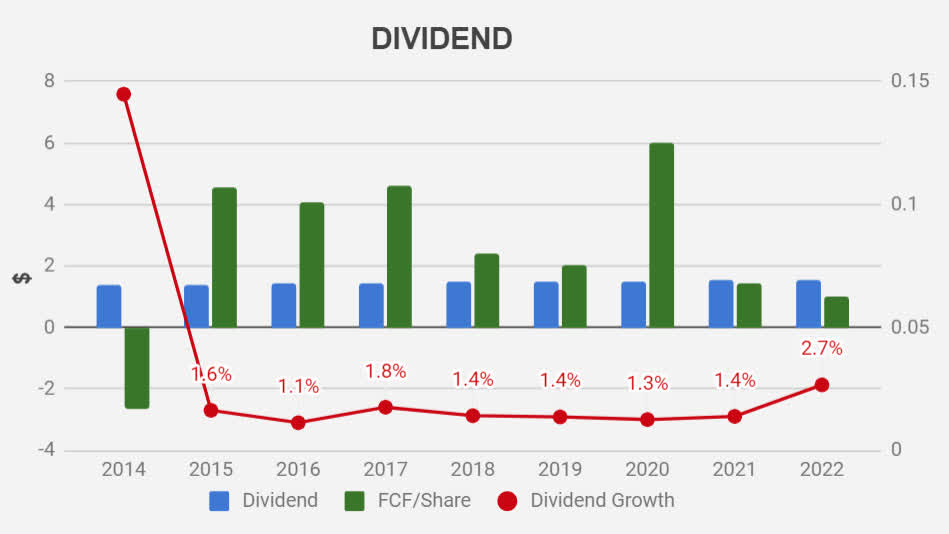
Back to the dividend, with such a high yield, I am hard-pressed to believe that there will be no significant growth on this front. The dividend growth has understandably been lackluster (Figure 7). In the best-case scenario, investors will keep the very generous yield, and hopefully, the stock performance will not erode investors' value as was the case over the last decade. I will pass an 8% dividend if the stock loses 12.8% per year, and I believe all sensible investors agree with that.
The current dividend payout ratio does not help ease any anxiety. With $0.04/share in FCF for the TTM and a current dividend of $1.56, I will let the readers do the math on this one because the number is just too scary. Free cash flow is often a bit more volatile than earnings, and to be fair, the 5-year average payout ratio is a "healthy" 47.3%. Calling it healthy is debatable though. Can we consider healthy giving away roughly half of the hard cash the business generates when the business grows revenue at less than 1% per year? Can the company do better than its investors with the cash it generates? It should probably try and investors should support that attempt.
Figure 7: Nu Skin Dividend (Author)
If an effort is truly made to invest in growth, I do not see the math working out without cutting or at the very least freezing the dividend increases, or without ballooning the debt. There is no free lunch. Ulta Beauty is the hare and Nu Skin risks being the tortoise that never catches up in this story if a solution is not found to bring back growth.
Problem 3: Litigation
Nu Skin is not new to clashes with regulatory agencies and the justice system. The company has recently settled a case with a dairy farmer in Utah in the wake of being denied a motion to dismiss the suit. This information can be found on page 41 of the company's latest 10k . In the 90s, Nu Skin was in the hot seat due to an investigation by the Federal Trade Commission on its multilevel marketing practices and claims about its products, which resulted in fines and changes imposed by the federal agency. Then, in 2014 it was China's turn to investigate the company's pyramid scheme practices, leading to a $47 Million settlement in addition to a $765 Thousand fine for a charitable donation made by its Chinese subsidiary that failed to include anti-corruption language.
The multilevel marketing model is fertile soil for litigation and that is in fact a risk included in the company's annual report. About 45% of its revenue is related to wellness products including nutritional supplements that lack any oversight or evaluation by the Food and Drug Administration (FDA). Nu Skin does include that disclaimer in the listings of these products on its website. The lack of regulatory evaluation, in conjunction with the direct sales approach, has the risk of leading to misunderstandings by potential customers with regard to the effectiveness of such products.
As an investor, I would like to see a bigger effort put into substantiating the benefits of the products the company develops. If the supplements/products truly are effective, wouldn't a stamp of approval by the regulators and third-party laboratories add value? Wouldn't the consumer be more trusting? Finally, I would like to see research and development expenses clearly disclosed in the financial reports. These changes would minimize the investment risk and I do not regard them as significantly difficult to implement. The fines the company has paid have not been significant, but as an investor, I also care about the reputation.
Is a Turnaround Possible?
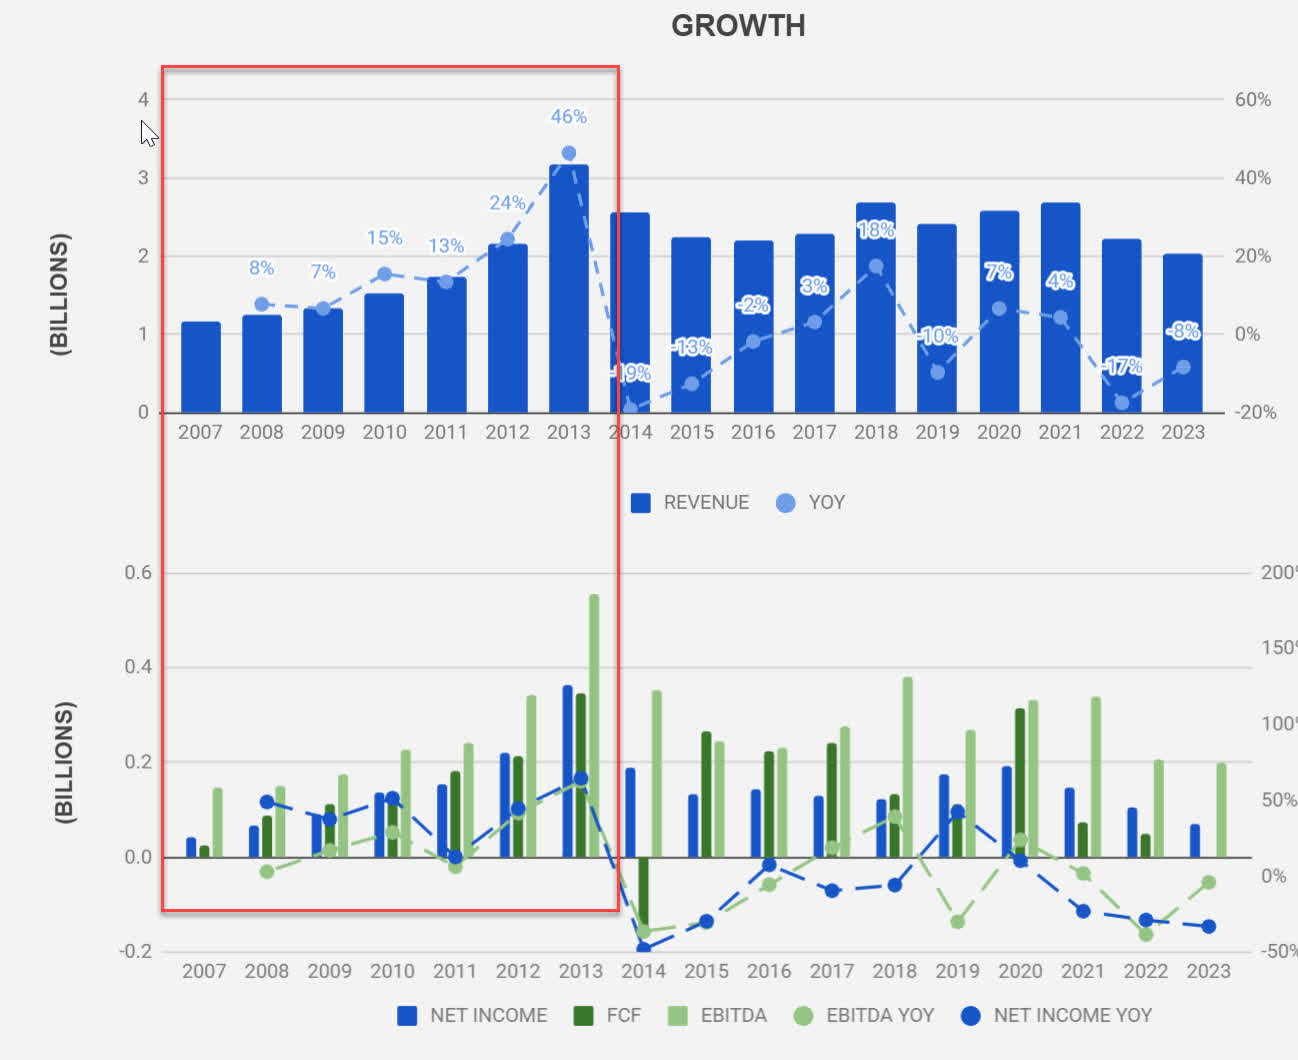
Every now and again I like to watch Peter Lynch asking "How much further can it go down". NUS has come down quite a lot. We need to go back to 2009 to see a lower stock price. Peter Lynch bought Kaiser at rock bottom and he knew what he was buying. Can we buy NUS and expect the same type of experience? The company has had very good years. The best of these were from 2007 to 2013 when revenue grew at high single to double digits. Not just revenue. Earnings and free cash flow were in lockstep. Then, between 2015 and 2020, top and bottom lines were more volatile, but the cash flows were still there. If the price is right, a company does not need to grow much as long as the cash flows are there to support the value. The company did lose the 2007 to 2013 formula. Whatever that was, it worked extremely well back then (Figure 8).
Is there a chance it can happen again? I do not have a crystal ball, but it might very well be possible. The company's balance sheet is strong. Nu Skin still has the ability to generate good earnings and free cash flows, although not as consistently. The debt is nothing to worry about. Some of the good ingredients are there. If the company is able to boost its branding and capture the consumers in an effective way, then those ingredients I mentioned might just be a great bargain at the moment. This is what the company seems to be aiming for with its NU Vision 2025 strategy. However, to be honest, I do not find the letter to the shareholders very inspiring. It insists on more of the same business model and throws the AI jargon in the mix just like every other company does. I think multilevel marketing is a tired business model. Tupperware and Herbalife come to mind when I think of this strategy and those are not model companies I think Nu Skin should be looking at.
"How much further can it go down?" If Nu Skin finds the right connection with the consumer, just like Ulta Beauty did, it might not go down much further or at all. Part of me wants to believe that will happen, in which case I would be missing out by not buying the stock now.
Price and Value
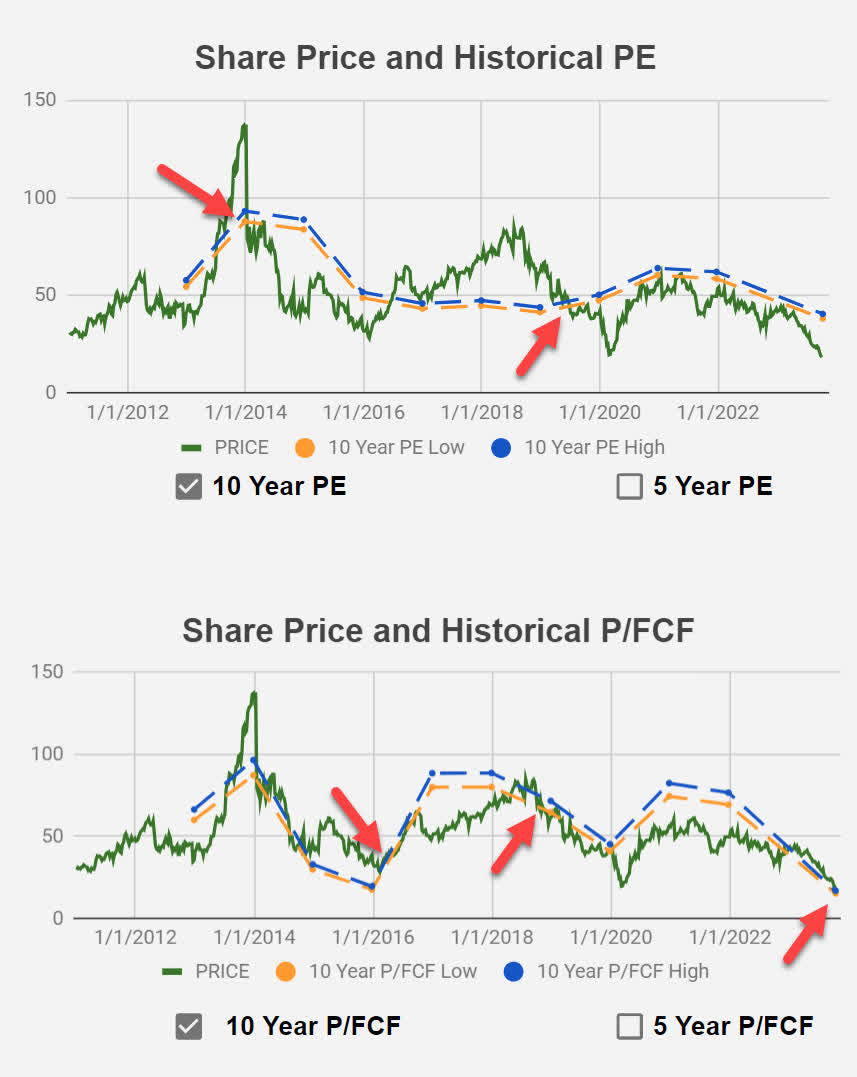
Putting a fair value on NUS is hard. Although the beauty industry is expected to grow in the coming years ( 6% per year up to 2027 as I pointed out in my Ulta Beauty article), recent history makes me skeptical that the company will even keep up with that. One way I like to look at the price of a given stock is by comparing the actual historical price with what the theoretical price would be based on the company's characteristic multiple (PE or Price/FCF). The theoretical price is actually a price range. I find the confidence interval for each multiple (PE and Price/FCF) based on weekly closing prices over the last 10 years and the respective earnings and FCF for each fiscal year. This gives me a large enough sample to allow this type of analysis. Then, I use the lower and upper end of such intervals (the characteristic multiple of the company) to get the low and high theoretical prices where the company would trade if the characteristic multiples were "true". I do this by taking the average earnings over the last 2 or 3 years and multiplying the result by the characteristic multiple.
Looking at Figure 9, we see that the actual price (green line) dipped below the theoretical range for the last time (orange and blue lines) at the end of June 2019 and has not recovered since. This would indicate that the company is currently below the "fair" value of $38.2 to $40.50. The 95% confidence interval for the PE ratio over the last decade is 17.78 to 18.86. TTM PE is 16.66.
Free cash flow has been more erratic over the years and the theoretical price bounces a lot more. Using this analysis, the stock price has fallen below the theoretical range also at the end of June 2019, and, if we were to take the average FCF over the last 3 years, the current theoretical value would be somewhere between $15.20 and $16.90. Therefore, from a FCF perspective, given the recent FCF numbers, the company is actually overvalued. The 95% confidence interval for Price/FCF over the last decade is between 18.48 and 20.45.
We get two very different fair values depending on whether we look at earnings or FCF. It seems to me that the stock price has caught up with the ability of the company to generate cash flows.
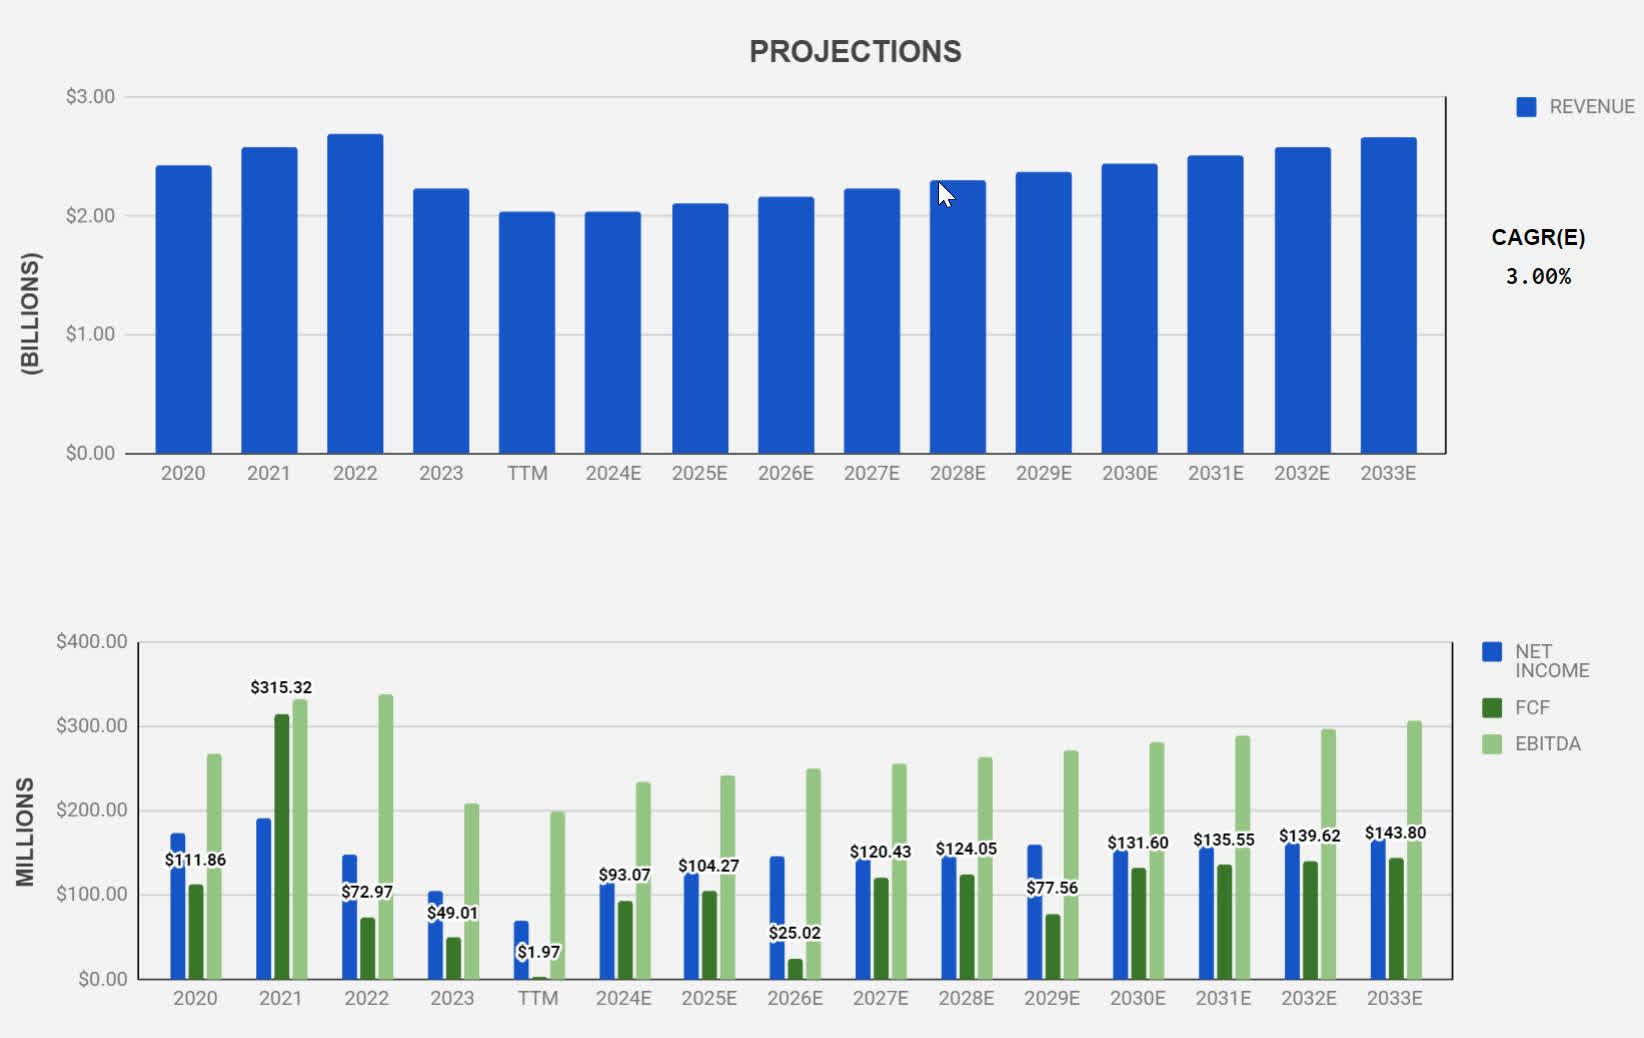
From a Discounted Cash Flow analysis, assuming a generous revenue growth of 3% per year for the next decade, which is just half of the expected industry growth, I get the cash flows shown in Figure 10. I arrive at these cash flows by assuming a profit margin of 6.75% (above the current 3.43% but in line with the average since 2016) and a net income to FCF conversion ratio of 80%, which is also the mean value between 2016 and 2023. My terminal value calculation ($2.6 Billion) is an average between the perpetual growth model and the FCF exit multiple approach. Under this scenario, not only a huge improvement over the last 10 years but also a subpar performance if the industry grows at 6%, the internal rate of return would be 13.66%. The bar is low. There is no reason for Nu Skin to fail to meet these conservative expectations, and yet, I am not confident enough to bet my own money on it.
Last Words
Nu Skin stock looks attractive despite the lackluster financial results in 2022 and TTM. If a very conservative forecast meets reality, the return on investment at the current stock price is enticing, and yet, I am not confident enough to jump in. No growth to show in 10 years, a business model that seems to be much less effective than the traditional retail store, falling profit margins, and the uncertainty regarding what the company means by the transformation it claims to be working on are factors that will keep me looking at other opportunities instead. A high dividend and a low PE are not enough to compensate for the uncertainty I see regarding future growth. The negative price appreciation of about 13% per year over the last decade has more than eaten away the dividends investors have collected during that period. NUS stock reminds me of the popular definition of insanity, that of doing the same thing over and over and expecting different results. It may turn out to be a great investment, but my risk profile urges me to look somewhere else.
For further details see:
Nu Skin: Is It Just A Growth Problem?