BKNG - NULG: Growth With ESG Is Better Than Growth
2024-01-14 05:40:38 ET
Summary
- Nuveen ESG Large-Cap Growth ETF implements an environmental, social, and corporate governance (“ESG”) approach focused on growth stocks.
- The strategy starts from a growth index and excludes companies with bad or unknown ESG ratings and controversies scores, as well as those involved in specific businesses.
- NULG has outperformed the S&P 500 Growth Index since inception and has done very well in 2023.
NULG strategy
Nuveen ESG Large-Cap Growth ETF ( NULG ) started investing operations on 12/13/2016 and tracks the TIAA ESG USA Large-Cap Growth Index. It implements an environmental, social, and corporate governance (“ESG”) investing approach in a growth stock universe. It has 82 holdings, a 12-month distribution yield of 0.43% and a total expense ratio of 0.26%. Distributions are paid annually.
As described by the index provider MSCI , eligible stocks must be in the MSCI USA Growth Index (parent index).
MSCI defines ESG Ratings based on research and analysis of how companies manage environmental, social and governance risks. Companies with a bad or unknown rating are excluded.
MSCI also defines a ESG Controversies Score based on norms of the UN Declaration of Human Rights, the ILO Declaration on Fundamental Principles and Rights at Work, and the UN Global Compact. Companies with a bad or unknown score are excluded. However, some companies with a bad score may still be eligible if they have a good Industry Adjusted Score and MSCI ESG Rating.
Moreover, companies involved in specific businesses are excluded (Alcohol, Tobacco, Gambling, Nuclear Power, Weapons and Firearms).
The remaining companies are ranked based on an industry adjusted score, controversy score and free float adjusted market capitalization. In each sector, the best-ranked securities are selected until their cumulative weight reaches 50% of the sector weight in the Parent Index.
Then, some companies are excluded by a Carbon Screen based on fossil fuel reserve ownership and carbon emission metrics.
Finally, index constituents are determined and weighted by an optimization process aiming “ to achieve risk and return characteristics similar to the Parent Index ”.
The index is reviewed and rebalanced on a quarterly basis. The portfolio turnover rate in the most recent fiscal year was 80%.
NULG portfolio
The fund is almost exclusively invested in US-based companies (about 96% of asset value), about 68% in large caps and 32% in mid-caps (per Fidelity classification). In this article, I will use as a benchmark the S&P 500 Growth Index, represented by iShares S&P 500 Growth ETF (IVW).
Like in all growth funds, the portfolio is overweight in information technology, with 38.5% of assets in this sector. Nevertheless, it is less concentrated than the S&P 500 Growth Index, where technology weighs 46.6%.
NULG sector breakdown (chart: author; data: Nuveen, iShares)
NULG is cheaper than the large cap growth benchmark regarding price/book and price/sales ratios. The difference in price/earnings and price/cash flow is not really significant. The largest gap among valuation and growth metrics (reported in the next table) is in cash flow growth, and it may be a point of concern: it is close to zero for NULG.
| NULG |
| IVW |
| Price/Earnings |
| 32.18 |
| 31.52 |
| Price/Book |
| 7.52 |
| 8.99 |
| Price/Sales |
| 3.63 |
| 5.13 |
| Price/Cash Flow |
| 20.36 |
| 21.13 |
| Earnings growth % |
| 20.28% |
| 21.20% |
| Sales growth % |
| 15.06% |
| 17.28% |
| Cash flow growth % |
| -0.44% |
| 14.96% |
Data: Fidelity
The portfolio is quite concentrated. The top 10 issuers, listed in the next table with fundamental ratios, represent 39% of assets. For convenience, the two share series of Alphabet Inc. ( GOOGL , GOOG ) have been grouped. The top 2 names, Alphabet and NVIDIA, weigh about 16% together. Risks related to other companies are low to moderate.
| Ticker |
| Name |
| Weight% |
| EPS growth %TTM |
| P/E ttm |
| P/E fwd |
| Yield% |
| GOOGL, GOOG |
| Alphabet, Inc. |
| 8.58 |
| 3.56 |
| 27.28 |
| 24.78 |
| 0 |
| NVIDIA Corp. |
| 7.46 |
| 222.20 |
| 71.76 |
| 44.31 |
| 0.03 |
| Tesla, Inc. |
| 4.25 |
| -4.04 |
| 75.33 |
| 76.26 |
| 0 |
| Eli Lilly and Co. |
| 3.59 |
| -18.63 |
| 116.32 |
| 95.72 |
| 0.83 |
| Visa, Inc. |
| 3.21 |
| 19.04 |
| 32.46 |
| 26.73 |
| 0.79 |
| Mastercard, Inc. |
| 2.91 |
| 14.67 |
| 37.30 |
| 35.21 |
| 0.62 |
| Costco Wholesale Corp. |
| 2.74 |
| 10.84 |
| 45.88 |
| 43.13 |
| 0.61 |
| Adobe, Inc. |
| 2.38 |
| 17.00 |
| 50.01 |
| 32.94 |
| 0 |
| Intuit, Inc. |
| 2.06 |
| 39.20 |
| 66.62 |
| 37.12 |
| 0.59 |
| Booking Holdings, Inc. |
| 1.85 |
| 135.76 |
| 24.52 |
| 23.91 |
| 0 |
Historical performance
Since inception, NULG has outperformed the S&P 500 Growth Index by 2.16% in annualized return. The maximum drawdown and volatility are larger, yet the risk-adjusted performance (Sharpe ratio) is slightly ahead of the benchmark.
| Total Return |
| Annual Return |
| Drawdown |
| Sharpe ratio |
| Volatility |
| NULG |
| 203.21% |
| 17.01% |
| -36.17% |
| 0.81 |
| 20.11% |
| IVW |
| 165.62% |
| 14.84% |
| -32.72% |
| 0.76 |
| 18.28% |
Data and calculation: Portfolio123
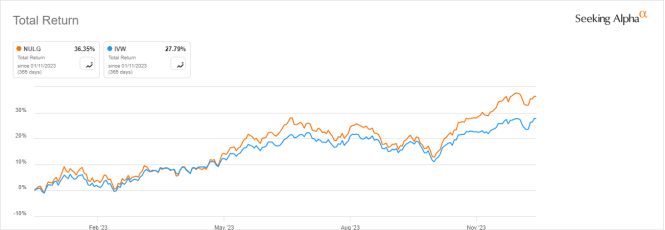
NULG has beaten IVW by over 8% in the last 12 months:
NULG vs. S&P 500 Growth Index, year-to-date (Seeking Alpha)
NULG vs. competitors
The next table compares characteristics of NULG and four other ESG ETFs
- Vanguard ESG U.S. Stock ETF ( ESGV )
- iShares ESG Aware MSCI USA ETF ( ESGU )
- iShares MSCI KLD 400 Social ETF ( DSI )
- SPDR S&P 500 ESG ETF ( EFIV )
| NULG |
| ESGV |
| ESGU |
| DSI |
| EFIV |
| Inception |
| 12/13/2016 |
| 09/18/2018 |
| 12/1/2016 |
| 11/14/2006 |
| 7/27/2020 |
| Expense Ratio |
| 0.26% |
| 0.09% |
| 0.15% |
| 0.25% |
| 0.10% |
| AUM |
| $1.20B |
| $7.48B |
| $13.45B |
| $4.08B |
| $1.11B |
| Avg Daily Volume |
| $4.80M |
| $17.99M |
| $70.78M |
| $14.57M |
| $2.17M |
| Number of Holdings |
| 83 |
| 1468 |
| 290 |
| 405 |
| 319 |
| Assets in Top 10 |
| 39% |
| 32.58% |
| 29.66% |
| 35.63% |
| 39.67% |
| Turnover |
| 80.00% |
| 3.00% |
| 25.00% |
| 4.00% |
| 12.00% |
NULG has the highest fee and turnover, the lowest number of holdings, and is second to last in size and liquidity.
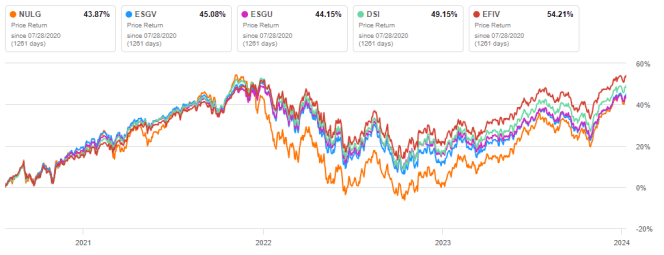
The next chart plots total returns starting on 7/28/2020 to match all inception dates. NULG is trailing its competitors, but it is almost on par with ESGV and ESGU.
NULG vs. competitors, since 7/28/2020 (Seeking Alpha)
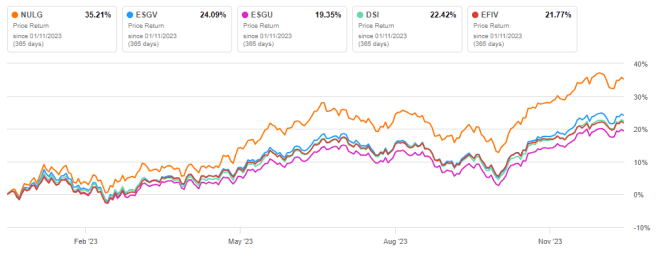
Nevertheless, it has been far ahead of the pack for 12 months:
NULG vs. competitors, trailing 12 months (Seeking Alpha)
Takeaway
Nuveen ESG Large-Cap Growth ETF implements an environmental, social, and corporate governance (“ESG”) strategy focused on large cap growth stocks. It is overweight in technology, but less than the S&P 500 Growth Index. NULG has beaten this benchmark since inception and performed particularly well in 2023. It has not been the best performer among ESG funds since 2020, but it is close to its competitors and this time interval is too short to assess them relative to each other. The most interesting point here is that adding ESG constraints may bring significant excess to the growth investing style.
For further details see:
NULG: Growth With ESG Is Better Than Growth