QQQ - NUSI: Positive Surprise From Megacaps; Dotcom Redux?
2023-06-18 21:32:47 ET
Summary
- The Nasdaq-100 Risk-Managed Income ETF has exceeded expectations in 2023 due to the extraordinary rally in the Nasdaq 100 Index.
- The current rally may be unsustainable, driven by a narrow basket of stocks with bubble-like valuations.
- The NUSI ETF is rated a hold, as it is difficult to predict when a bubble will burst.
As someone giving out opinions on stocks and funds, I occasionally have to eat some crow. That appears to be the case with the Nationwide Nasdaq-100 Risk-Managed Income ETF ( NUSI ), which I recommended investors avoid, due to the bad structure of its protective collar options strategy.
Unfortunately, my update article could not have come at a worse time, as NUSI's stock price went on a rocket ride shortly after I published April (Figure 1).
Figure 1 - NUSI performance since April 23 (Seeking Alpha)
What did I get wrong in my analysis and has my thinking on the fund changed?
Brief Fund Overview
To understand the fund's performance, we need to first understand the fund's strategy and holdings. The NUSI ETF employs a protective collar options trading strategy to generate income from selling call options to fund a portfolio of put options for downside protection and to pay distributions to unitholders (Figure 2).
Figure 2 - NUSI strategy (nationwidefinancial.com)
The NUSI ETF currently has $457 million in assets and pays a trailing 7.1% distribution yield while charging a 0.68% expense ratio.
According to NUSI's whitepaper , the ETF will benefit from capital appreciation and dividends from the fund's holdings and premiums from written calls in a rising market. However, upside is capped by call options, as returns above the call option strike are exchanged for option premium. The fund also suffers from option decay of the long put option that it holds.
In a sideways market, the NUSI ETF collects dividends from fund holdings and written call premiums, but suffers put option decay.
In a moderately down market (above the strike price of the put options), the fund collects dividends and written call premiums, but suffers from capital drawdown on its holdings as they are above the strike price of the put options.
Finally, in a steep decline, the fund collects dividends and written call premiums, but its capital drawdown is limited by the put option that begins to offset drawdowns beyond the put option strike price.
Strategy Trades Away Upside And Downside
My main criticism of NUSI's strategy is that similar to other call-writing strategies, NUSI trades away part of its upside returns distribution in exchange for option premium. Furthermore, unlike a pure call-writing strategy, NUSI also cuts off downside returns by spending some of its collected call premiums to buy put options. In effect, NUSI gives up monthly returns greater than 3% and less than -10% (assuming NUSI's portfolio was short 13,350 calls and long 11,675 puts on April 21 when I last looked at its portfolio).
Figure 3 shows historical Nasdaq 100 monthly returns, with returns greater than 3% and less than -10% highlighted in red.
Figure 3 - Nasdaq 100 monthly returns distribution (Author created with data from Yahoo Finance)
In my prior article, my comment regarding this strategy of dropping the tails was:
After dropping the tails, the resulting distribution has a mean return of -0.9% vs. an overall mean return of 1.3% including the tails. Presumably the fund receives ~1% net premium per month in selling calls and buying puts. Is it any wonder then that the NUSI fund's long-term average annual return since inception is a minuscule 0.6%?
I believe my conclusion about the long-term failings of the strategy is still valid.
Rolling 6-Month Returns Entering Rarefied Territory
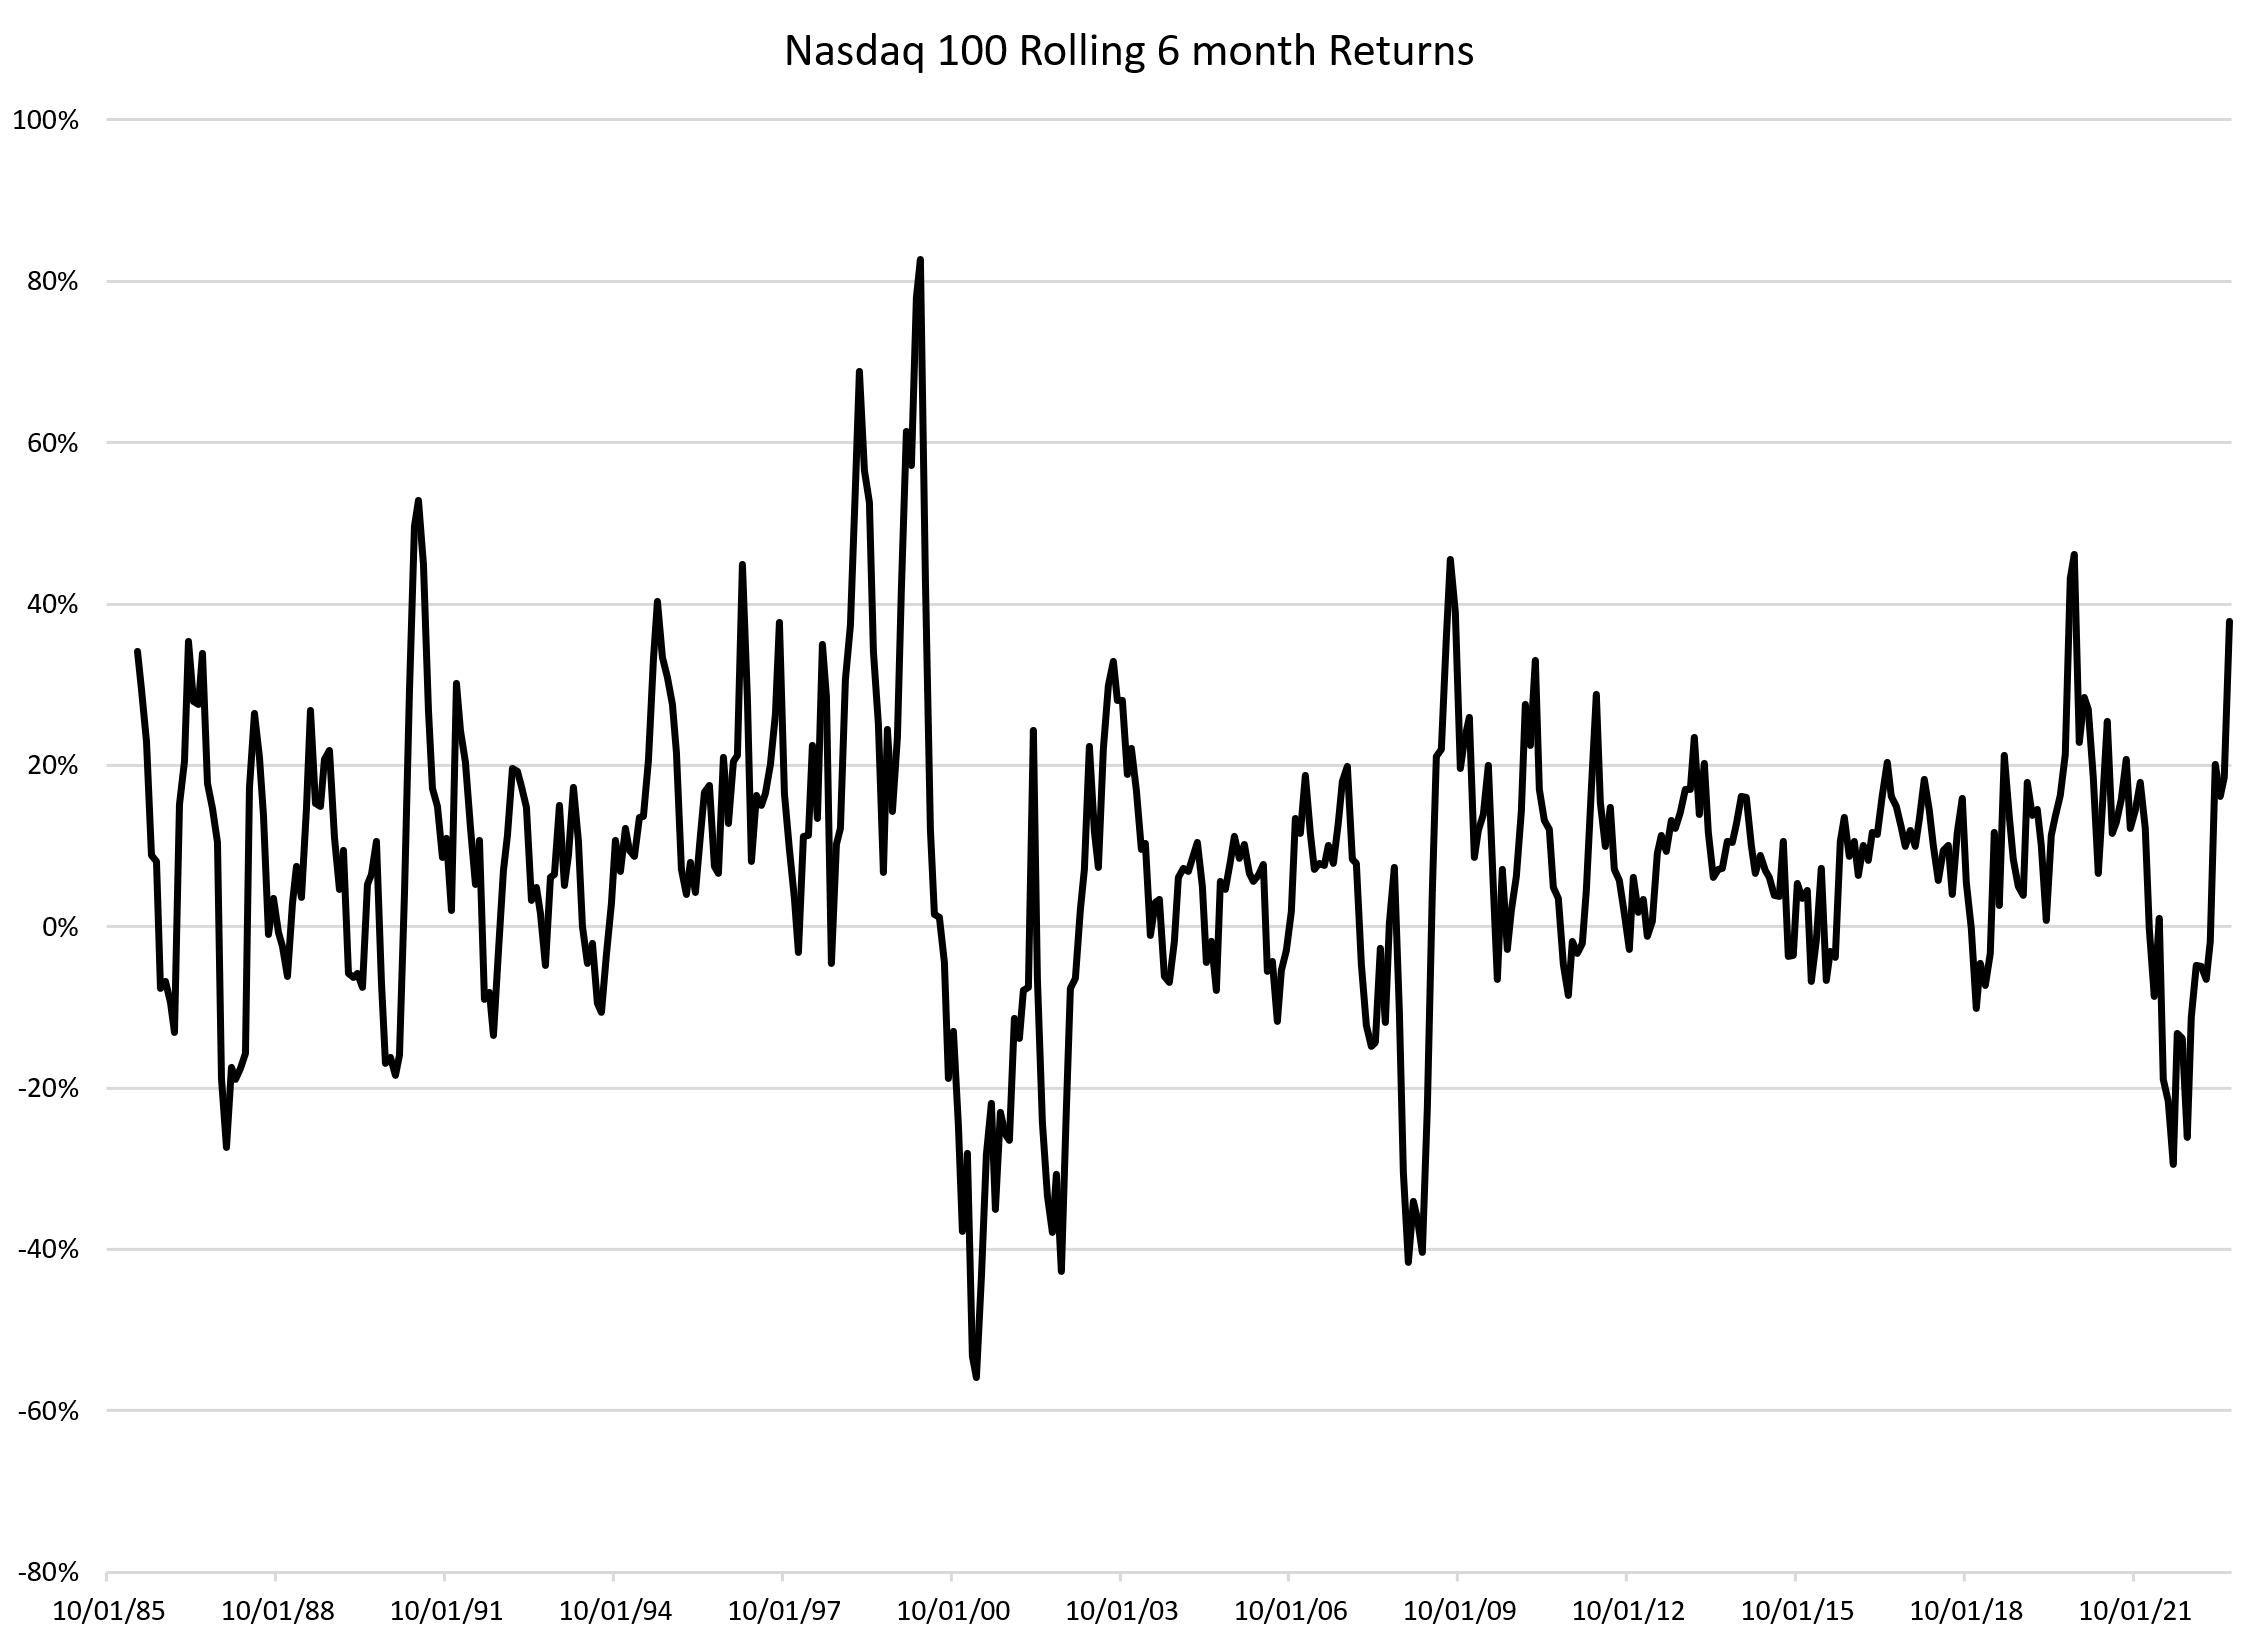
What I did not anticipate was the Nasdaq 100 delivering rolling 6-month returns of 38% YTD, approaching some of the best periods in history (Figure 4).
Figure 4 - Nasdaq 100 rolling 6 month returns (Author created with data from Yahoo Finance)
In fact, in 2023, the Nasdaq 100 Index has returned 10.6%, -0.5%, 9.5%, 0.5%, 7.6%, and 5.8% MTD to June 16th.
Recall, in the strategy discussion above, upside returns for the NUSI ETF is capped at the strike price, which is ~3% out of the money ("OTM") and the fund collects ~1% in net premiums per month. Therefore, it is no surprise that so far in 2023, the NUSI ETF has returned 2.1%, 1.8%, 4.2%, 0.9%, 4.7%, and ~5.6% MTD to June 16th (Note, the monthly returns on the NUSI ETF does not exactly line up with the monthly returns of the Nasdaq 100 Index as the options written have monthly expiries on the 3rd Friday of each month).
Essentially, the NUSI ETF has hit the monthly return cap 3 times this year with no significant drawdowns, leading to its extraordinary YTD returns of 14.7% to May 31, 2023.
How Sustainable Is This Ascent?
The Nasdaq 100 Index, buoyed by megacap technology giants like Microsoft ( MSFT ), Apple ( AAPL ) and NVIDIA ( NVDA ), are partying like it is 1999/2000 on the back of investor euphoria over 'artificial intelligence' ("AI") while the rest of the market is essentially left behind.
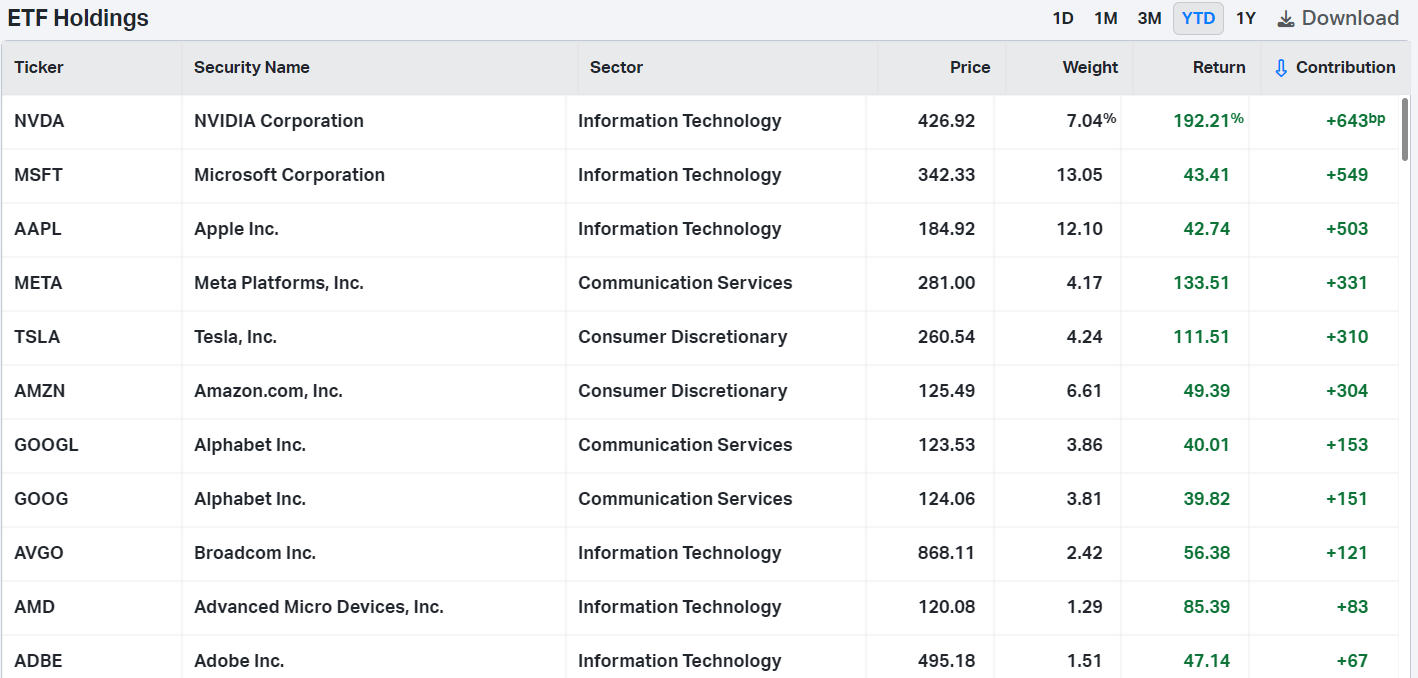
So far this year, just 10 companies account for more than 80% of the YTD gains in the Invesco QQQ ETF ( QQQ ) that tracks the Nasdaq 100 index (Figure 5).
Figure 5 - 10 companies account for more than 32% of 38% YTD gain in QQQ (koyfin.com)
The question investors need to ask is how sustainable is this ascent?
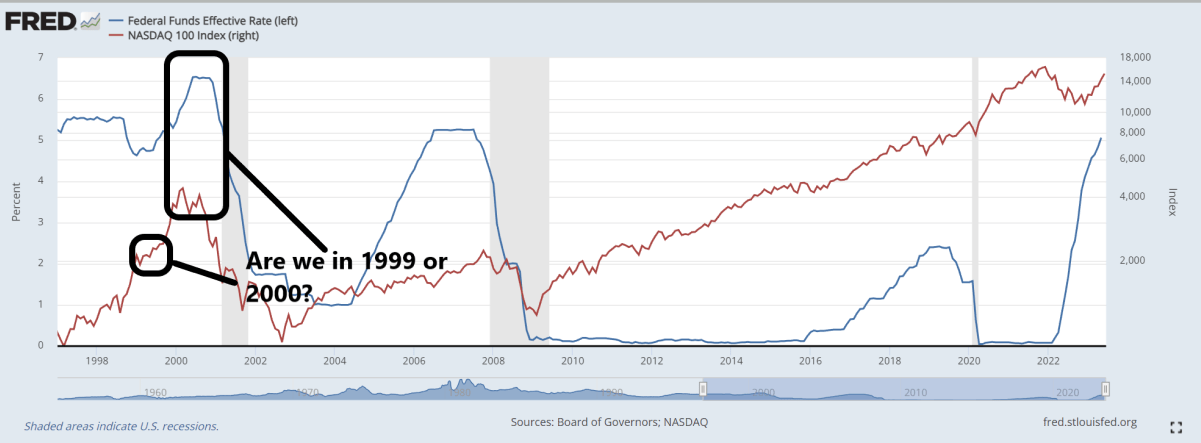
While history does not repeat, if does often rhymes. If the collapse of SVB Financial in March 2023 is similar to the blow-up of Long Term Capital Management ("LTCM") in September 1998, which caused the Federal Reserve to stand pat despite an inflating asset bubble to protect against 'systemic risks', then the Nasdaq 100 Index may have a lot more to run. The Nasdaq 100 Index more than tripled from 1,345 at the end of September 1998 to the blow-off top of 4,816 in March 2020 (Figure 6).
Figure 6 - Are we in circa 1999 or 2000? (Author created with data from St Louis Fed)
On the other hand, the Fed's recent pause in interest rate hikes suggest they could be near the end of the current hiking cycle. Historically, recessions occur 'after' the Fed is done raising interest rates. If that is the case, then we could be in late 1999 / early 2020, before the Fed raised interest rates for the last time in June 2020. The Nasdaq 100 Index actually peaked as the Fed was done raising interest rates.
The fact that leading companies like Nvidia are trading at more than 20x Forward EV/Revenue suggest we are closer to 2000 than 1999 (Figure 7).
Figure 7 - NVDA valuation (koyfin.com)
However, bubbles are only apparent after the fact when former CEOs like that of Sun Microsystems can reminiscent about the folly of investors:
“…2 years ago we were selling at 10 times revenues when we were at $64. At 10 times revenues, to give you a 10-year payback, I have to pay you 100% of revenues for 10 straight years in dividends. That assumes I can get that by my shareholders. That assumes I have zero cost of goods sold, which is very hard for a computer company. That assumes zero expenses, which is really hard with 39,000 employees. That assumes I pay no taxes, which is very hard. And that assumes you pay no taxes on your dividends, which is kind of illegal. And that assumes with zero R&D for the next 10 years, I can maintain the current revenue run rate. Now, having done that, would any of you like to buy my stock at $64? Do you realize how ridiculous those basic assumptions are? You don’t need any transparency. You don’t need any footnotes. What were you thinking?”
In the here and now, investors can only enjoy the party while it lasts and hope they are able to exit before the crash (author's opinion, they rarely do).
Won't NUSI Protect From Downside?
In theory, NUSI's collar strategy can protect investors on the downside in an eventual crash, as it owns put options on the Nasdaq 100 Index. However, just like how the NUSI ETF can hit the call strike 3 out of the past 6 months, in a major bear markets, it can also hit the 10% OTM put strike in consecutive months.
The NUSI ETF's strategy really only protects investors in short-duration crashes like the Covid-pandemic crash, when stocks declined rapidly and then staged a furious rally.
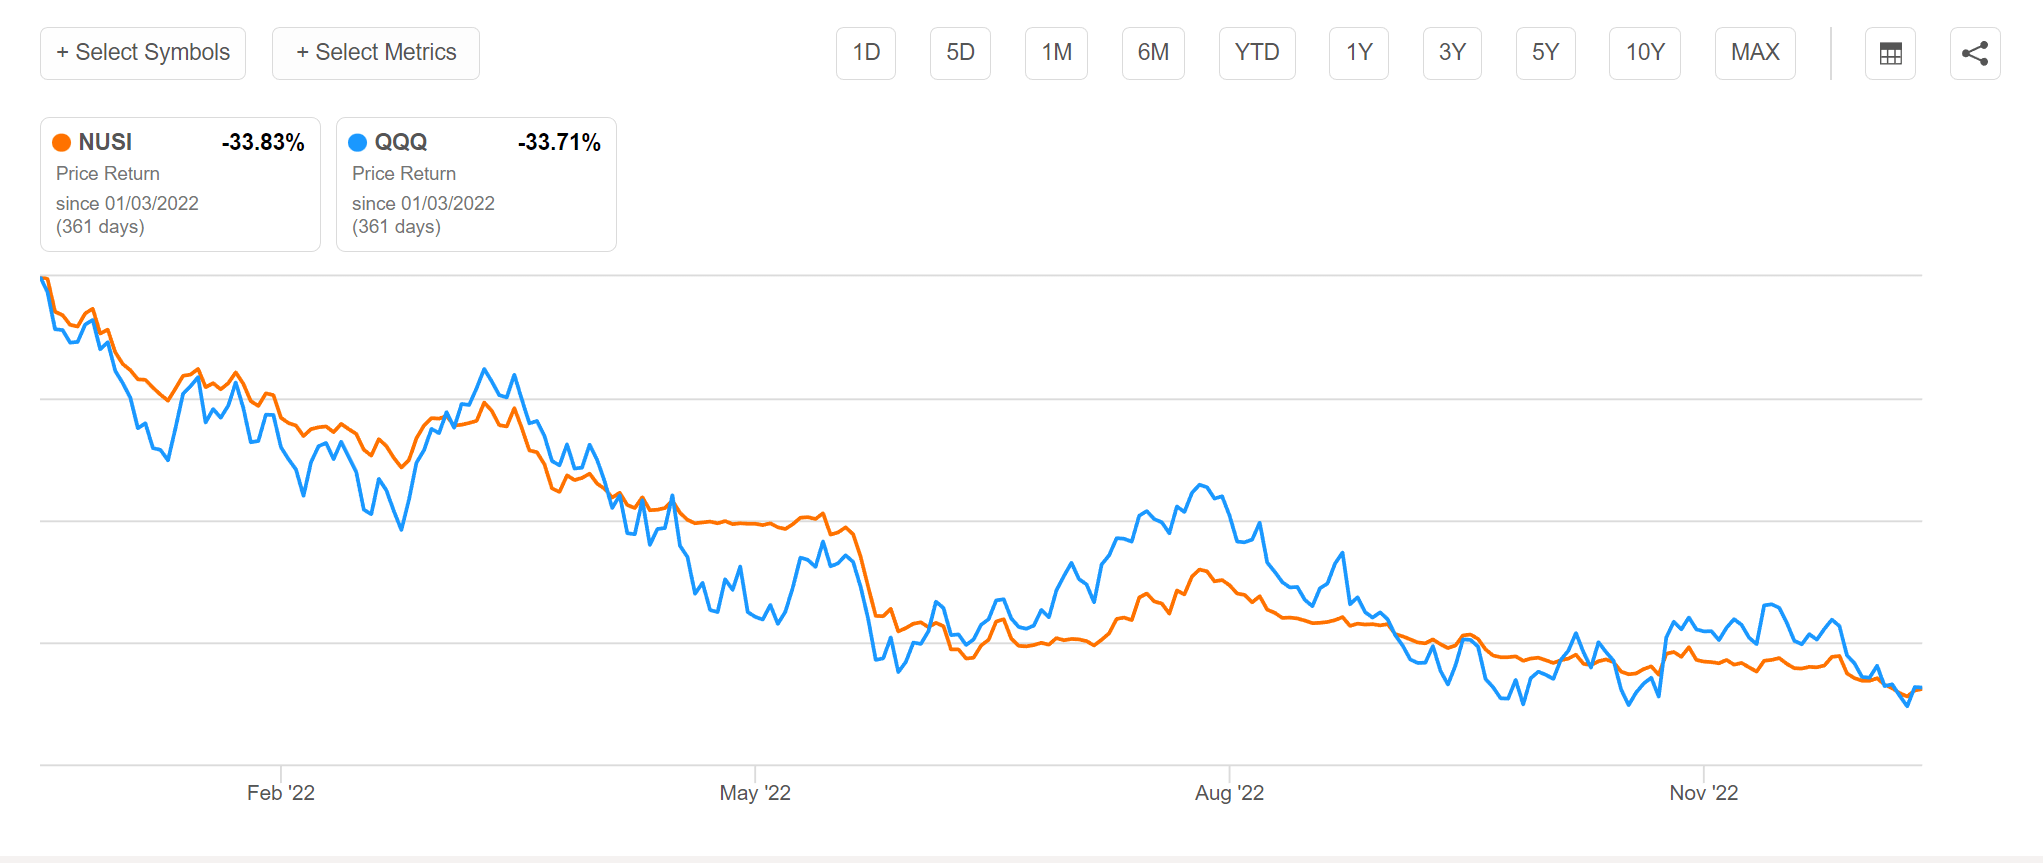
During a protracted bear market like in most of 2022, the NUSI ETF performed just as poorly as the QQQ ETF (Figure 8).
Figure 8 - NUSI performs just as poorly as Nasdaq in protracted bear markets (Seeking Alpha)
Conclusion
Mea culpa, I was wrong about the NUSI ETF. The NUSI ETF has exceeded my expectations so far in 2023 due to the extraordinary rally in the Nasdaq 100 Index. The megacap rally has allowed the NUSI ETF to achieve the 'limit up' situation 3 times in the past 6 months without a single down in 2023.
However, I am worried that the Nasdaq 100 Index's current rally is unsustainable, as it is driven by a narrow basket of stocks with many trading at bubble-like valuations. In fact, on a rolling 6-month basis, the Nasdaq 100 Index's rally is approaching rarefied territory last seen in early 2020.
Since no one can predict when a bubble will burst, I cannot recommend investors short the NUSI ETF at this point in time. All I can say is enjoy the rally while it lasts. I rate the NUSI ETF a hold .
For further details see:
NUSI: Positive Surprise From Megacaps; Dotcom Redux?