NUSI - NUSI: Running In Place To Nowhere
2023-04-23 04:16:00 ET
Summary
- The Nationwide Nasdaq-100 Risk-Managed Income ETF uses options to generate income and protect downside.
- The fund employs a protective collar strategy that sells calls to buy puts and pay distributions.
- Unfortunately, investors end up with a product that does essentially nothing, hedging away both upside and downside.
- I would avoid this fund.
About half a year ago, I wrote that investors should avoid the Nationwide Nasdaq-100 Risk-Managed Income ETF ( NUSI ), as it was promising index-like returns with high income and downside protection, the impossible trinity. With half a year gone by, let us review my analysis to see if I was accurate in my assessment of the NUSI ETF?
Brief Fund Overview
The NUSI ETF uses a rules-based protective collar options trading strategy to generate income from writing call options to buy put options for downside protection and pay distributions to unitholders (Figure 1).
Figure 1 - Illustrative protective collar strategy (nationwidefinancial.com)
From my prior article:
In a rising market, the NUSI fund benefits from capital appreciation and dividends from the fund's holdings and premium from written calls. However, the fund's upside is capped, as large upside moves beyond the call option strike are forfeit in exchange for the option premium. The fund also suffers from the long put option decay.
In a sideways market, the fund benefits from dividends and the written call premiums but suffers from put option decay.
In a moderately down market (above the strike price of the put options), the fund benefits from dividends and the written call premiums, and potentially from the long put option increasing in value prior to expiration. However, the fund suffers from any capital drawdowns that are above the put option strike price. The put options also expire worthless if the depreciation is less than the strike price.
Finally, in a steeply declining market (beyond the strike price of the put options), the fund benefits from dividends and written call premiums, as well as the increase in value of the put options. However, the fund suffers from depreciation of the underlying up to the put option strike price.
Let's Review The Performance
For the purpose of this analysis, I will compare the NUSI ETF against the Invesco QQQ Trust ETF ( QQQ ) the Global X Nasdaq 100 Covered Call ETF ( QYLD ), the JPMorgan Equity Premium Income ETF ( JEPI ), and the Simplify Volatility Premium ETF ( SVOL ).
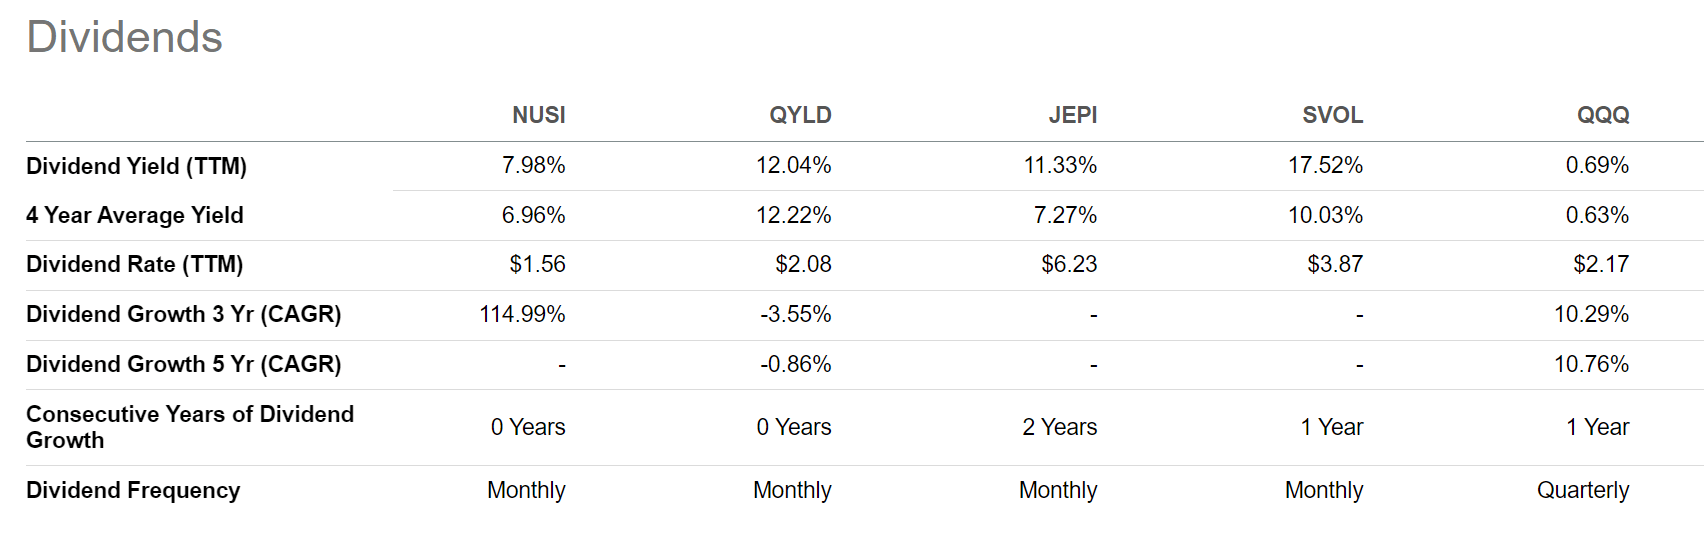
First, comparing the distribution yield, the NUSI ETF has the lowest distribution yield out of the 4 options-enhanced strategies, with a trailing 12 month yield of 8.0%. SVOL has the highest distribution yield at 17.5% (Figure 2).
Figure 2 - NUSI vs. peers distribution yield (Seeking Alpha)
This result is understandable, as NUSI must spend a portion of its premiums received from selling calls to buy puts for downside protection.
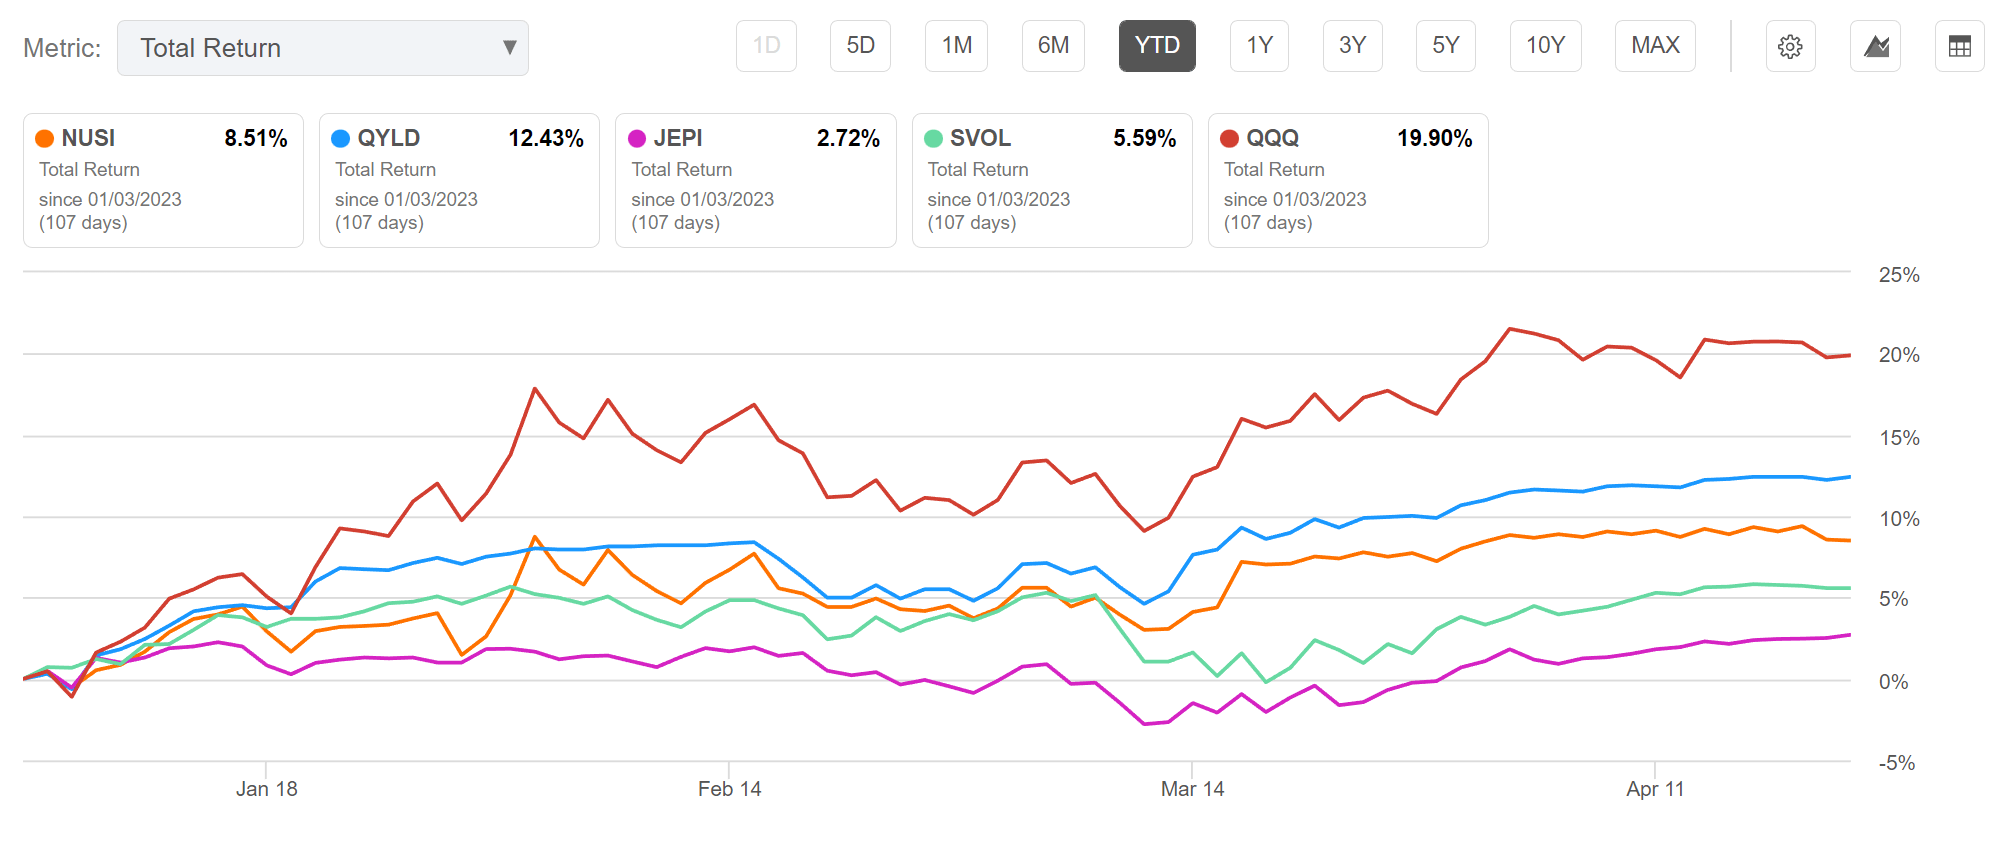
Moving on to total returns, in the short-term YTD period, NUSI has returned 8.5%, lagging the QYLD at 12.4% and the QQQ at 19.9%. However it has beaten JEPI at 2.7% and SVOL at 5.6% (Figure 3).
Figure 3 - NUSI YTD returns vs. peers (Seeking Alpha)
NUSI underperforms the QQQ because its strategy trades away upside for premiums. It underperforms QYLD because it must spend premiums to buy downside protection. It outperforms JEPI and SVOL because the YTD rally in stocks has been mostly led by the mega-caps that dominate the Nasdaq whereas JEPI is more focused on S&P 500 stocks and SVOL is based on selling VIX futures, which are tied to S&P 500 Index.
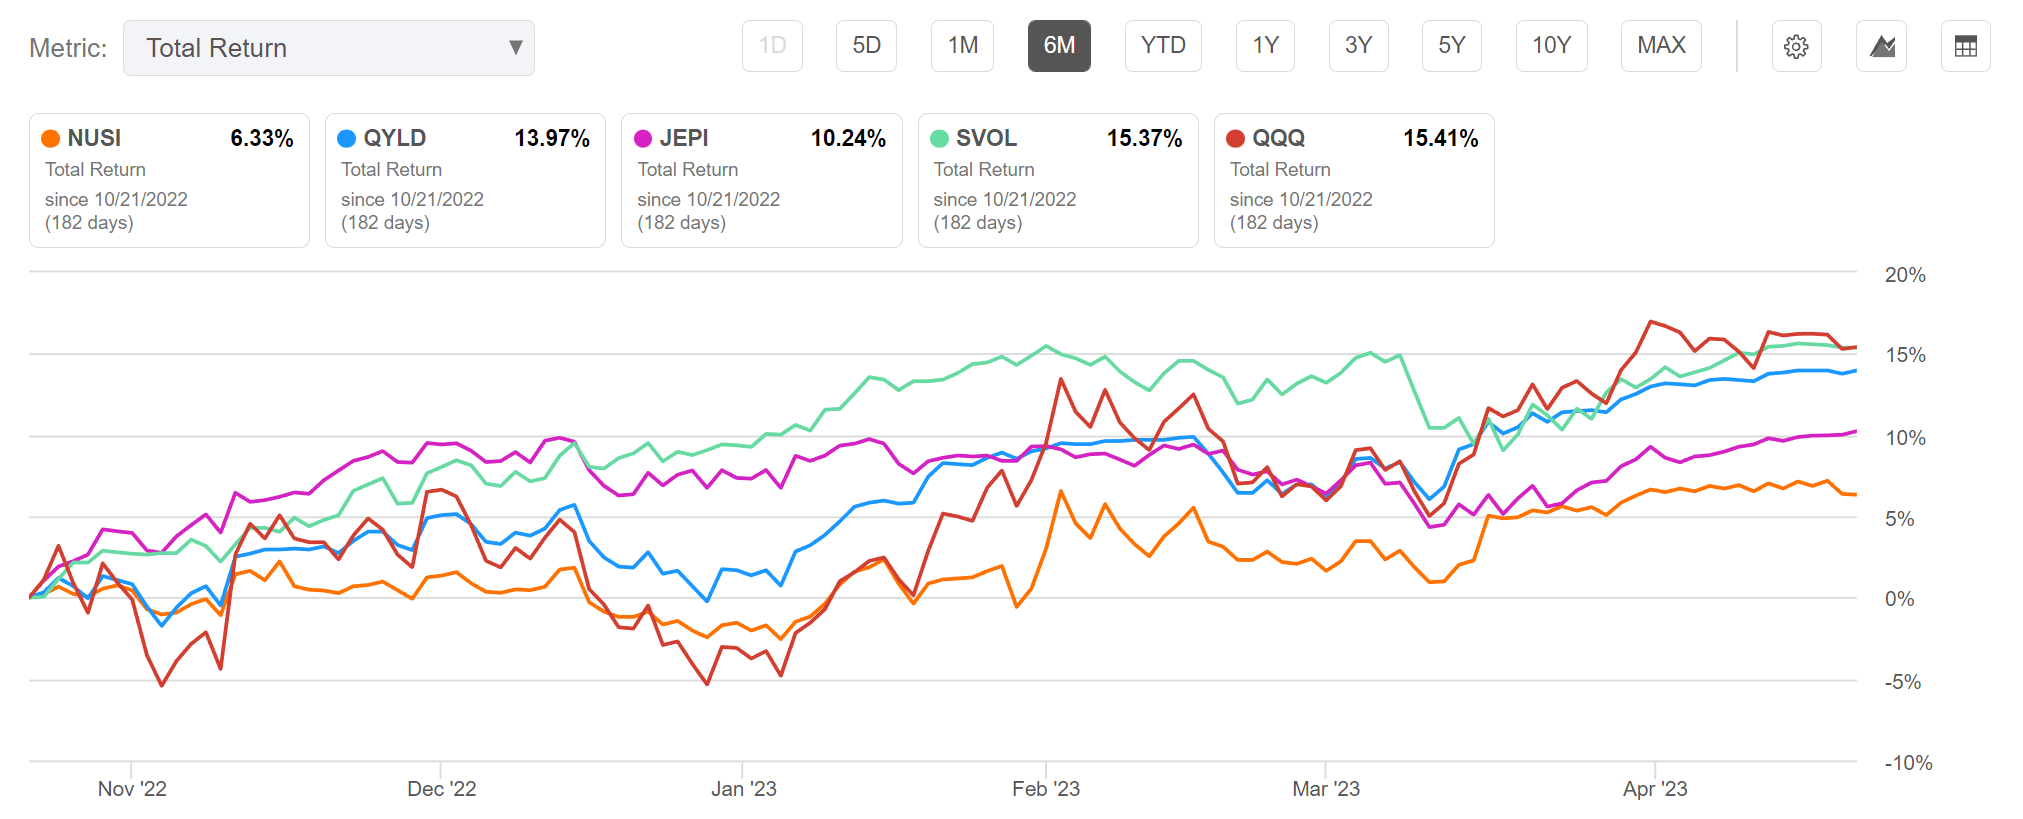
However, on long-term time frames, we can see NUSI's performance really start to fall apart. On a 6-month time frame, NUSI has returned 6.3% vs. 14.0% for the QYLD, 10.2% for JEPI, 15.4% for SVOL and 15.4% for QQQ (Figure 4).
Figure 4 - NUSI 6M returns vs. peers (Seeking Alpha)
Markets have generally been in an uptrend since October and NUSI has essentially sold away the majority of its upside while spending significant premium on downside protection that was not used.
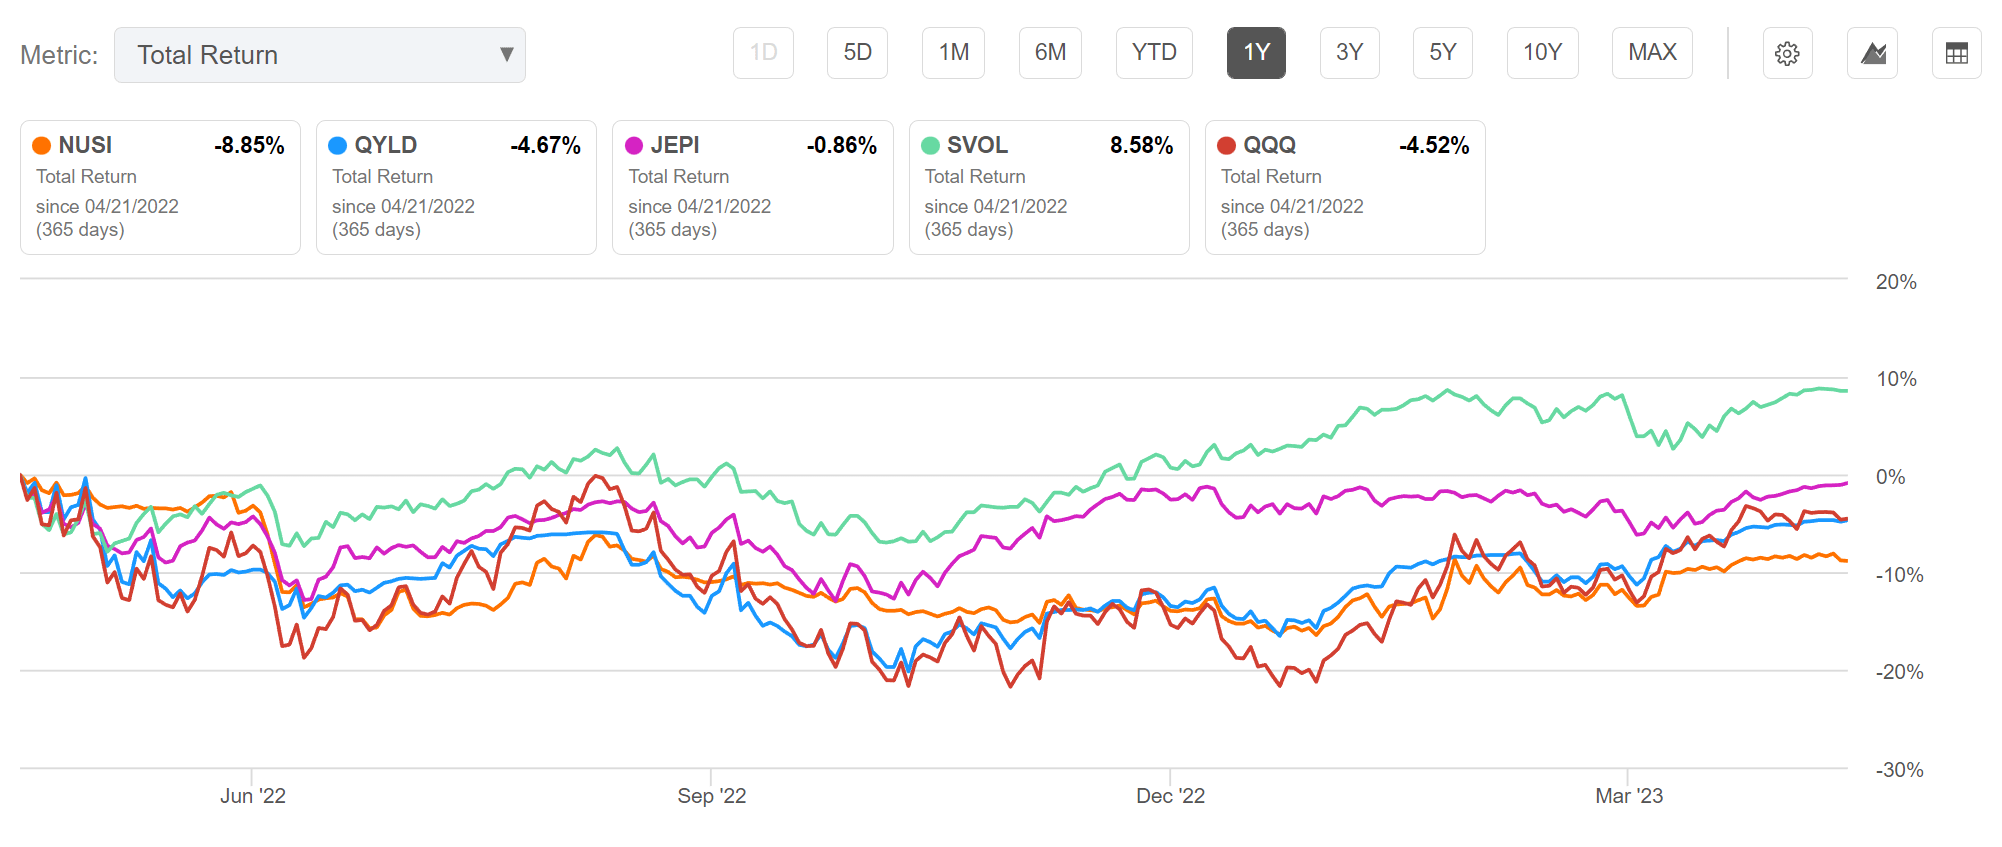
On a 1-Yr time frame, NUSI's underperformance gets worse (Figure 5). NUSI retuned -8.9% vs. -4.7% for QYLD, -0.9% for JEPI, 8.6% for SVOL, and -4.5% for QQQ.
Figure 5 - NUSI 1Yr returns vs. peers (Seeking Alpha)
So even though the QQQ (which tracks Nasdaq 100 stocks like the NUSI) was down 4.5% on a 1-Yr basis, NUSI did not provide any downside protection. It actually lost more money than the QQQ.
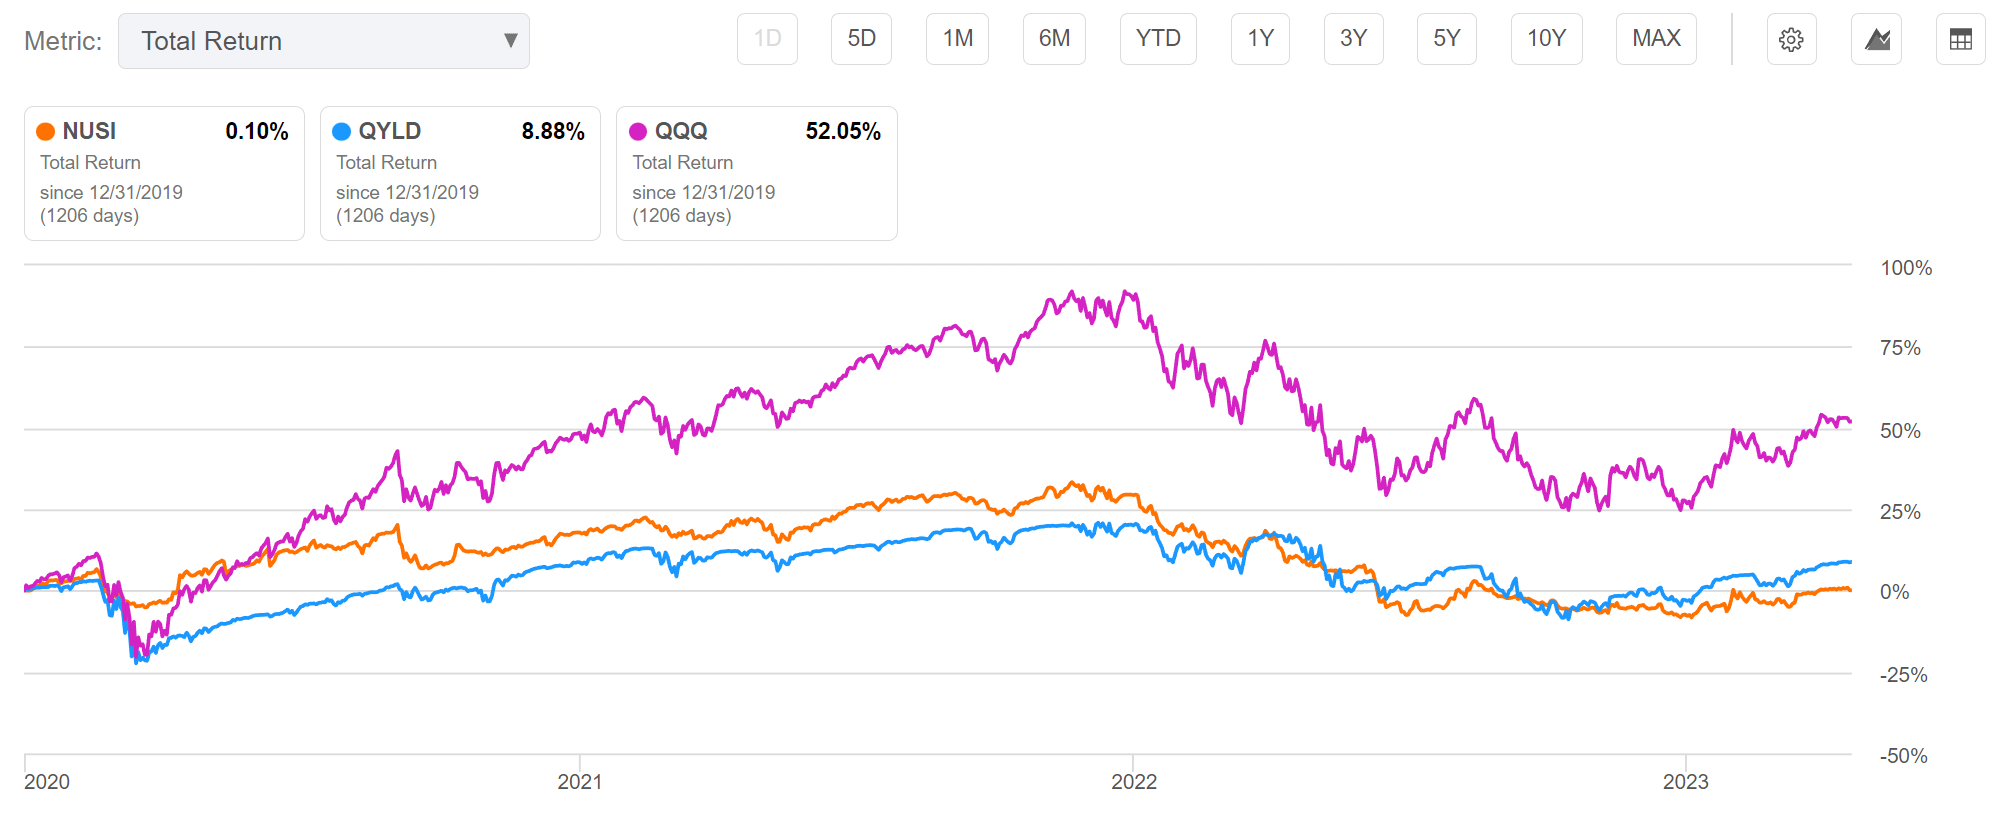
Finally, looking at NUSI's performance since December 31, 2019, we can see it still underperformed the QYLD and QQQ ETF (note JEPI and SVOL were incepted in 2020 and 2021 respectively) with 0.1% in total return vs. 8.9% for the QYLD and 52.1% for the QQQ.
Figure 6 - NUSI returns since December 2019 vs. peers (Seeking Alpha)
Note, this time period was chosen specifically to flatter the NUSI, as it included the COVID crash where NUSI's downside protection kicked in. However, even with its downside protection, NUSI still dramatically underperformed its peers.
Why Does NUSI Underperform?
As I have written repeatedly in various articles , call-writing strategies underperform because they trade away part of their upside returns for premiums. Over the long-run, this cuts off part of the fund's upside returns distribution.
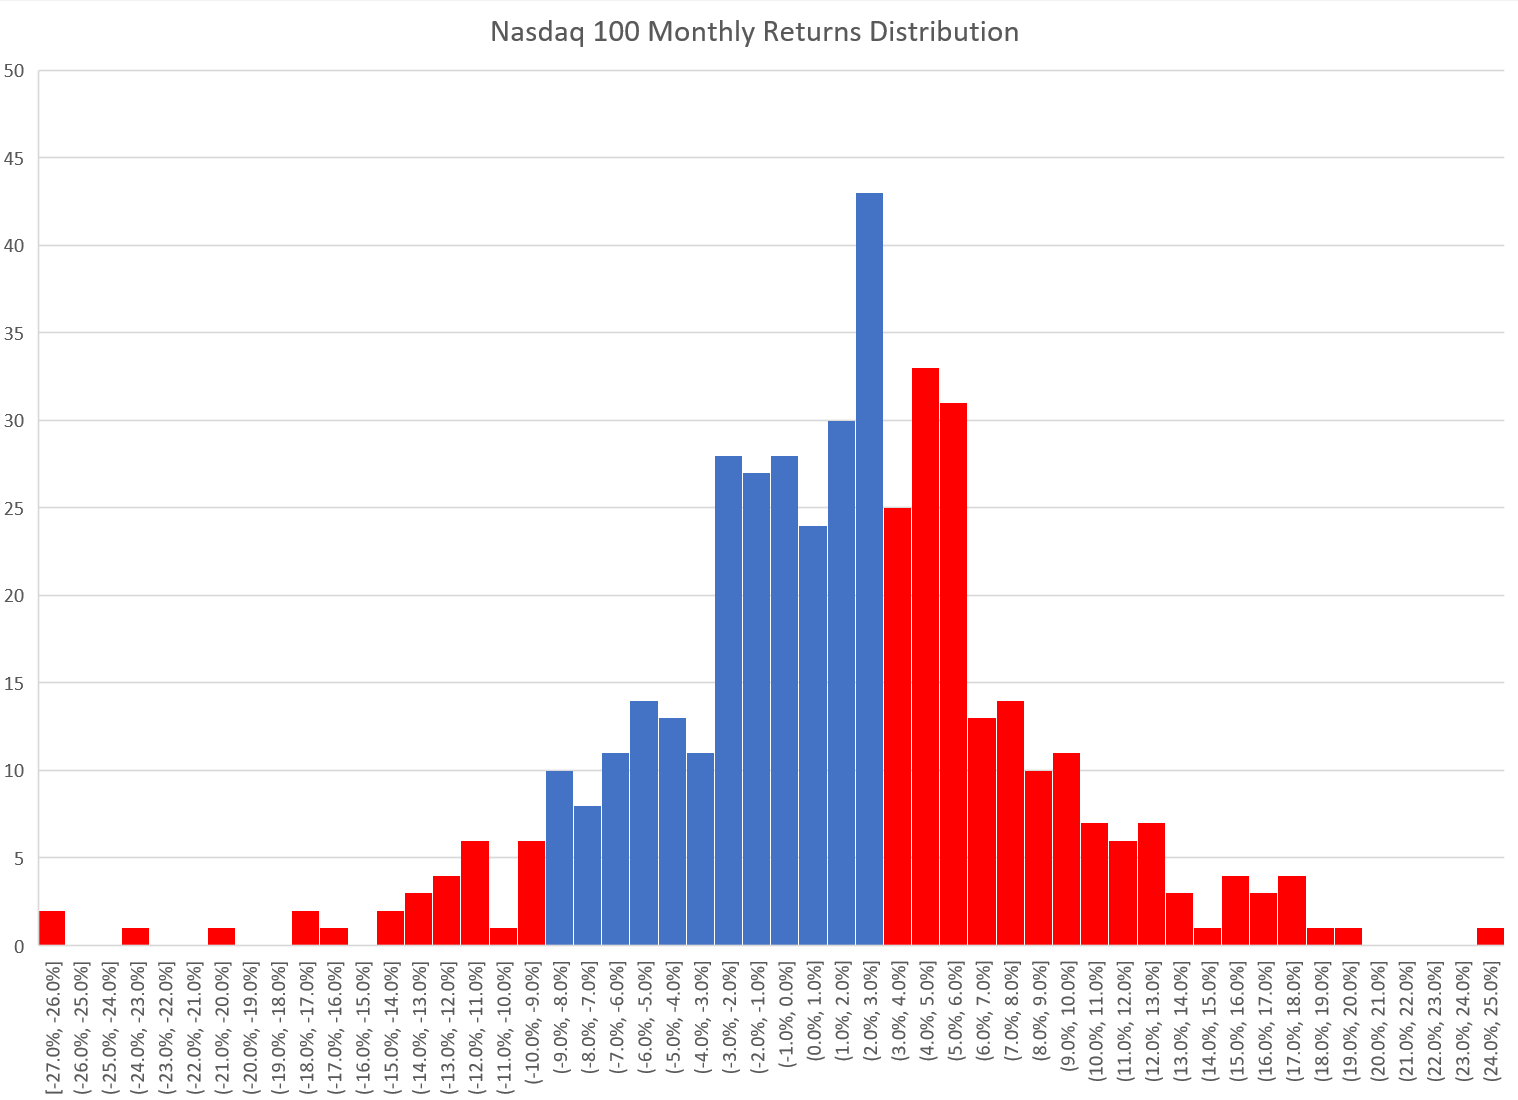
On the other hand, NUSI buys put options that cuts off the downside returns as well. For example, as of April 21, 2022, NUSI's portfolio was short Nasdaq 100 calls with a 13,350 (2.7% OTM vs. Nasdaq 100 index close of 13,000) strike while it was long puts with a 11,675 strike (10.0% OTM).
Figure 7 shows a historical monthly returns histogram of the Nasdaq 100 Index. Essentially what NUSI is doing is giving up monthly returns greater than 3% (assuming the option strikes are accurate) and downside greater than 10%.
Figure 7 - Nasdaq 100 Index historical monthly returns distribution (Author created with data from Yahoo Finance)
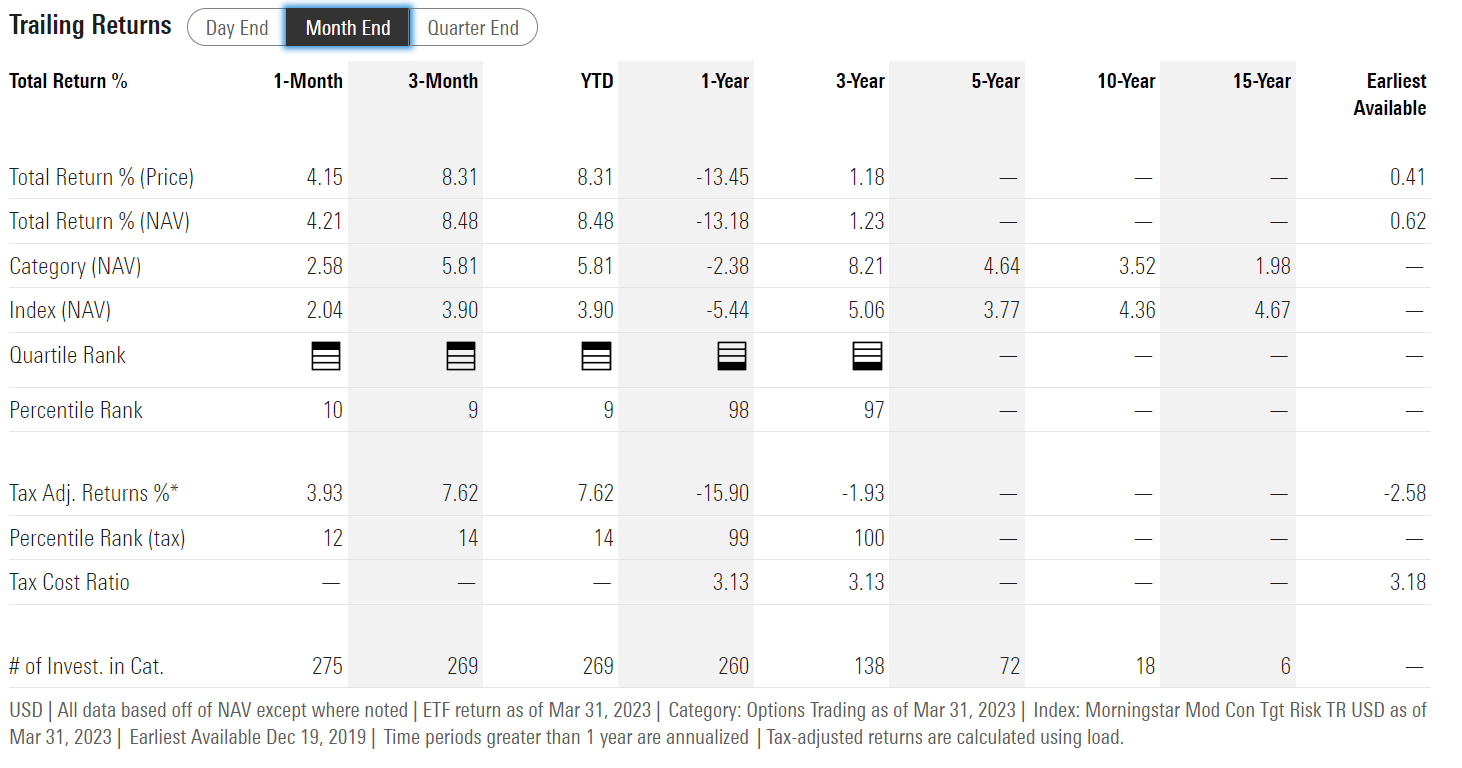
After dropping the tails, the resulting distribution has a mean return of -0.9% vs. an overall mean return of 1.3% including the tails. Presumably the fund receives ~1% net premium per month in selling calls and buying puts. Is it any wonder then that the NUSI fund's long-term average annual return since inception is a minuscule 0.6% (Figure 8)?
Figure 8 - NUSI historical returns (morningstar.com)
Conclusion
The NUSI ETF has essentially hedged away both upside and downside, leaving long-term investors with no returns. My original conclusion still stands. Investors are better off buying-and-holding low-cost broad index ETFs like the QQQ or the SPDR S&P 500 ETF Trust ( SPY ) if they want index-like returns. If they want high income, they may want to consider the SVOL ETF that shorts a moderate amount of VIX futures. If they are worried about downside protection, they reduce their overall exposure. The worst thing they can do is to buy and hold the NUSI ETF.
For further details see:
NUSI: Running In Place To Nowhere