SVOL - NVDY: Generating 50% Yield From Nvidia Options
2023-07-13 12:49:11 ET
Summary
- YieldMax NVDA Option Income Strategy ETF is a single-stock based fund that generates yields from selling options in Nvidia Corporation stock, with an annualized yield of 48% so far.
- The fund uses a three-step options strategy and is actively managed, adjusting its holdings based on how Nvidia stock acts, and has outperformed the S&P 500 by about 200% since its launch.
- The fund is a good investment for those who are bullish or neutral on Nvidia, but not for those who are bearish on the stock due to potential large losses if the stock value drops.
YieldMax NVDA Option Income Strategy ETF ( NVDY ) is a single-stock based exchange-traded fund or ETF, that aims to generate double-digit yields from selling options in Nvidia Corporation (NVDA). The fund was launched a couple of months ago after successes of YieldMax TSLA Option Income Strategy ETF ( TSLY ) and YieldMax ARKK Option Income Strategy ETF ( OARK ), which make options plays on Tesla, Inc. ( TSLA ) and ARKK Innovation ETF ( ARKK ), respectively.
This fund writes a version of what some people call "poor man's covered call," also known as calendar spreads in order to generate yields. So far, it has announced 2 months' worth of dividends, which give it an annualized yield of 48% so far. Before I explain how this fund works and what specific plays it does, let me give a short overview of the options-based funds sector.
Lately, we are seeing more and more ETFs, closed-end funds ("CEFs"), and mutual funds that do options plays in order to generate income. JPMorgan Chase & Co.'s ( JPM ) covered call ETFs, JPMorgan Equity Premium Income ETF ( JEPI ) and JPMorgan Nasdaq Equity Premium Income ETF ( JEPQ ), became so popular that The Goldman Sachs Group (GS) is now creating its own versions of these funds to be launched soon.
Meanwhile, option-based ETFs are getting more creative, too. At first, all these funds did was to buy S&P 500 (SP500) shares and sell at-the-money calls against those shares. Many funds still do this. Newer funds take different approaches as well. For example, Simplify Enhanced Income ETF ( HIGH ) sells vertical spreads, Simplify Volatility Premium ETF ( SVOL ) sells VIX future contracts, Neos S&P 500(R) High Income ETF ( SPYI ) sells covered calls spreads (not straight covered calls), which allow the fund to participate in some of the upside, and YieldMax funds make their own unique option plays that combine calendar spreads with vertical spreads.
NVDY's play includes 3 steps. First step is buying a call option 6 months out. The second step is selling a put option also 6 months out at the same strike price. This is done in order to cover the cost of the first step which involves buying an expensive call option. The third step is selling a call option that's roughly 2-4 weeks away and 10-15% out of money.
To be more specific, let us take a look at the fund's current options play. Keep in mind that this is an actively managed fund and its holdings will change almost on a daily basis depending on how NVDA acts. As of writing this article, NVDA's share price is $439, and I am seeing NVDY holding $425 calls, shorting $425 puts, and selling layers of call options with strike prices of $435, $443, $445 and $450. The fund sold calls at a variety of prices instead of selling them all at once because it didn't want to miss out in case the stock suddenly jumps higher like it is known to do from time to time.
The first layer of NVDY's short calls is already breached, since the current price of $439 is above the lowest calls being sold at $435 but other calls ($443, $445 and $450) are still out of money. Since the fund is actively managed, it typically rolls its call options up when they are challenged in order to capture additional upside.
In the below chart, we are seeing how well of a job the fund is doing in capturing NVDA's upside so far in its short existence. Since the fund has been launched a couple of months ago, NVDA is up 54% while NVDY is up 28% (including dividends). As expected, the fund underperformed NVDA, as covered call funds tend to underperform their underlying stocks when their underlying stocks are having a monster rally. To be fair, it would have been nearly impossible for a covered call fund to capture all of a stock's upside when it jumps 54% in less than 3 months. Keep in mind that NVDY is still vastly outperforming S&P 500 by about 200%, but I wouldn't bet on this type of outperformance to continue forever.
If the fund was simply buying shares of NVDA and selling covered calls against it without actively managing, it would have probably missed out on most of these gains, because NVDA rallied very hard in a very quick fashion. When the fund first started a few months ago, NVDA was trading for $280, and if one sold covered calls at $300, they would have missed out on almost $140 per share in gains.
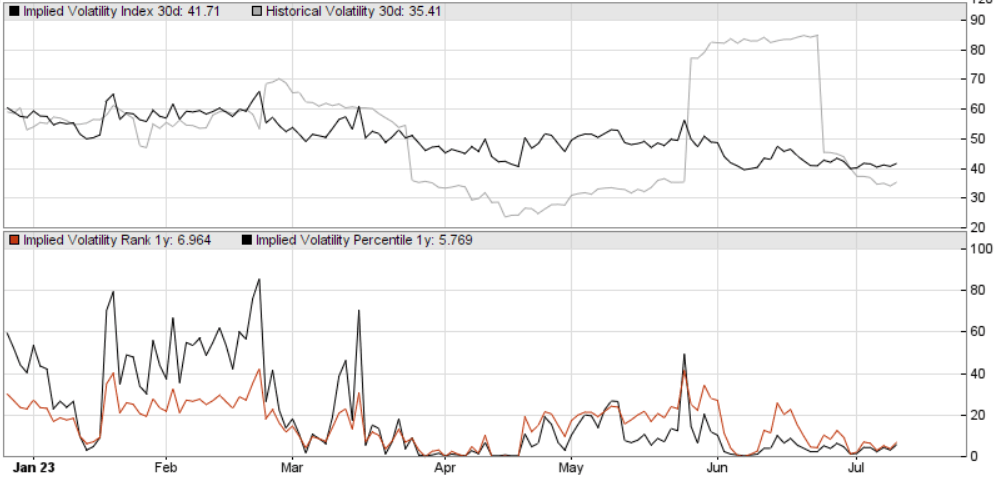
When it comes to funds that sell options for income, implied volatility is their bread and butter. Since most funds sell options against indices, they have to pay attention to the S&P VIX Index (VIX). Single-stock based funds like NVDY have to watch IVs specific to that single stock's options. Below is a chart showing implied volatility history of NVDA for the last year. It looks like NVDA's volatility has been dropping significantly in recent months, but even this reduced IV value points to 48%, which is still 4x the volatility of S&P 500 (measured by VIX).
Many times when volatility in options drops, we see funds reducing their dividend payments because their option income drops significantly. One recent example was JEPI, which had to reduce their dividends because VIX is down so much lately. NVDY sells its options out of the money (typically by as much as 10-15%) to capture some upside, so it can make money even in low volatility situations.
Having said that, you only want to invest in this fund if you are feeling bullish or at least neutral about NVDA. If you believe that NVDA is overvalued and deserves to trade at a much lower price, you probably don't want to be in NVDY, either. This fund is likely to lose a lot of value if NVDA quickly drops in value like it did in 2022. This is because the fund not only sells call options but also sells put options in order to fund the call options it is buying (as mentioned above). When you sell cash-secured put options against a stock, you can end up suffering pretty large losses if the stock tanks significantly.
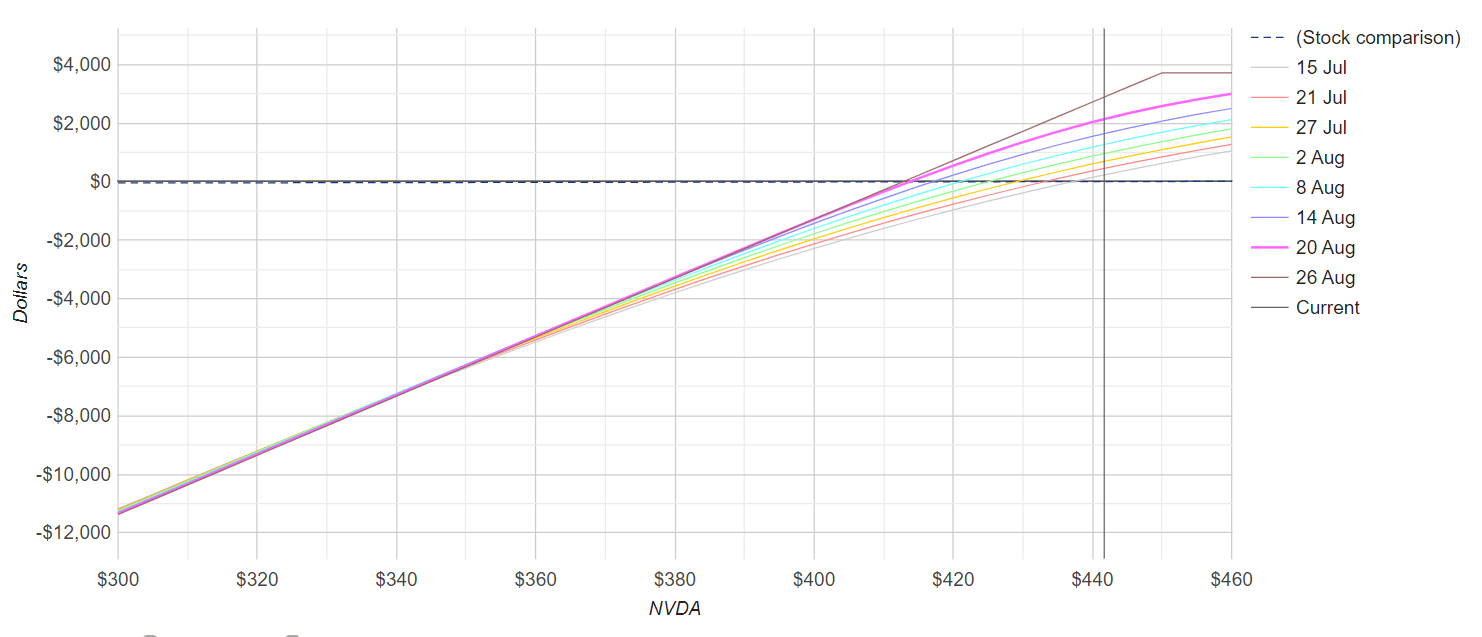
Below is a profit-loss potential of a hypothetical options play on NVDA that is very similar to ones being deployed by NVDY. Notice how severe the downside risk would be if NVDY suddenly dropped to the low $300s. Keep in mind that this assumes that the stock will drop in a quick fashion and that the fund won't make any adjustments to its play. I can imagine the fund managing its positions in order to minimize its losses in a situation like this, but there is only so much damage control they can do when a stock decides to tank.
Theoretical profit-loss profile of NVDY plays (Options Profit Calculator)
If you think NVDA can't drop like that, let me remind you that it dropped from mid $300s to $145 in about 6 months during last year's bear market (which may feel like forever ago to some people), so it is pretty much possible.
NVDY makes sense to buy and hold if you are cautiously bullish or at least neutral on Nvidia stock, but not if you are bearish on the stock. Also, it is probably not the best if you are super-bullish on NVDA, because in that case you might as well just buy NVDA. You can also buy a mix of NVDA and NVDY depending on how bullish you feel about NVDA. For example, if you are slightly bullish on NVDA, you can build a position that's 75% NVDY and 25% NVDA or if you are super bullish on it, you can build one that's 75% NVDA and 25% NVDY. You can also go 50-50 when you can't decide how bullish you are.
For further details see:
NVDY: Generating 50% Yield From Nvidia Options