ORLY - O'Reilly Automotive: Steady Or Stagnant?
2023-03-27 09:03:03 ET
Summary
- Revenue growth rates are projected to decline.
- Return on Net Tangible Assets is also declining.
- Still, these declines do not suggest a significant hit to long-term economic prospects.
Bottom Line Up Front
O'Reilly's ( ORLY ) growth rates have decreased when comparing revenue forecasts to prior years. This suggests that price appreciation returns are likely to be lower in the next two years than they have been in the past. This is also accompanied by a recent decrease in the company's return on net tangible assets. At first glance, this could scare off investors. However, when you combine the extremely stable business model in a recession-proof industry, for me this makes ORLY stock a strong buy.
O'Reilly Automotive Revenue Growth: Then and Now
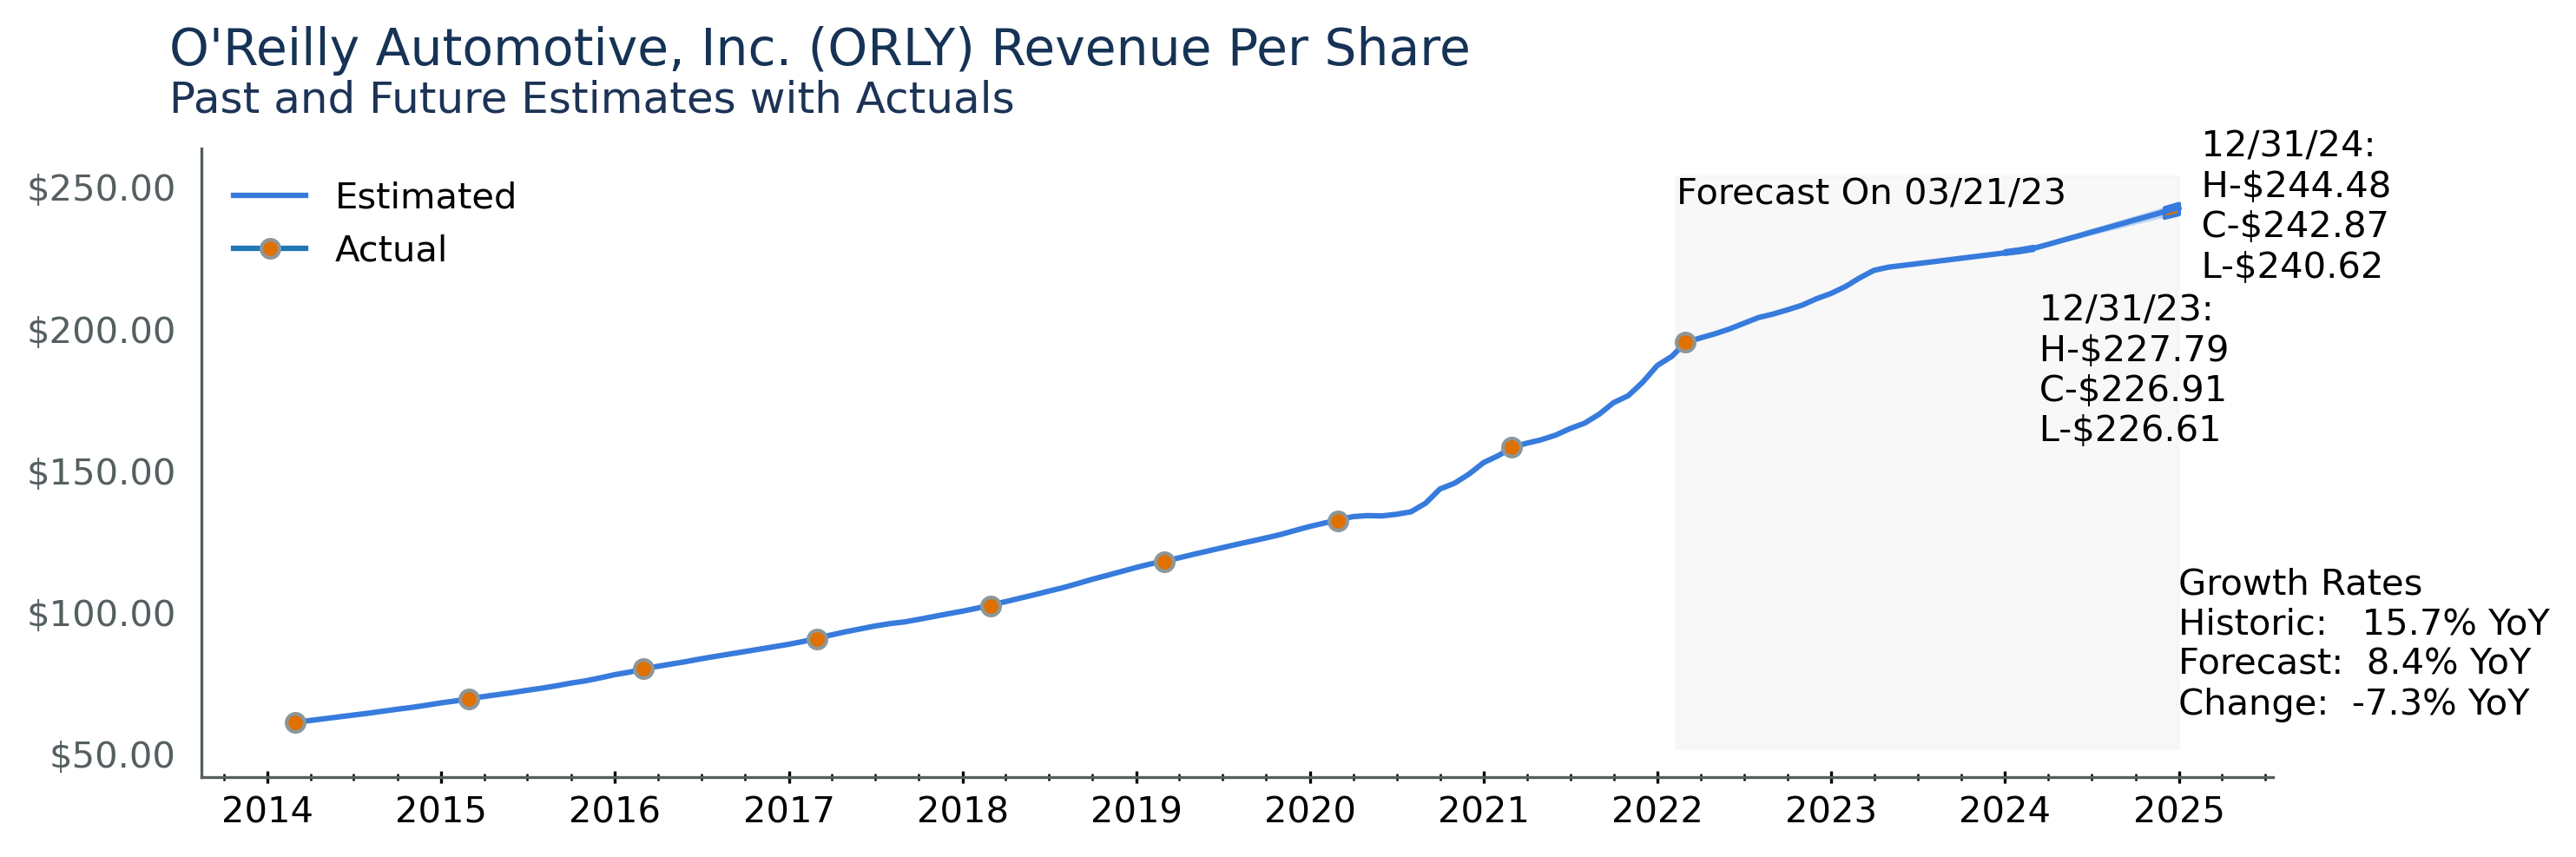
Taking a closer look at O'Reilly Automotive's revenue expectations, we can analyze the past revenue forecasts and actual revenue announcements. A comprehensive chart depicting the revenue of the last 8 years and projections for the upcoming 2 years is presented below.
Author's own image generated by proprietary software.
O'Reilly Automotive is expected to experience a revenue growth trend of 8.4% in the next two years, which is a decline of 7.3% from its historic growth trend of 15.7%. The decrease in revenue growth rates lends evidence to the case that O'Reilly may be stagnating. However, an 8.4% growth rate is still considered good, but some mean reversion is seen following high growth rates in 2021 and 2022. The revenue estimates for 2024 suggest that the company's revenue will be stable and in line with long-term trends, with an estimated range of $240.62/share to $244.48/share, and a mean estimate of $242.87/share. These estimates are for December 31, 2024, and show the revenue picture for O'Reilly Automotive looks steady.
Looking at the two plots above, you can observe the impact of estimate revisions. The smooth curves indicate that analysts are confident in their initial estimates, while any changes in curvature reflect fluctuations in analyst forecasts over time. Any shift in slope represents a modification in analyst estimates during that particular period. It is difficult to predict how earnings estimates will change in the future, but it is important to note that they could fluctuate significantly, especially for a company like O'Reilly Automotive.
O'Reilly Automotive's revenue expansion has likely been decelerating because of several reasons, including heightened competition, economic ambiguity, and shifting consumer habits. The firm has been encountering robust competition from online merchants and other physical outlets. Although Amazon is having trouble entering the market , they are getting better at it.
Long-Term Growth Potential
Warren Buffett uses a criteria based on unleveraged net tangible assets to evaluate a business's long-term economic potential. Essentially, he looks for businesses that can increase their earnings without requiring significant capital investments. This approach minimizes the amount of money needed to generate profits, which is crucial for long-term success. Applying these criteria to O'Reilly Automotive, it's clear that the company's strong financial position and efficient operations make it an attractive investment opportunity.
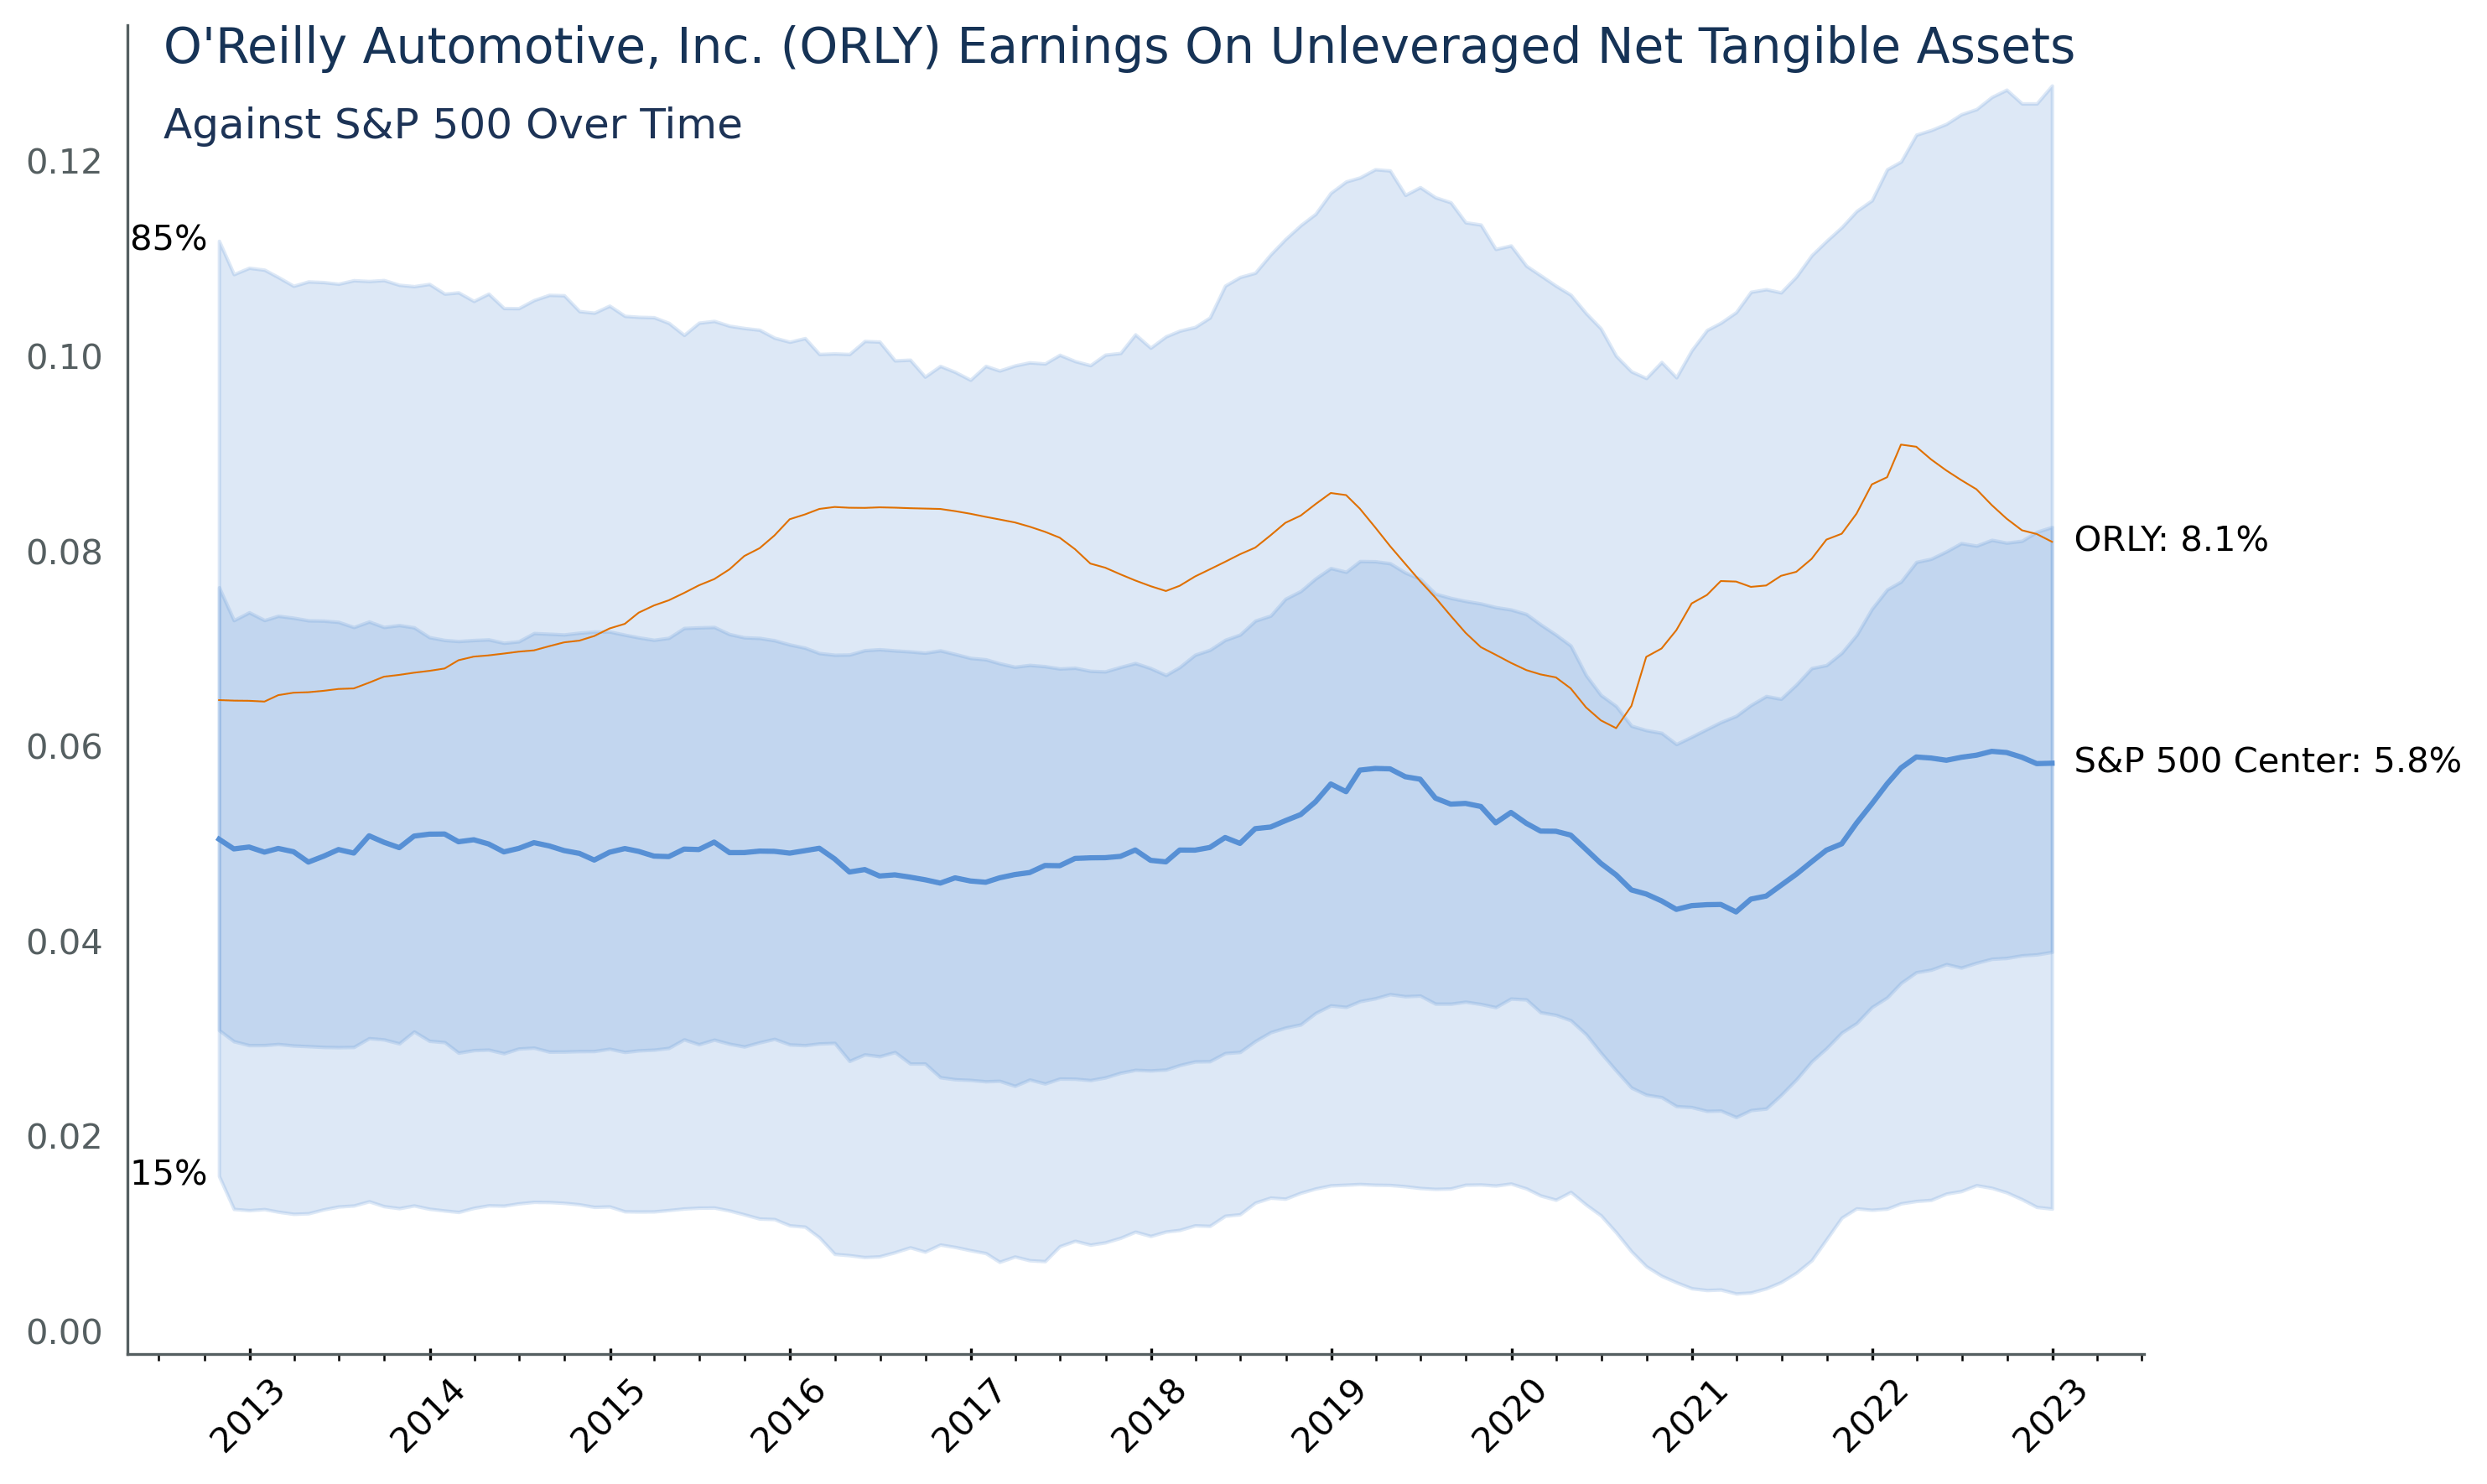
Displayed in the chart below is the positioning of O'Reilly Automotive in comparison to other companies within the Standard and Poor's 500. The blue-shaded region represents the distribution of all other companies in the index, while the orange line reflects ORLY's placement among them.
Author's own image generated by proprietary software.
O'Reilly Automotive boasts a Return on Unleveraged Net Tangible Assets of 8.1%, surpassing the S&P 500 median of 5.8%. This indicates that O'Reilly Automotive can achieve faster growth than many other companies while utilizing fewer resources.
O'Reilly Automotive is a company that has high Returns on Net Tangible Assets, as evidenced by their position above the blue region in the chart. This puts them in the category of good companies that can grow quicker than most. Warren Buffett's concept of having an ever-increasing stream of earnings with virtually no major capital requirements is something that O'Reilly Automotive approaches but does not exemplify. By unleveraging their assets to compare them on a risk-adjusted basis, we can see that this company needs less money to grow and can therefore grow fast.
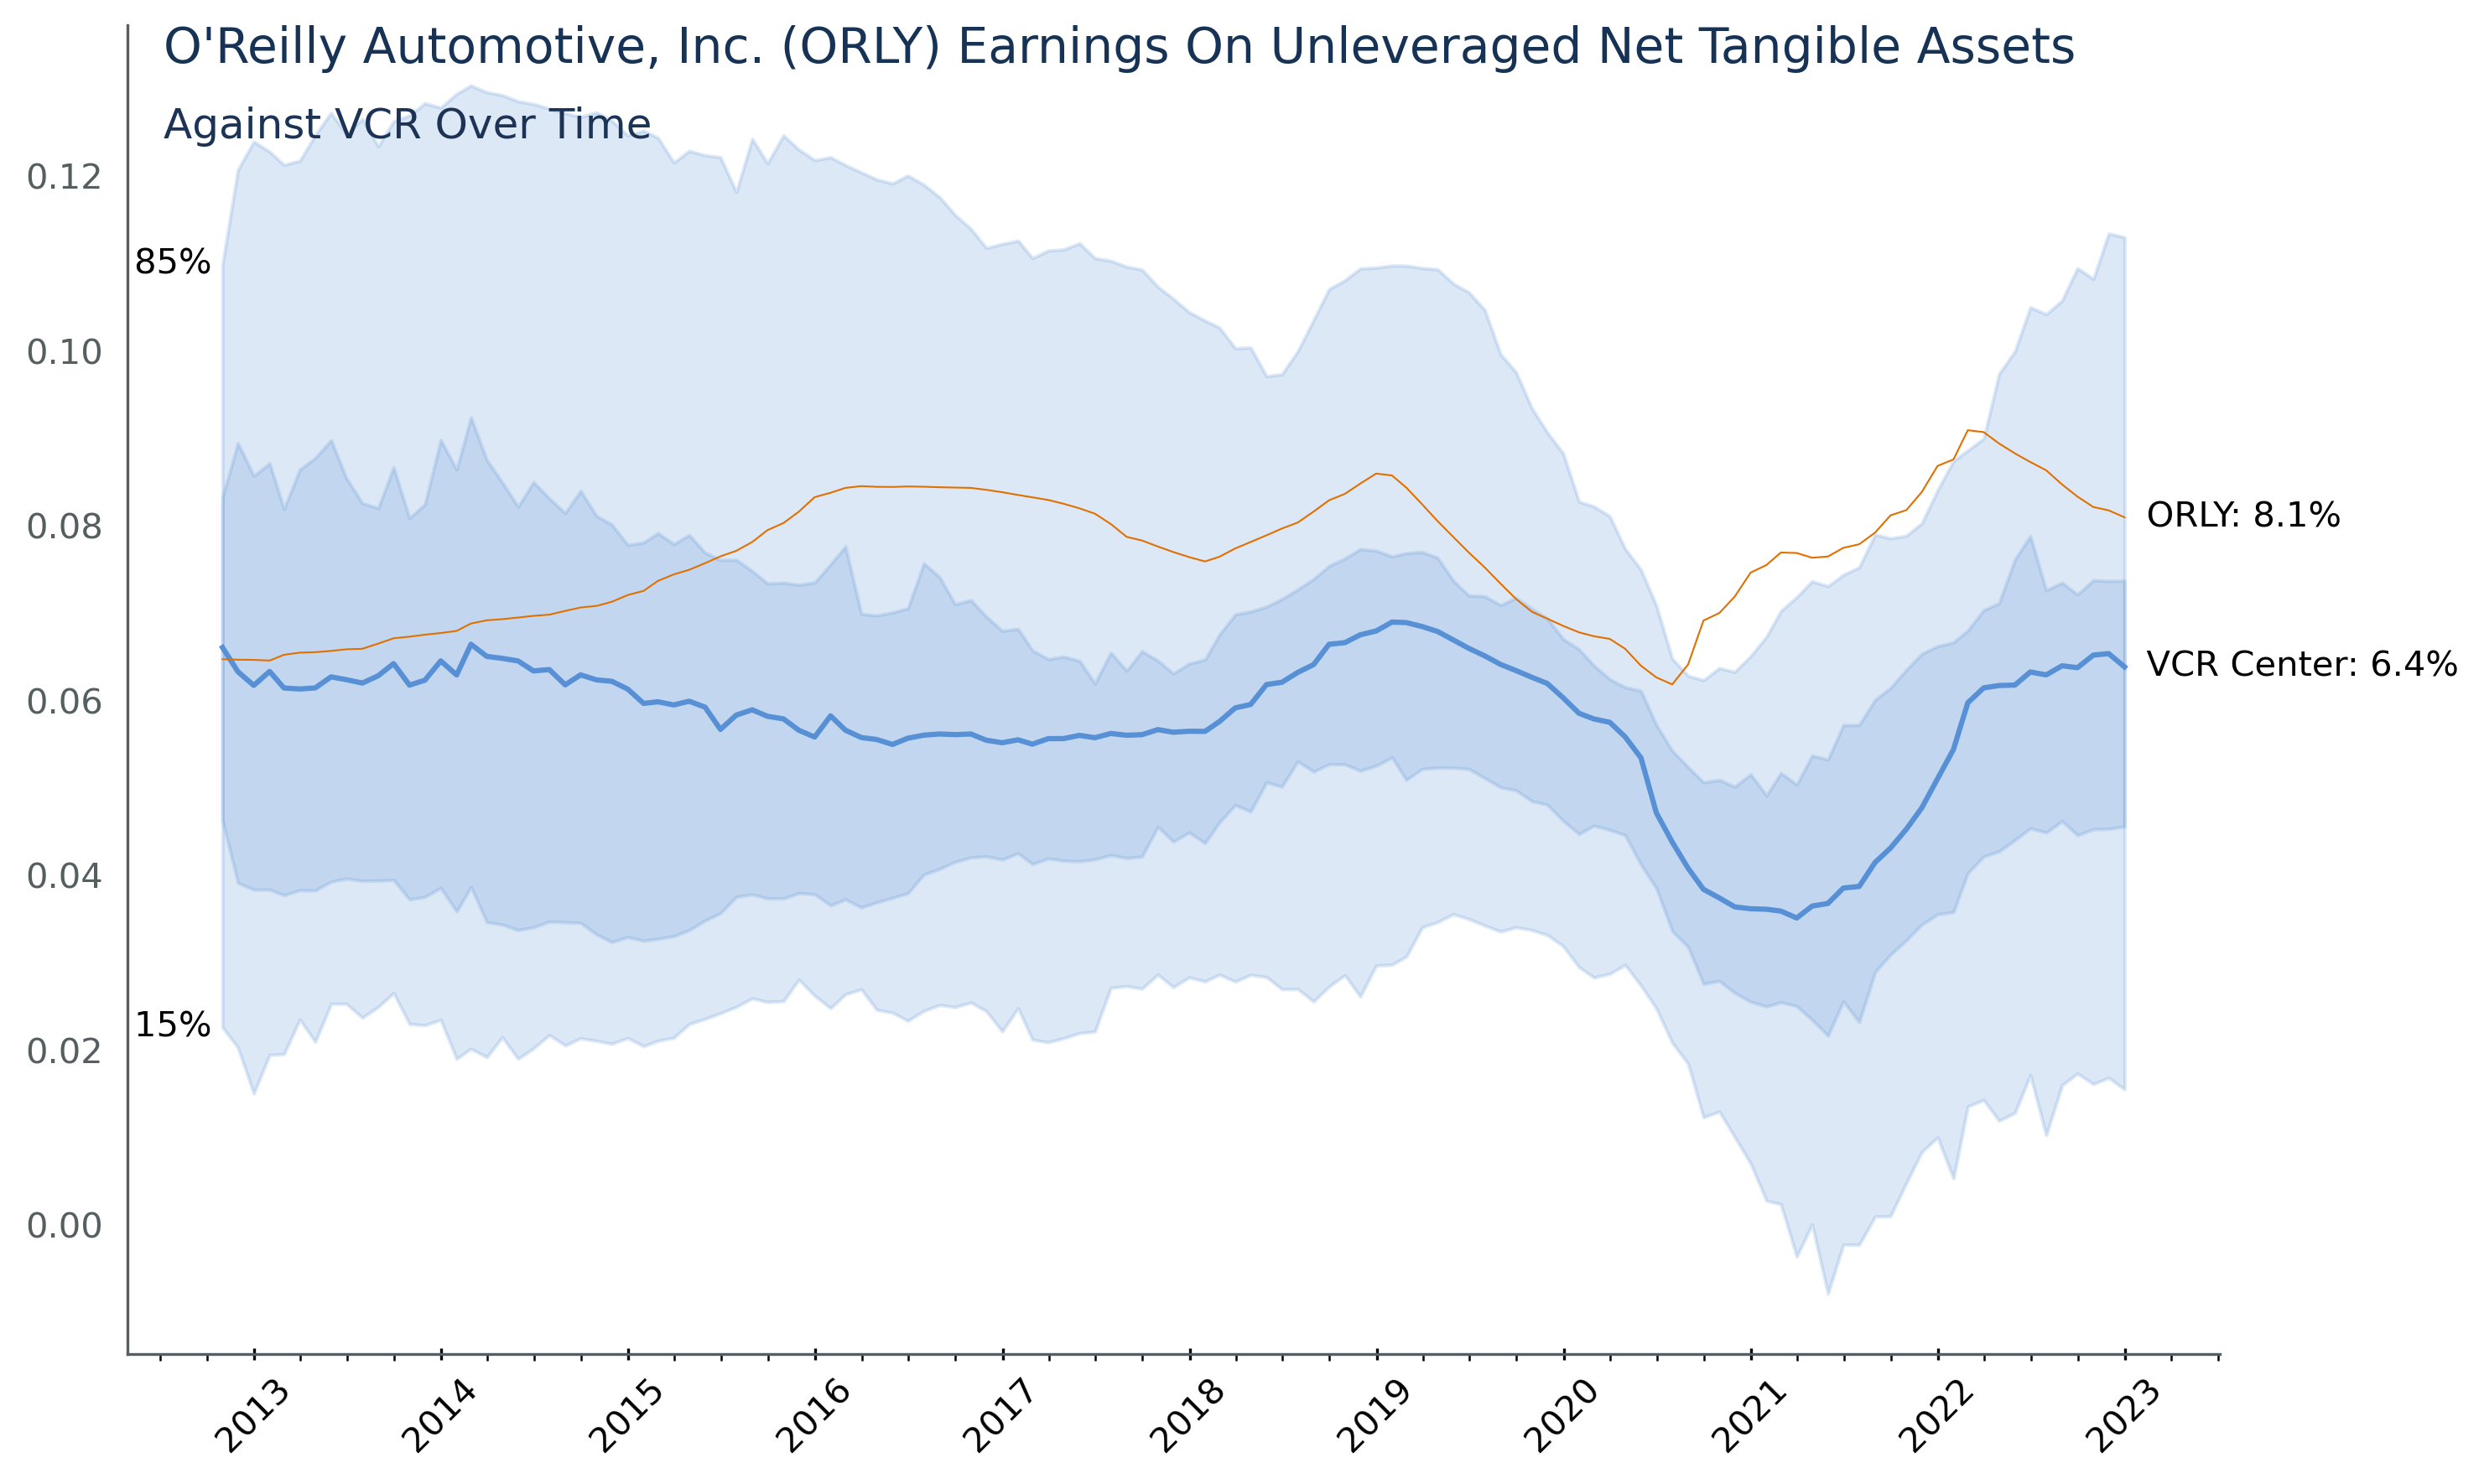
One could argue the present economic ambiguity has resulted in reduced consumer expenditure, which has affected the company's sales. I really don't buy it. Despite ORLY appearing in Vanguard's Consumer Discretionary Index Fund (VCR), car parts generally are not a discretionary item. If you need a part, you have to buy it or you can't get to work. I also believe that the 'slow down' in growth is really a return to pre-COVID growth rates. Did anyone else notice an increase in those loud mufflers during the lockdown? If that was a widespread thing, then O'Reilly has really just lost some consumer discretionary spending, but there has likely been little impact on its core business.
If we examine O'Reilly against the other Consumer Discretionary stocks, it seems to demand higher returns than most other discretionary stocks. Consumer discretionary firms frequently have higher returns on tangible assets than the remainder of the S&P 500 because they normally invest in rapid-growth, high-margin goods that hold the capacity to create greater returns. Also, consumer discretionary firms often have greater pricing capacity and fewer outlays related to manufacture, which permits them to make higher profit margins. Ultimately, consumer discretionary firms regularly have strong brand recognition, which gives them a superiority in the market and helps them to maximize their profits.
As seen in the chart below, O'Reilly is able to outpace even these companies.
This company generates more profit from its assets than other companies in the same industry, leading to a higher Return on Net Tangible Assets. This could be due to the company's concentration on efficient inventory management and beneficial supply chain relationships, which reduce expenses and increase profits. Moreover, ORLY boasts a robust brand reputation and devoted customer base, resulting in increased sales and profitability. ORLY's efficient asset utilization and formidable competitive advantages contribute to its superior Return on Net Tangible Assets.
Ultimately, this makes ORLY a strong by for the long term.
Thanks for reading. Let me know what you think in the comments below.
For further details see:
O'Reilly Automotive: Steady Or Stagnant?