OEF - OEF: Expensive Valuation And Patience Is Required
2023-09-26 14:00:32 ET
Summary
- iShares S&P 100 ETF tracks the S&P 100 index, but its valuation is expensive compared to its historical average.
- OEF delivered solid performance in 2023, but the broader stock market is still considered overvalued.
- Investors should wait on the sidelines as the economy may soon head for a recession.
ETF Overview
iShares S&P 100 ETF ( OEF ) basically tracks the S&P 100 index, which is an index that consists of 100 mega-cap U.S. stocks. Stocks in OEF's portfolio represents about two-thirds of the S&P 500's market capitalization. OEF's valuation is quite expensive based on a comparison of its current forward P/E ratio to its historical average. Given that the Federal Reserve is expected to keep the rate elevated or higher for a lengthy period to combat persistent inflation, an economic recession will likely be the ultimate outcome. In such a scenario, stock markets may try to test a new bottom. Although OEF may offer better downside protection than its small-cap and mid-cap peers, the fund price will inevitably also fall. Hence, there is still significant downside risk. Investors should patiently wait for a better entry point.
YCharts
Fund Analysis
OEF delivered solid performance in 2023
Last year was a challenging year for the broader stock market as the Federal Reserve aggressively raised the rate to combat inflation. Like many other equity funds, OEF declined significantly in most of 2022. Since reaching the trough in October 2022, equities have generally rebounded. The fund also had a solid performance in the past year. As can be seen from the chart below, the fund has delivered a total return of 26.1% in the past year.
YCharts
The fund's valuation is expensive relative to its historical average
Since the S&P 100 index represents about two-thirds of the S&P 500 index by market capitalization, we can quickly gauge the S&P 500 index valuation to see whether the S&P 100 index is overvalued or not.
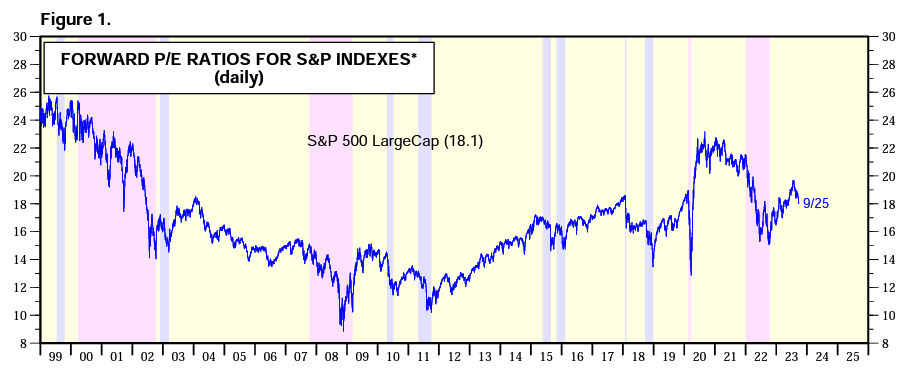
Below is a chart that shows the S&P 500's historical forward P/E ratio in the past 2 decades. As can be seen from the chart below, its current forward P/E ratio of 18.1x is towards the high end of its historical average since the end of the dot com bubble. Although this value has come down quite a bit from the high of over 22x in 2020 and 2021, this forward P/E ratio is still significantly higher than the forward P/E ratio range between 2005 and 2020. Therefore, it appears that OEF is overvalued.
One may argue that since there is still so much liquidity available in the market due to the Federal Reserve's massive expansion of its balance sheet in the past 2 decades, this valuation is still reasonable. To check whether the overall market is reasonable or not, we can also take a look at another indicator called the revised Buffett Indicator.
Given that many readers may not know what exactly the Buffett Indicator is, it is necessary to provide a quick overview. In a Forbes interview in December 2001, Warren Buffett recommends using the ratio of total market capitalization to GDP to evaluate whether the broader stock market is overvalued or not. According to Warren Buffett, if the total market capitalization to GDP ratio is in the range between 75% and 90%, the market's valuation is considered reasonable. If this ratio is above 90%, the stock market is expensive. If this ratio is above 120%, the broader stock market will be very expensive.
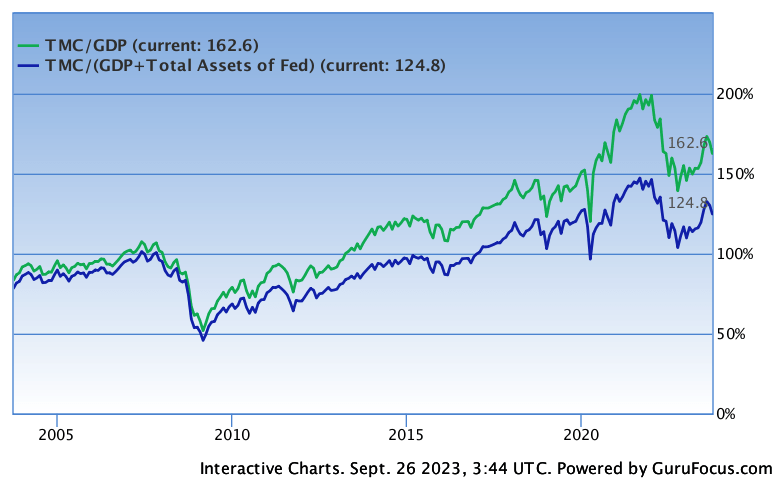
Since we need to take into consideration of the Federal Reserve's balance sheet, the denominator of the equation needs to be revised to include total assets of the Federal Reserve. Taking this into consideration, the revised ratio is equal to the total market capitalization divided by (GDP + Fed Assets ratio). Using this equation, the ratio is currently about 124.8% as shown by the chart below. While this ratio has declined significantly from nearly 150% during the peak of the pandemic, it is still quite elevated compared to the period between 2008 and 2019. Therefore, we think the broader market is still quite expensive. Since the S&P 100 index represents over half of the entire U.S. equity market by capitalization, we think OEF is also expensive.
Large stocks typically done better in a recessionary environment
While OEF appears to be expensive based on our valuation analysis, the good news is that the fund actually should do better in an economic downturn. As can be seen from the chart below, OEF declined a little over 30% at the outbreak of the pandemic in 2020. On the other hand, its small-cap and mid-cap peers iShares Core S&P Small-Cap ETF ( IJR ) and iShares Core S&P Mid-Cap ETF ( IJH ) both declined by over 40%. Therefore, mega-cap funds such as OEF appears to offer better downside protection in an economic recession.
YCharts
We also saw similar results during the Great Recession in 2008 and 2009. As can be seen from the chart below, OEF also declined less than IJR and IJH. The fact that mega-cap stocks offer better protection is easily understandable. These stocks typically have better balance sheets than smaller peers and have built a strong business base. Hence, they are in better shape to weather any storms.
YCharts
While OEF may offer better protection than its smaller peers, its fund price will inevitably decline. As the two charts above shown, OEF's decline in the past two recessions were over 30% and 50% respectively. Therefore, the fund is also vulnerable in an economic recession.
Will there be a recession coming?
The question investors may want to ask is whether there will be a recession arriving or not. At the moment, we think the possibility of an economic recession is very high. This is because the Federal Reserve is expected to keep the rate elevated or higher and for longer in order to combat persistent inflation. One may ask why the recession has not yet arrived. This is because the impact of rates usually takes about 6~12 months to propagate to the economy. Therefore, we may not have seen the full impact of the rate hike in the first half of 2023 but should begin to see the impacts towards the end of the year and in the first half of 2024.
Given that the stock market usually bottoms during an economic recession, and not before an economic recession, we may see the market trying to test a new bottom in the foreseeable future. Therefore, we believe downside risk is quite high at the moment. Since OEF's valuation is quite high, investors should not ignore this downside risk.
Investor Takeaway
While OEF may offer better downside protection than its small-cap and mid-cap peers, there is still significant downside risk. We believe investors may want to stay on the sidelines and wait for a better entry point.
For further details see:
OEF: Expensive Valuation And Patience Is Required