OFS - OFS Capital: Trading At A Discount To Net Asset Value
2023-07-10 10:29:26 ET
Summary
- OFS Capital has returned around 10% to its shareholders over the last year and trades at a 27% discount to NAV per share.
- The company reported a total investment income of $14.28 million, up 30.5% from the previous year, driven by floating rate loans that benefited from a hiked Fed funds rate.
- A 65% increase in net investment income meant the dividend was covered by 112%.
OFS Capital ( OFS ) trades at a $131 million market cap and is among the smallest publicly traded business development companies. Externally managed by Chicago-based OFS Capital Management with $4.1 billion in assets under management, the BDC has returned around 10% to its shareholders on a total return basis over the last year. It last declared a quarterly cash dividend of $0.33 per share , in line with its prior payment and for a 13.5% forward annualized dividend yield. The yield is broadly at the same level as its pre-pandemic payouts as a quarterly distribution that was cut by $0.17 has gradually recovered over the last three years. In view of shareholders is more growth and a break from the predictable stagnation of the current distributions. Indeed, the payout has stayed the same since the BDC started trading in 2012.
Critically, with the BDC's common shares currently swapping hands for $9.78, it's trading at a 27% discount to NAV per share of $13.42 as of the end of its fiscal 2023 first quarter. Only a narrow band of BDCs trade at such a marked discount to NAV, a band highly defined by dividend cuts during the pandemic and the precarious periods of coverage that followed in the years after. Is OFS a buy on the back of what's effectively a stock trading for 73 cents on the dollar? It depends. BDCs that trade on a discount to NAV do so for a reason as any such discount can be closed by a stock price declining further. Further, the stock price could meander to the inherent oscillations of NAV whilst still trading at a discount in perpetuity. However, OFS has done a good job of managing NAV over the last decade with the current discount being larger than its pre-pandemic average.
Dual Beats As Dividend Coverage Spikes Up
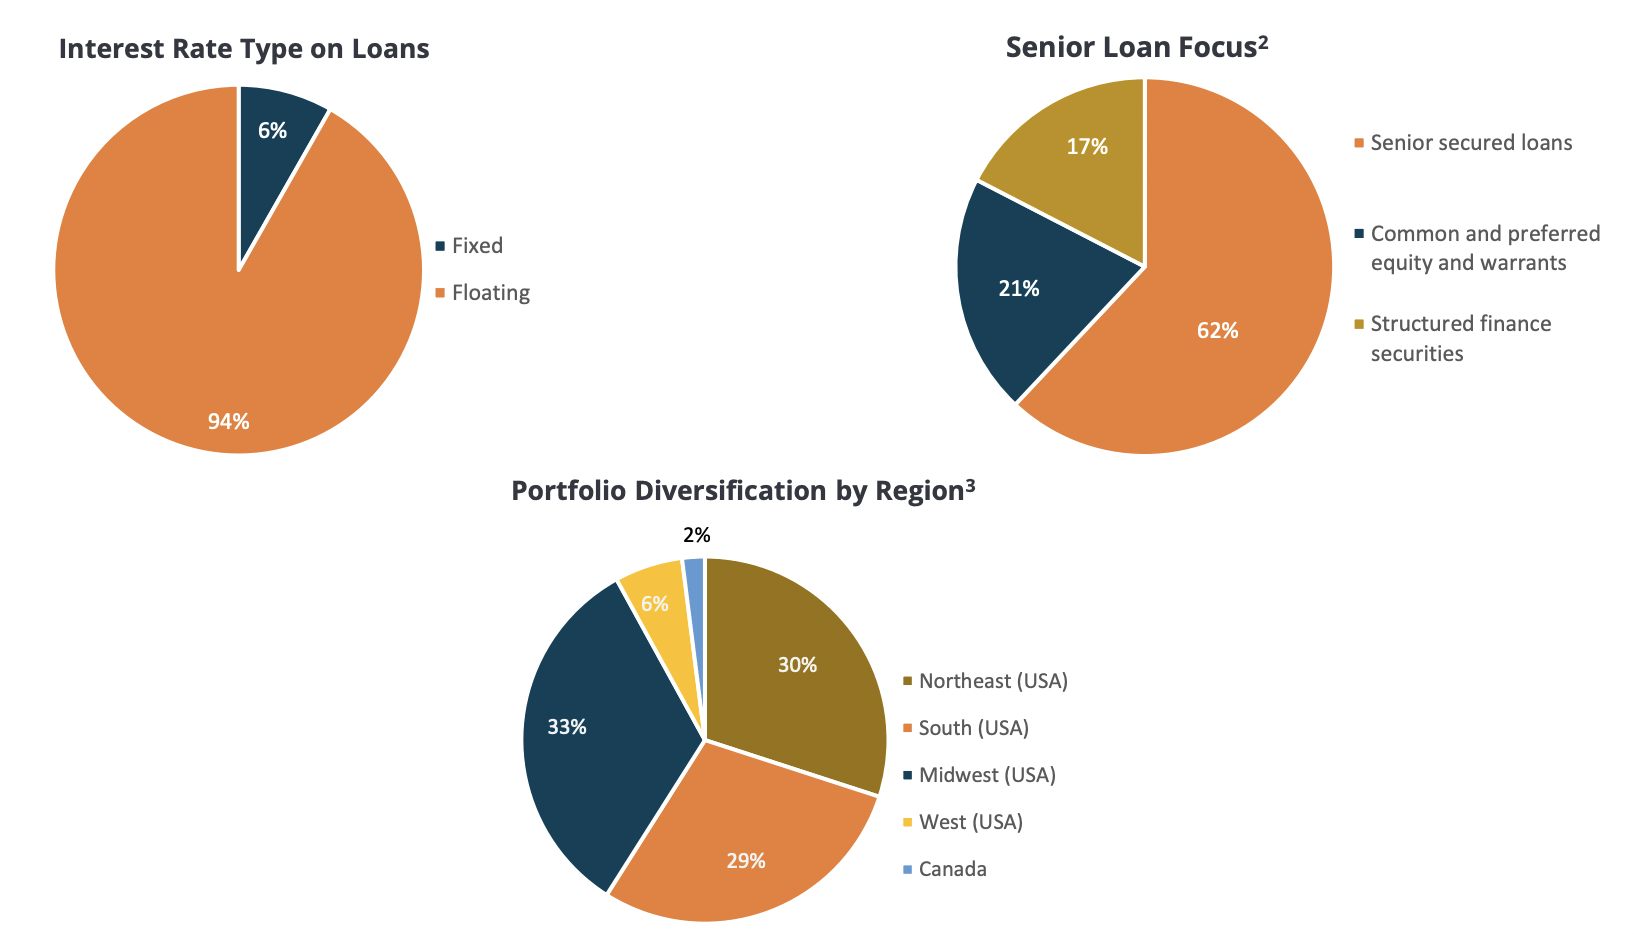
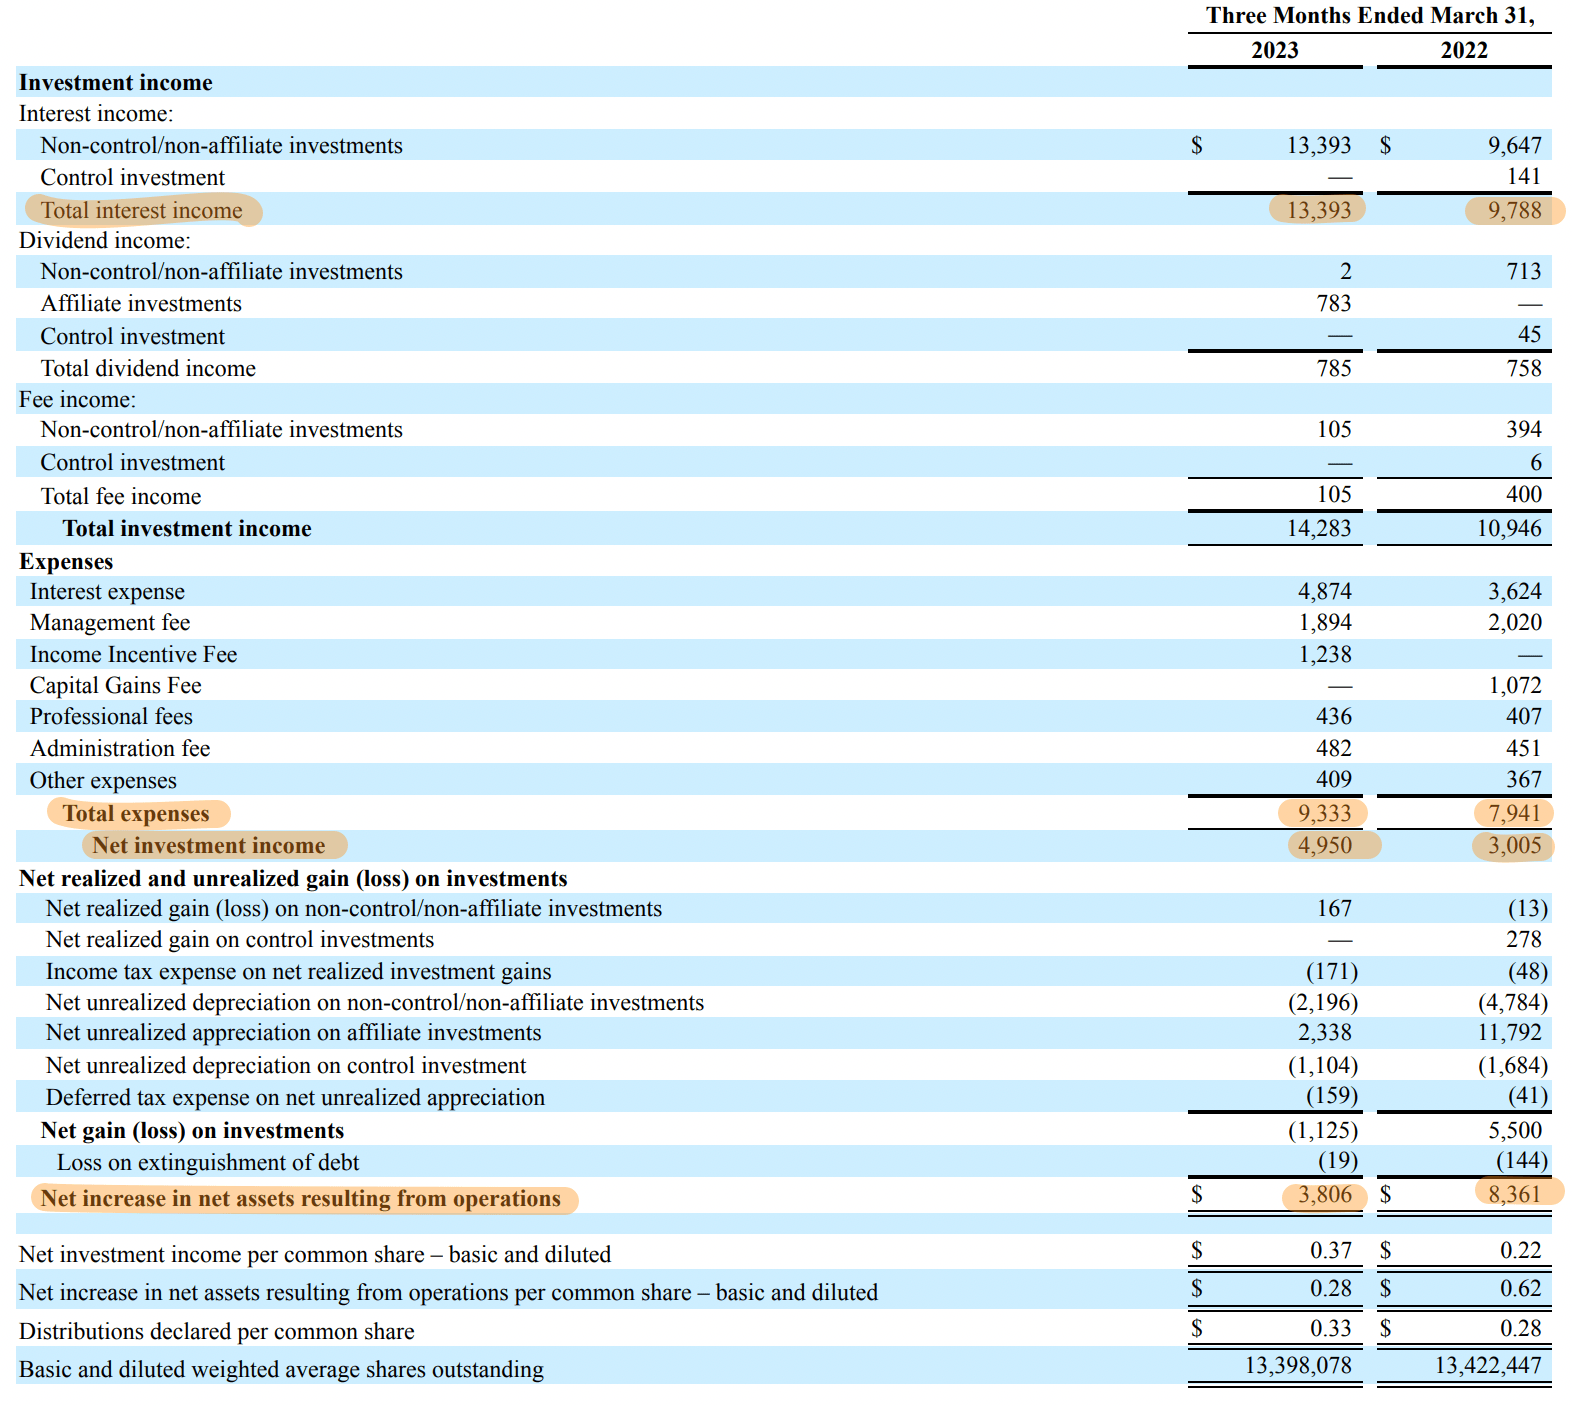
OFS reported a total investment income of $14.28 million , up 30.5% from $10.95 million in the year-ago comp and a beat by $105,500 on consensus estimates. The growth was driven by floating rate loans that benefited from a Fed funds rate that has now been hiked to its highest level since 2008. This now sits at 5% to 5.25% following a pause at the June FOMC meeting. Floating rate loans comprised 94% of OFS's loan portfolio as of the end of their first quarter. The BDC has a focus on middle-market companies and typically makes investments that range from $5 million to $35 million per transaction. The portfolio had a weighted average realized income yield on interest-bearing investments of 11.8% during the first quarter.
OFS Capital Fiscal 2023 First Quarter Presentation
Critically, whilst the loan portfolio has an exclusively senior loan focus this formed 62% of the BDC's investment portfolio with common and preferred equity and warrants forming 21% of the portfolio and 17% being in structured finance securities. These are mainly collateralized loan obligations from debt to subordinated notes and loan accumulation facility positions. An investment portfolio with only a 62% focus on loans rapidly ramps up the risk profile of the BDC and exposes shareholders to more volatility, especially with the debt tranche of CLOs which, whilst diversified across a pool of sub-investment grade corporate loans, are highly levered and incredibly sensitive to rate rises.
OFS Capital Fiscal 2023 First Quarter Form 10-Q
Total expenses increased by 17.5% for a net investment income of $4.95 million, a 65% increase over the year-ago comp. This meant NII per share of $0.37, a beat of $0.02 on consensus estimates and growth of $0.15 over the year-ago quarter. This meant the BDC was able to cover its dividend by 112% during the quarter.
Will The Quarterly Dividend Be Raised Above $0.33 Per Share?
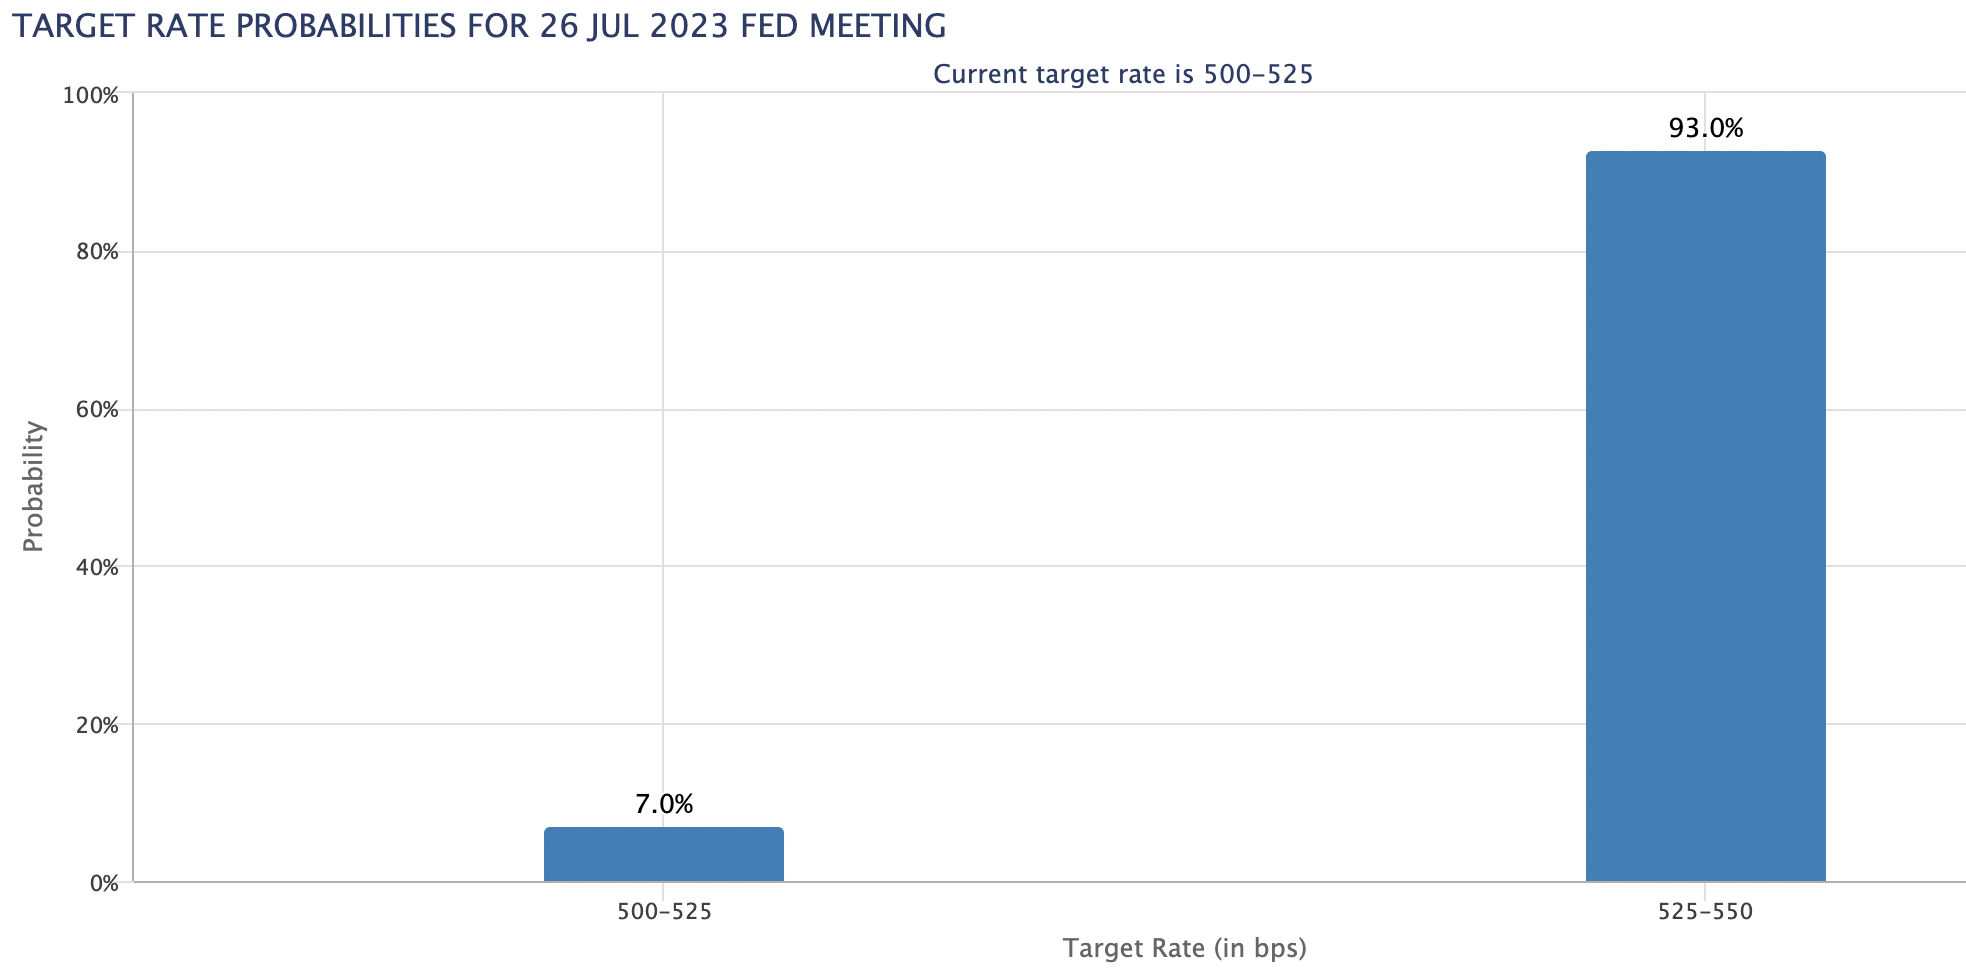
The BDC is paying out around 90% of its NII per share as a dividend. The dichotomy between the 11.8% yield realized by OFS on its interest-bearing investments, before fees, and the larger 13.5% yield paid out to shareholders is due to its marked discount to NAV. This presents the core investment pitch for the BDC against an income set to be supported by what's expected to be an extended period of elevated interest rates. The market now expects the Fed to raise rates by at least 25 basis points at their upcoming July 26th FOMC meeting with the CME FedWatch Tool placing this at a 93% probabilit y, up from 86.8% just a week ago.
CME FedWatch Tool
Hence, the floating rate allocation of the BDC will help to continue to reel in strong year-over-year NII growth through to mid-2024 when rates are expected to begin to decline. This assumes the US economy skips a hard landing that would most likely pull up investments on non-accrual status. These formed 2.3% of the BDC's total investment portfolio as of the end of the first quarter. OFS is a hold against what's set to be an elevated interest rate environment.
For further details see:
OFS Capital: Trading At A Discount To Net Asset Value