OCCI - OFS Credit Company Compared To Two CLO CEF Peers: OXLC And ECC
Summary
- OFS Credit Company is a much smaller peer to Oxford Lane Capital and Eagle Credit Company.
- All three of these closed-end funds have investment focus on CLO strategies, particularly CLO equity.
- In this article, I'll take a look at OCCI and compare it to these peers to get a sense of the funds.
- The short version: OCCI has established a five year trend of value destruction, ownership dilution, and expense extraction.
OFS Credit Company, Inc. ( OCCI ) is a non-diversified closed-end fund or CEF which invests primarily in collateralized loan obligations ((CLO)). It is a micro-cap peer to both Eagle Point Credit Company Inc. ( ECC ) and Oxford Lane Capital ( OXLC ) which get a fair bit of attention on Seeking Alpha due in part to their high dividend yield.
In particular one of the most followed contributors here on Seeking Alpha with nearly 100,000 followers, Rida Morwa has been bullish on both OXLC and ECC in the past year. In December 2021 Rida introduced Oxford Lane Capital as their first “ Pick of the Year for 2022! ” Since then OXLC generated total returns higher than the S&P 500, but still lost around 9% in value.
Seeking Alpha: OXLC Performance Since Rida Article.
Just last week Rida included ECC as one of two stocks highlighted in an article entitled “ Bet Your Retirement Income on the USA ” [The other stock highlighted incidentally is one I wrote up in September 2022 which I think still has value: BrightSpire Capital ( BRSP )]. The thesis seems to be that despite a possible recession in 2023, ECC is well-positioned given their book does not have a lot of maturities coming up until 2025. Rida states,
“This is a benefit because defaults tend to be most frequent when loans mature. With the economy likely to weaken in 2023, ECC has very little exposure to companies that will be forced to refinance when there are dual headwinds of high-interest rates and a weakening economy. If there is a recession in 2023, it's best not to hold a lot of loans that are maturing mid-recession.
It is this kind of proactiveness from ECC's management that gives us the confidence to continue holding and collecting the massive +15% yield.”
As is often with these CLO funds the high dividend yield is emphasized. What is overlooked is the exorbitant management fees these CEFs are charging and history of value destruction. As I’ve written about OXLC in a previous article , one must be careful that management isn’t eating your capital.
OFS Credit Company released their annual report on January 12th, 2023 and I thought this would be a good time to compare this fund to peers OXLC and ECC. With this article investors can get a bit more of an overview of the CLO CEF landscape to better understand the risks, and potential rewards.
What Are CLOs?
Before we start our analysis it may help to review what collateralized loan obligations are. Guggenheim Investments describes them as:
“CLOs are a $910 billion asset class within the broader $12 trillion structured credit fixed-income market, which also includes asset-backed securities ((ABS)). CLOs derive principal and interest from an actively managed, diversified pool of non-investment grade, senior-secured corporate loans.
CLOs use funds received from the issuance of debt and equity to investors to acquire a diverse portfolio of typically more than 200 loans. The debt issued by CLOs consists of a variety of tranches, each with a risk/return profile based on its seniority and claim priority on the cash flows produced by the underlying loan pool.”
Higher risk is implied by the non-investment grade rating, yet there’s a tactic employed to theoretically reduce risk through broad diversification of hundreds of loans. Additionally, the loans are senior-secured and typically occupy a first-lien position in a company's capital structure. What this means is that each CLO is an investment vehicle composed of hundreds of other loans to corporations around the United States.
CLOs themselves are broken down into a capital structure where debt tranches with ratings from AAA to BB are sold to raise the money to purchase the portfolio of loans. Essentially this means that CLOs raise money, buy loans, repackage them, and then sell them back to investors. They even have their own managers, and keep a lot of other people in business as according to Reuters they are the largest buyers of leveraged loans .
Guggenheim Investments: CLO Capital Structure Example.
Debt payments from the underlying pool of loans are consolidated and distributed to investors of these various tranches. Those with the highest rated AAA tranches are paid first while those with equity tranches at the bottom of the capital stack are paid last .
Corporate Finance Institute: CLO Tranche Risk and Return.
According to a working paper from the Philadelphia Fed investigating CLO performance, the average IRR for CLO equity tranches was 9.88%. They stated further that:
“Our central finding is that CLO equity tranches provide statistically and economically significant abnormal returns, or "alpha," against a variety of public benchmarks. Using the generalized public market equivalent (GPME) framework of Korteweg and Nagel (2016), we find that the average completed CLO equity investment offers a net present value ((NPV)) of 66 cents per dollar invested, net of fees. This estimate equates to approximately $33 million, or 6.6% of total assets, for the typical deal.”
As we’ll see in a second these equity tranches are predominantly what OCCI, OXLC, and ECC are invested in. The Fed’s research gives us a benchmark figure grounded in data of around ~10% returns on these tranches. Our research will look into how these fund’s returns stack up to this benchmark.
This is a brief summary introduction to CLOs, and they are not a simple topic in my judgment. If you find yourself reading this and still wondering how these things work, then OFS Credit Company is not a wise investment. If you do not understand something, don’t put your money on it. That goes for OXLC and ECC as well.
History and Strategy of OFS Credit Company
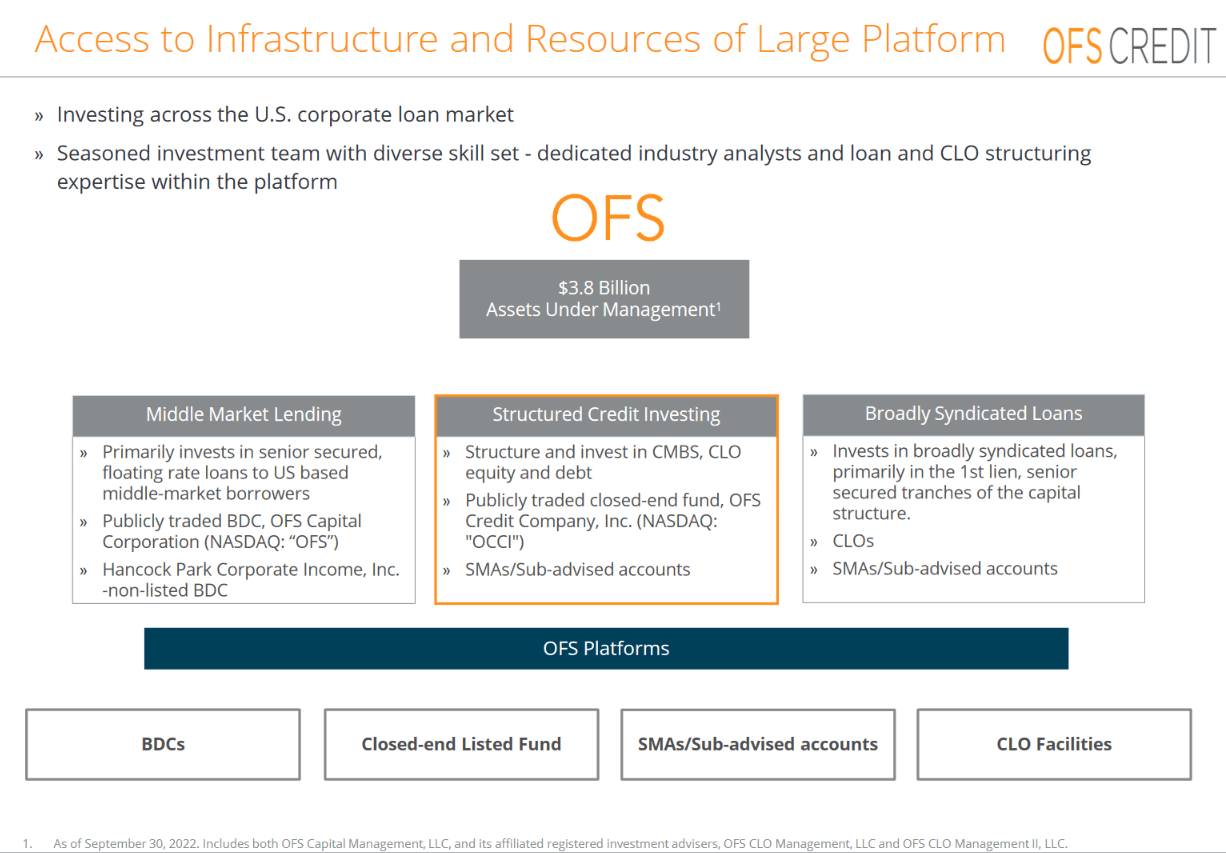
The company was established in 1994 as an offshoot of OFS Capital ( OFS ) and part of a group of firms controlled by Richard Ressler that own, operate, and manage more than $35 billion of real assets and corporate credit. Since 1994, OFS Capital has invested over $20 billion in more than 10,000 transactions. At present OCCI manages $3.8 billion in assets.
December 2022 Investor Presentation: OFS Platform Structure.
We can see that their stated focus has been on CLO equity and debt. These components make up 91.4% of their portfolio – with a heavy weighting towards CLO debt.
December 2022 Investor Presentation: Portfolio Composition.
The company originally priced its initial public offering of 2.5 million shares of common stock at $20.00 per share in October 2018. Their stock price opened at $19.00 which it only saw once more before establishing a long term decline to where it trades today at $9.54. That means the stock has shed around half its value in five years.
Not only has the stock declined in value, shares outstanding have ballooned from ~2.5 million to 9.4 million. Owners from 2018 have seen their ownership interest significantly diluted by this 276% growth of shares while value has evaporated.
Net asset value ((NAV)) per share in their first few months was $20.11. As of January 12th, 2023 it was reported at $9.98 translating to around half of its value lost in just five years. The annualized rate-of-return would be a loss of 10% each year – completely opposite of the Fed’s benchmark IRR of +10%.
Despite CLO equity tranche performance being so good that the Fed is investigating it, OFS Credit Company has managed to invert expectations into the reality of capital destruction. This pattern of NAV erosion was apparent with Oxford Lane Capital as well which saw a -71.7% decline of NAV in twelve years (-6% annually).
OFS Credit Company Expense Ratio
There would need to be a very compelling reason for me to want to invest alongside managers who have destroyed half of original NAV in just five years. What’s astonishing is that investors are actually being charged massive fees for this destructive performance.
2023 Annual Report: Expense Ratio.
Total expense ratio on NAV of $9.98 is 17%. When you look at your stock charts and see OCCI trading you are being offered the opportunity to have 17% of your capital expensed by managers who have eroded NAV by -10% each year.
Sounds enticing, right?
OXLC and ECC last reported expense ratios of 10.84% and 12.79% respectively. This puts OCCI on the very high end of peers. And it alone is enough of a reason for me to put this in the sell pile. An established history of NAV destruction and common share dilution remind investors of the results they are likely to see.
OFS Credit Company Compared to OXLC and ECC
Let’s take a look at some peer metrics to get a better sense of OCCI as an investment. Here are some baseline statistics regarding the three funds.
| Ticker |
| Stock Price |
| Market Capitalization (millions) |
| P/B |
| Annual Dividend Yield |
| Expense Ratio |
| % of Portfolio in CLO Equity |
| OCCI |
| $9.54 |
| $89.50 |
| 0.96 |
| 23.06% |
| 17.05% |
| 89.70% |
| OXLC |
| $5.69 |
| $902.50 |
| 1.15 |
| 15.82% |
| 10.84% |
| 97.00% |
| ECC |
| $10.51 |
| $459.10 |
| 1.03 |
| 15.98% |
| 12.79% |
| 76.10% |
We can note here the size difference between OCCI and its peers. The stock is very nearly trading at book value at 0.96x which is also its three-year average P/B. The small differential between OCCI and the other two funds in valuation is more pronounced if we look at the dividend yield.
Recall earlier that the average returns for CLO equity positions according to the Fed is around 10%. When compared to the dividend yields of these companies it seems rather difficult to imagine the math working out over the long term. Average annualized returns of 10% simply would not cover the 15-23% dividends implied here.
And what more can be expected but average results from the types of portfolios that are being built. Take OXLC for instance with their portfolio of 221 investments inclusive of CLO debt and CLO equity positions. The total number of underlying loans across these 221 investments totaled 2,003 as of September 2022 . These loans are spread across 1,717 obligors which represents the number of companies that OXLC needs to keep tabs on.
Eagle Credit Company similarly manages a portfolio with 1,868 unique underlying loan obligors as of December 2022 .
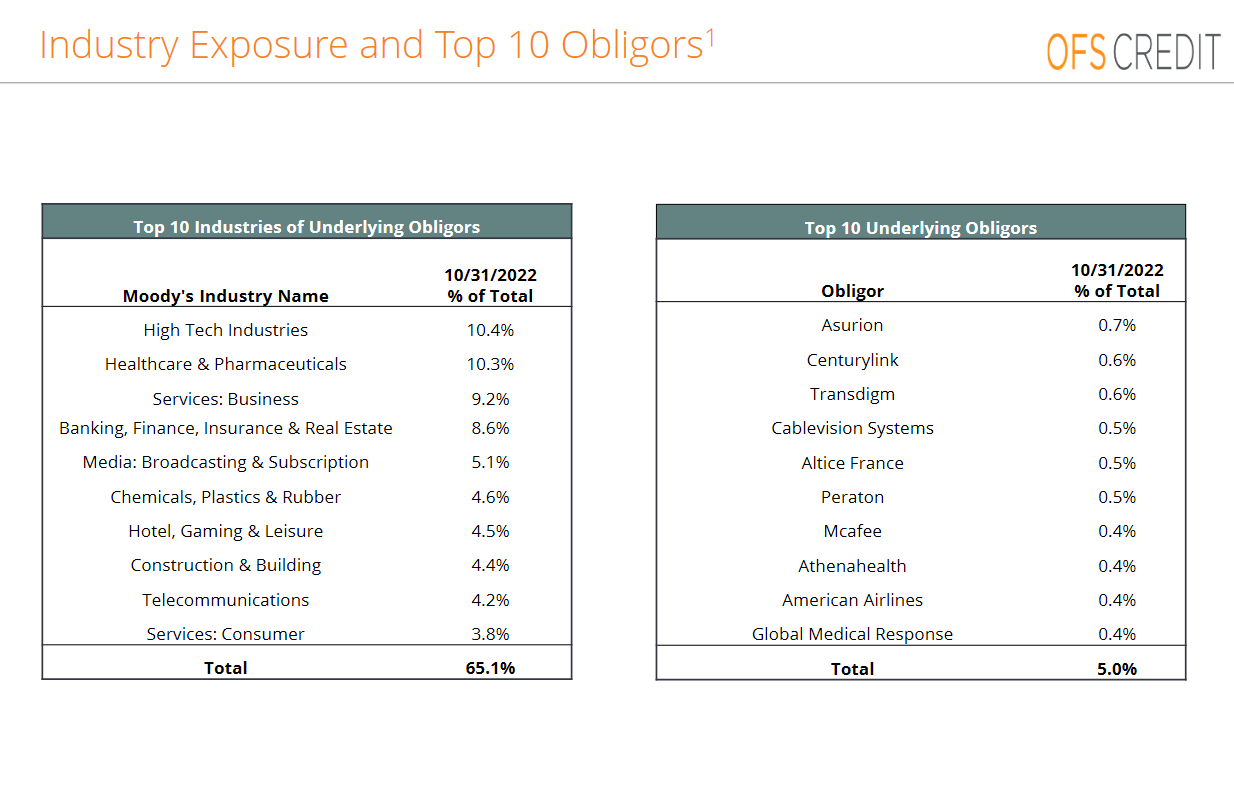
OFS Credit Company doesn’t even break out this data for investors. What we do know is that in October 2022 their top 10 underlying obligors made up 5% of their total. If we assume an average allocation of 0.3% for the rest of the portfolio that would imply around 320 different obligors.
October Fact Sheet: Underlying Obligors.
As someone that tries to keep up with an active portfolio involving nine different companies, the idea of managing hundreds of positions is mind-boggling to me. I align more with the idea that diversification is a protection against ignorance. As Warren Buffett said,
“If you know how to analyze businesses and value businesses, it's crazy to own 50 stocks or 40 stocks or 30 stocks, probably, because there aren't that many wonderful businesses that are understandable to a single human being, in all likelihood.
And to have some super-wonderful business and then put money in number 30 or 35 on your list of attractiveness and forego putting more money into number one, just strikes Charlie and me as madness.
And it's conventional practice, and it may -- you know, if you all you have to achieve is average, it may preserve your job. But it's a confession, in our view, that you don't really understand the businesses that you own.”
A Note of Possible Pricing Inefficiency
I recently wrote an exclusive article for the Microcap Review about a commercial mortgage REIT. The company is a balance sheet lender meaning they directly originate loans typically secured by real estate. Notably this company and the eight peers I compared it to operate as CLO managers and directly originate the underlying loans which sometimes comprise them.
I bring all of this up because across the group the average P/B rating was 0.66x. Management from these companies have discussed deterioration in markets amidst a looming recession and the need to be conservative moving forward.
| Peer |
| P/B |
| Market Capitalization (Millions) |
| Starwood Property Trust ( STWD ) |
| 0.96 |
| $6,200 |
| Ladder Capital Corp ( LADR ) |
| 0.92 |
| $1,400 |
| Blackstone Mortgage Trust ( BXMT ) |
| 0.85 |
| $4,000 |
| Ares Commercial Real Estate Corp ( ACRE ) |
| 0.80 |
| $630 |
| BrightSpire Capital |
| 0.66 |
| $940 |
| KKR Real Estate Finance Trust ( KREF ) |
| 0.66 |
| $1,100 |
| TPG RE Finance Trust ( TRTX ) |
| 0.56 |
| $615 |
| Granite Point Mortgage Trust ( GPMT ) |
| 0.32 |
| $324 |
| ACRES Commercial Realty Corp. ( ACR ) |
| 0.19 |
| $85 |
| Average |
| 0.66 |
| $1,699 |
*Data pulled from TD Ameritrade on 01.13.2022.
It’s a bit surprising to see these CLO funds trading at a P/B valuation higher than REITs. If commercial mREITs are expecting to see book value cuts amidst this current environment then it seems likely that funds which buy the loans these mREITs originate would likely stand to see some cuts as well.
Read the Fine Print on OCCI’s Dividend
As part of the company’s dividend policy the annual distribution of $2.20 is limited to a 20% payout in cash. The other 80% of this dividend is paid out in additional shares of common stock. What this means practically is that for dividend investors who may be seeking stable income, they should be aware that in reality this 23% annual dividend would only equate to $0.44 cash.
We can observe a culprit to the ballooning share count in this dividend policy. It creates an illusion of a higher dividend when in reality 80% of the dividend really just reflects a change in ownership interest.
Is OCCI A Good Investment?
OFS Credit company has established a five year trend of value destruction, ownership dilution, and expense extraction. It’s currently trading near book value in expectation that this five year trend is perhaps a fluke. Instead it seems likely to me that value destruction will return to this stock.
As a CLO fund, management invests across a huge range of companies hoping to mete out average returns at the least. Instead, they’ve managed to lose 10% annually while maintaining incredibly high expense ratios. The assumption is that management of so many different positions must require special knowledge or expertise justifying the high expenses.
But what justifies the poor performance?
These funds seem designed to confuse the average investors with greed. The apparent high dividend yields are bait putting investors on the hook for these companies' expenses. In turn the companies actively manage a portfolio of loans to upwards of thousands of different companies, and maintain a paycheck to boot.
The company’s that feed these CLOs like commercial mREITs are already pricing in book value declines due to a recession. If we were to assume a similar 34% average discount to book value OCCI would trade at $6.59.
But back to the question, is OCCI a good investment? In my judgment, absolutely not. I think investors are much better off looking away from this entire category of funds and instead looking to companies like commercial mREITs which originate these types of loans directly.
For further details see:
OFS Credit Company Compared To Two CLO CEF Peers: OXLC And ECC