XLE - OIH: Energy Service Stocks Attractive On Valuation Uptrend Holding
2023-06-20 06:04:19 ET
Summary
- Commodities have been in a broad downtrend for the last year, but I noticed one potential bullish reversal sign.
- The VanEck Oil Services ETF has a low earnings multiple, reasonable EPS growth, and is in a broad price uptrend.
- With an attractive valuation and high tradeability but soft seasonal trends right now, I have a buy rating on the ETF when weighing everything together.
The commodities complex has been rough for more than a year now. WTI topped out near $130 per barrel in June 2022, but a soon-to-strengthen US dollar along with rising global recession fears later last year weighed on the cyclical commodities space. Moreover, easing geopolitical tensions between Russia and Ukraine undermined the intense oil rally that had taken place in the first half of 2022.
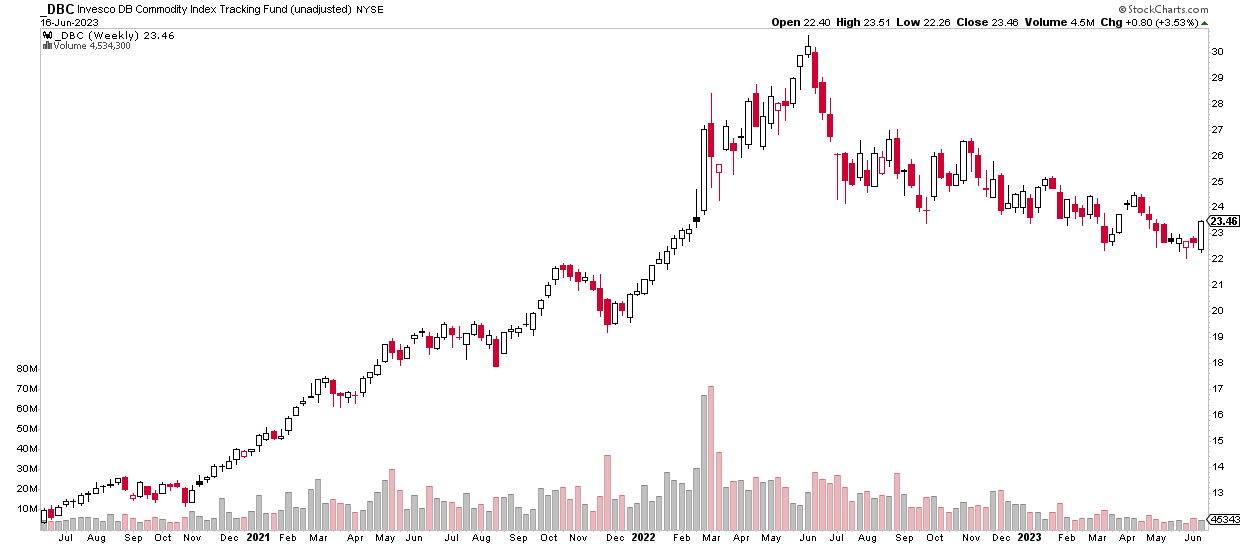
Fast forward to today, and commodities are not a sexy topic on financial TV, but I spotted a noteworthy technical development on the Invesco DB Commodity Index Tracking Fund ( DBC ) which could have bullish implications for the VanEck Oil Services ETF ( OIH ).
Notice in the chart below that DBC sported what technicians call a bullish engulfing candlestick last week. We'll get into the OIH fundamentals later, but this move is suggestive of more upside, potentially a long-term bullish reversal, across commodities.
I have a buy rating on OIH. It has a low earnings multiple, reasonable EPS growth, and is in a broad price uptrend.
Are Commodities Telling Us Something About Resource Stocks?
For background, according to the issuer , OIH seeks to replicate as closely as possible, before fees and expenses, the price and yield performance of the MVIS US Listed Oil Services 25 Index, which is intended to track the overall performance of US-listed companies involved in oil services to the upstream oil sector, which include oil equipment, oil services, or oil drilling.
The index seeks to track the most liquid companies in the industry based on market capitalization and trading volume and will generally own the largest oil drillers and oil services companies. The portfolio may include both domestic and US-listed foreign companies allowing for enhanced industry representation.
OIH has a trailing 12-month dividend yield of 1.1% as of June 16, 2023, and the total net assets of the product are $2.1 billion. With a total expense ratio of 0.35%, the cost to own the fund is not all that high while the 30-day median bid/ask spread is modest at just 8 basis points. So, tradeability is strong with OIH.
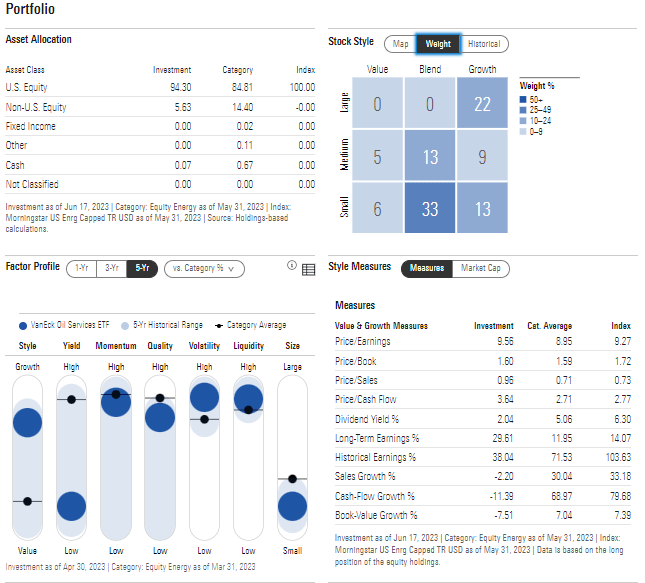
Digging into the portfolio, data from Morningstar show that OIH is mixed across the Style Box. The plurality of net assets is designated as small-cap blend, but there's actually a decent chunk in the upper-right large-cap growth segment. While no other large-cap exposure exists, more than a quarter of OIH is mid-cap. With a price-to-earnings ratio of less than 10, and considering the high earnings growth rate, I assert there is a strong value case here even though OIH ranks light on the yield factor. Momentum is strong while earnings quality is also impressive.
OIH: Portfolio & Factor Profiles
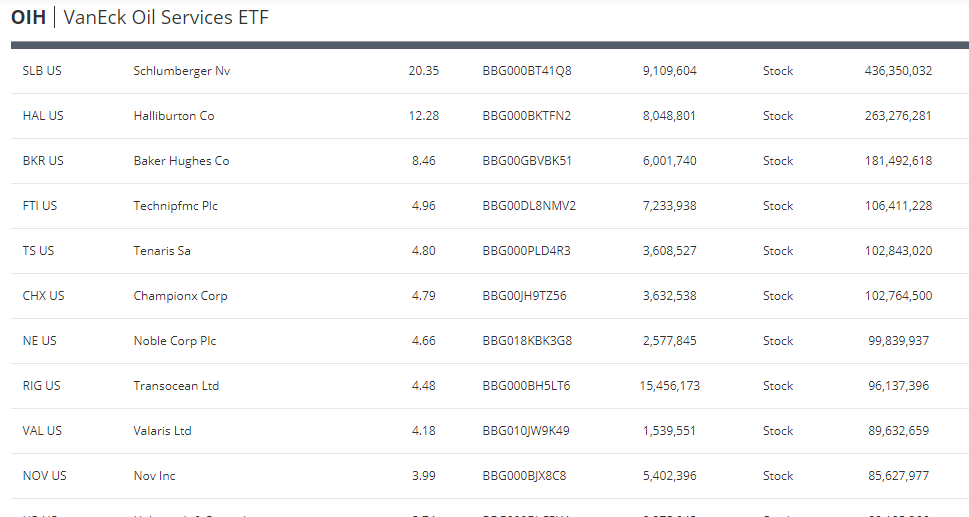
A key risk, though, is that OIH is concentrated. 74% of net assets are in the top 10 holdings with more than 20% in SLB (formerly Schlumberger) alone. Halliburton ( HAL ) is the other stock weighted more than 10%. There are also ADRs representing foreign companies in the portfolio.
OIH Top Holdings: A Concentrated Energy-Sector Fund
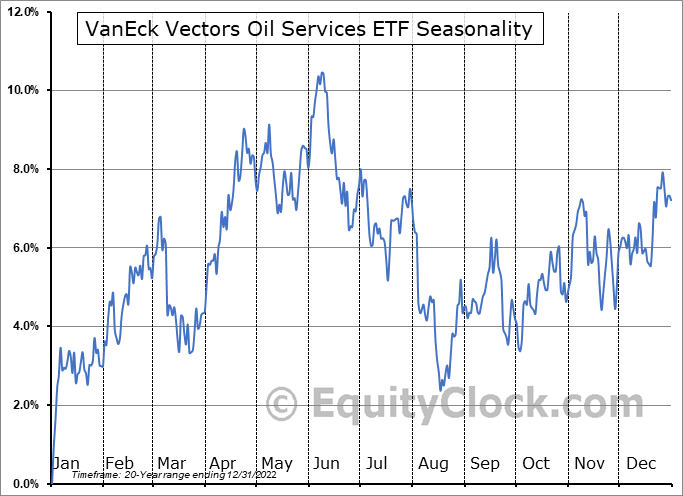
Seasonally, OIH tends to endure rough price action from mid-June through mid-August, according to data from Equity Clock . A more opportune time to get long the fund is later in Q3, so this is a bearish signal right now.
OIH: Bearish Near-Term Seasonal Trends
The Technical Take
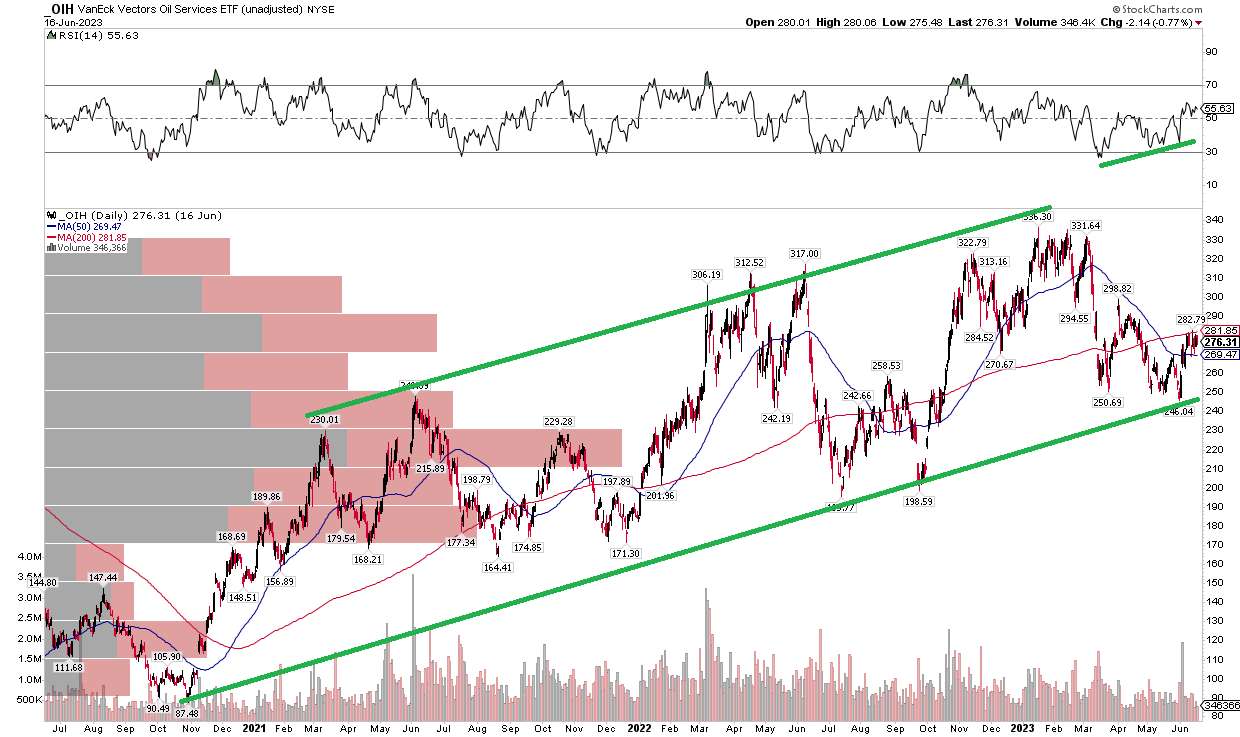
With an attractive valuation and high tradeability but with soft seasonal strength tendencies looming, the chart is better than what you might think considering the weakness in the oil patch in the last year. Take a look at the chart below. OIH is in a broad uptrend channel and just recently bounced off its lower bound.
The long-term 200-day moving average is modestly upward sloping, which indicates that the bulls remain in control. Considering that the ETF is working off the uptrend support line, I expect further upside. OIH could take a pause on a rally toward the $350 mark, so that's my initial target. Supporting that bullish narrative also is a positive RSI divergence on a recent small undercut of the April low of $250.
OIH: A Broad Uptrend Continues, Shares Bounce Off Support With A Bullish RSI Divergence
The Bottom Line
I have a buy rating on OIH. I like the valuation coupled with the earnings growth trajectory while the chart suggests the uptrend continues.
For further details see:
OIH: Energy Service Stocks Attractive On Valuation, Uptrend Holding