OIH - OIH: The Bullish Trend Continues
2023-09-05 07:44:04 ET
Summary
- Oil services companies support and enhance the extraction and processing of hydrocarbons, with higher oil prices driving more business.
- The VanEck Oil Services ETF has outperformed integrated oil companies since 2020, with a bullish trend and higher highs.
- Factors supporting oil prices include OPEC+ policies, US and European energy policies, China and India's demand, and inflation.
Oil and gas services are the products and processes that support and enhance the industry’s ability to extract hydrocarbons from the earth’s surface and process them into fuels and other products. Oil services firms explore, transport, process, and deliver energy assets to market. Generally, oil services companies manufacture, repair, and maintain equipment used in crude oil extraction and transportation.
The factors determining profitability for the oil services sector are industry capex budgets, rig and well counts, day rates, equipment orders, and backlogs. As of September 6, 2023, the S&P 500 Energy Select Sector SPDR ( XLE ) at $90.77 was 3.8% higher than the December 30, 2022, closing level. The XLE was 297% higher than the March 2020 $22.88 per share bottom.
Over the same periods, at $350.41, the VanEck Oil Services ETF was 15.2% higher than the 2022 closing level and 431% above the $66.00 2020 low. Oil services companies in the OIH have outperformed the integrated oil companies that make up the XLE since the 2020 lows and in 2023.
Higher lows and higher highs since March 2020 - A reverse split in April 2020
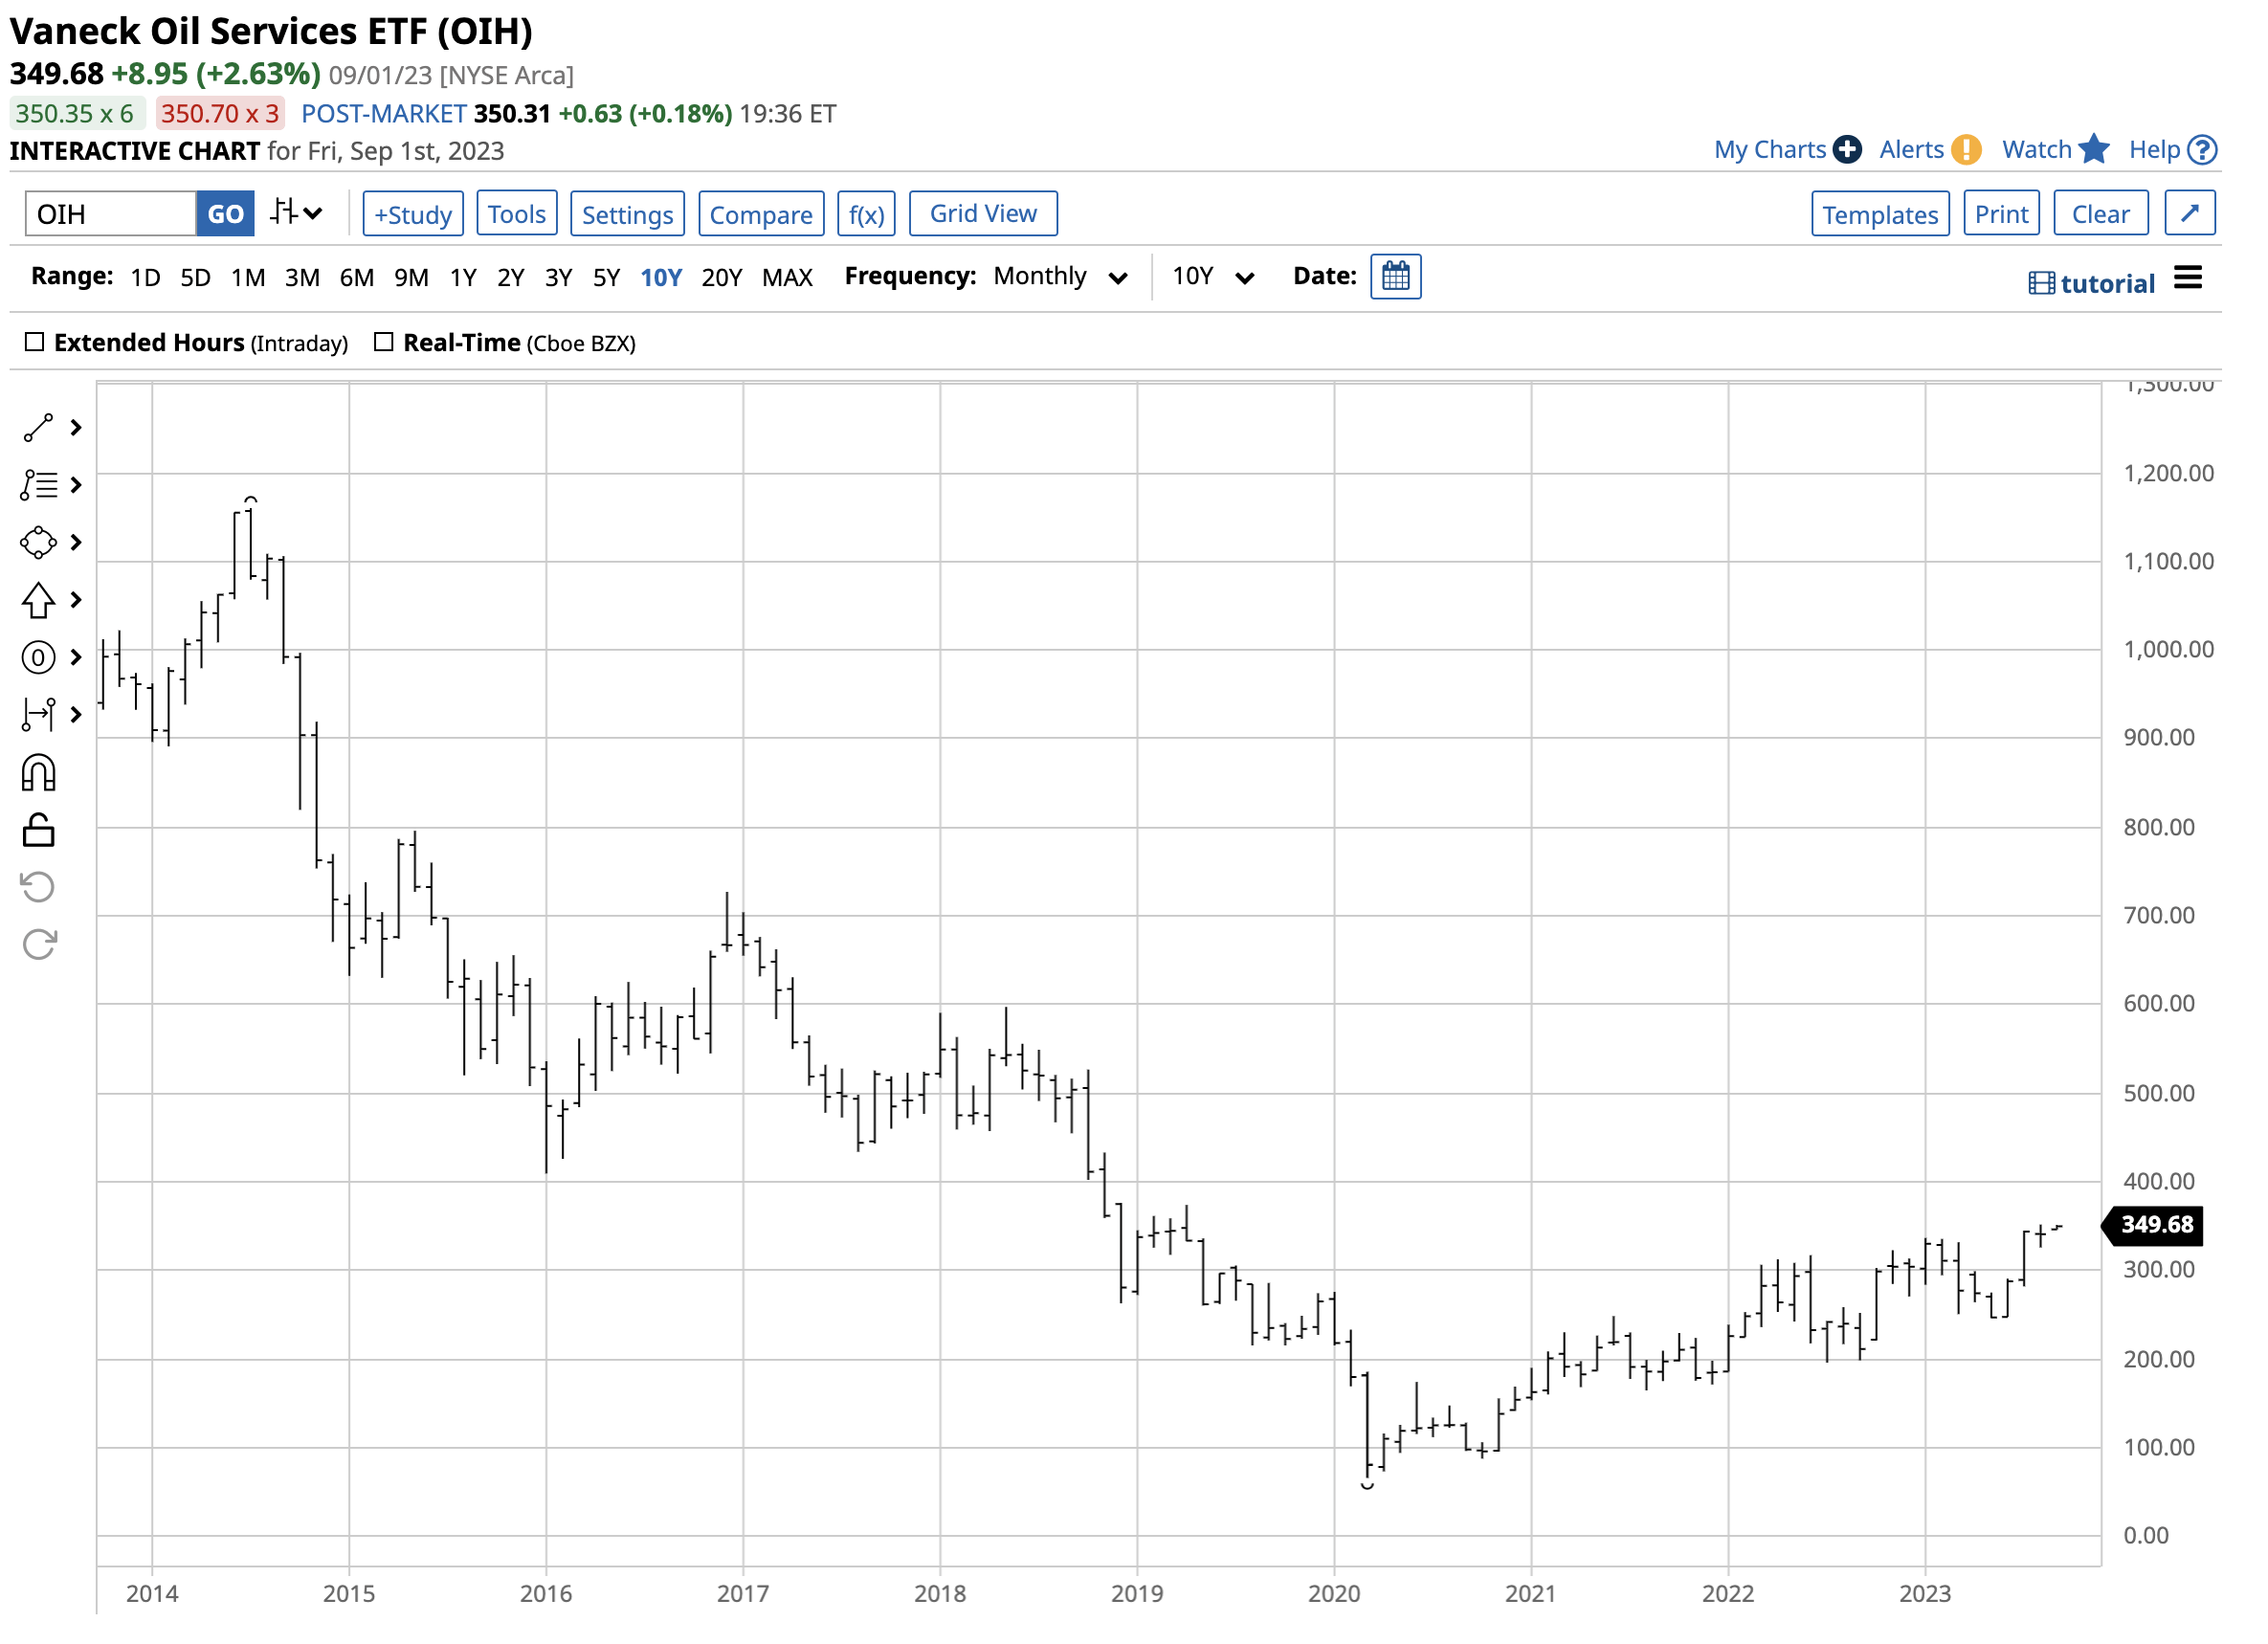
The 2020 global pandemic caused markets across all asset classes to fall to multi-year and, in some cases, all-time lows. NYMEX crude oil futures dropped below zero for the first time since trading began in the early 1980s, and the VanEck Oil Services ETF ( OIH ) product followed to its lowest price since its listing when it reached a bottom at $66 per share. On April 20, OIH Split History underwent a one-for-twenty reverse spilt. Since the March 2020 low, OIH has made higher lows and higher highs.
Ten-Year Chart of the OIH ETF Product (Barchart)
The chart highlights OIH’s bullish pattern, taking the ETF 432.5% higher to the most recent $351.46 high on August 9. At just below the $350 level on September 5, OIH remains in a bullish trend.
OIH owns shares of the leading oil services companies - Higher oil prices mean more business
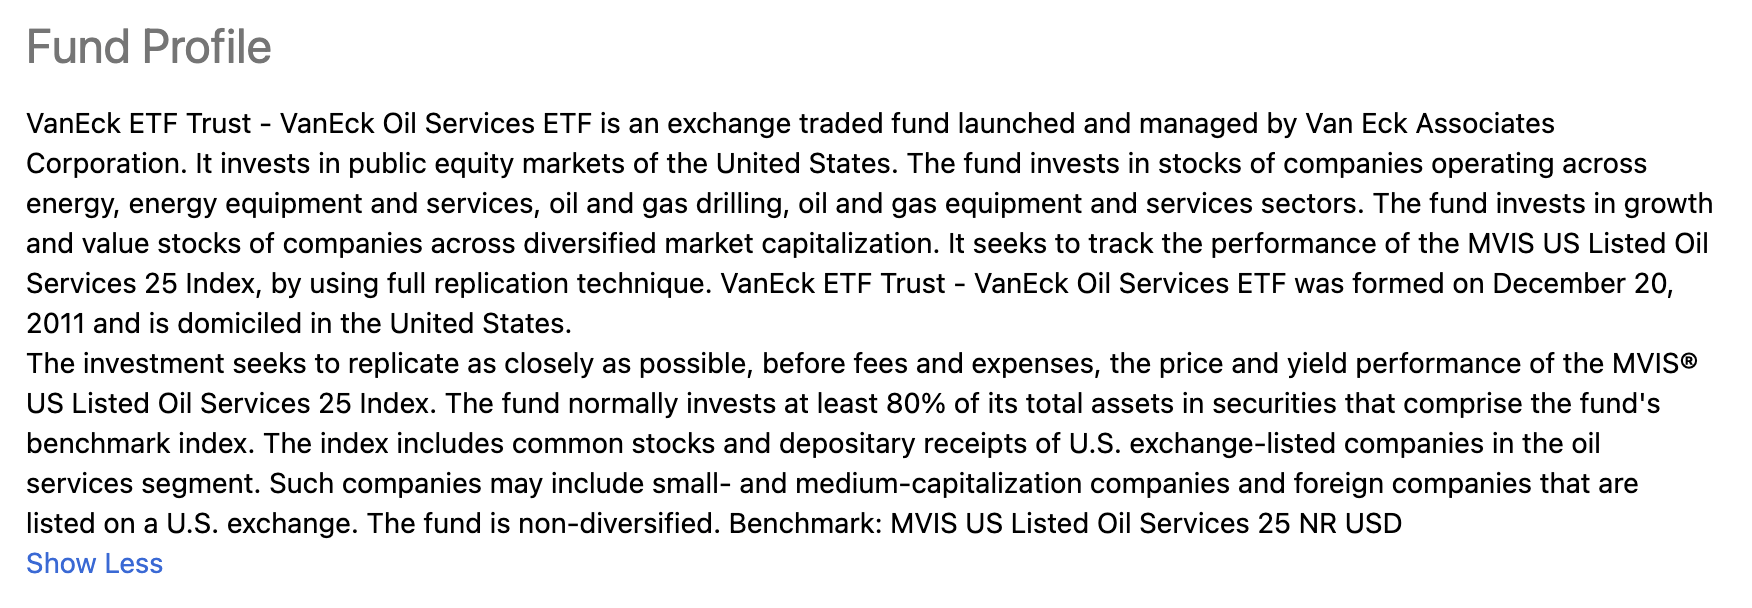
OIH’s fund profile states:
Fund Profile for the OIH ETF (Seeking Alpha)
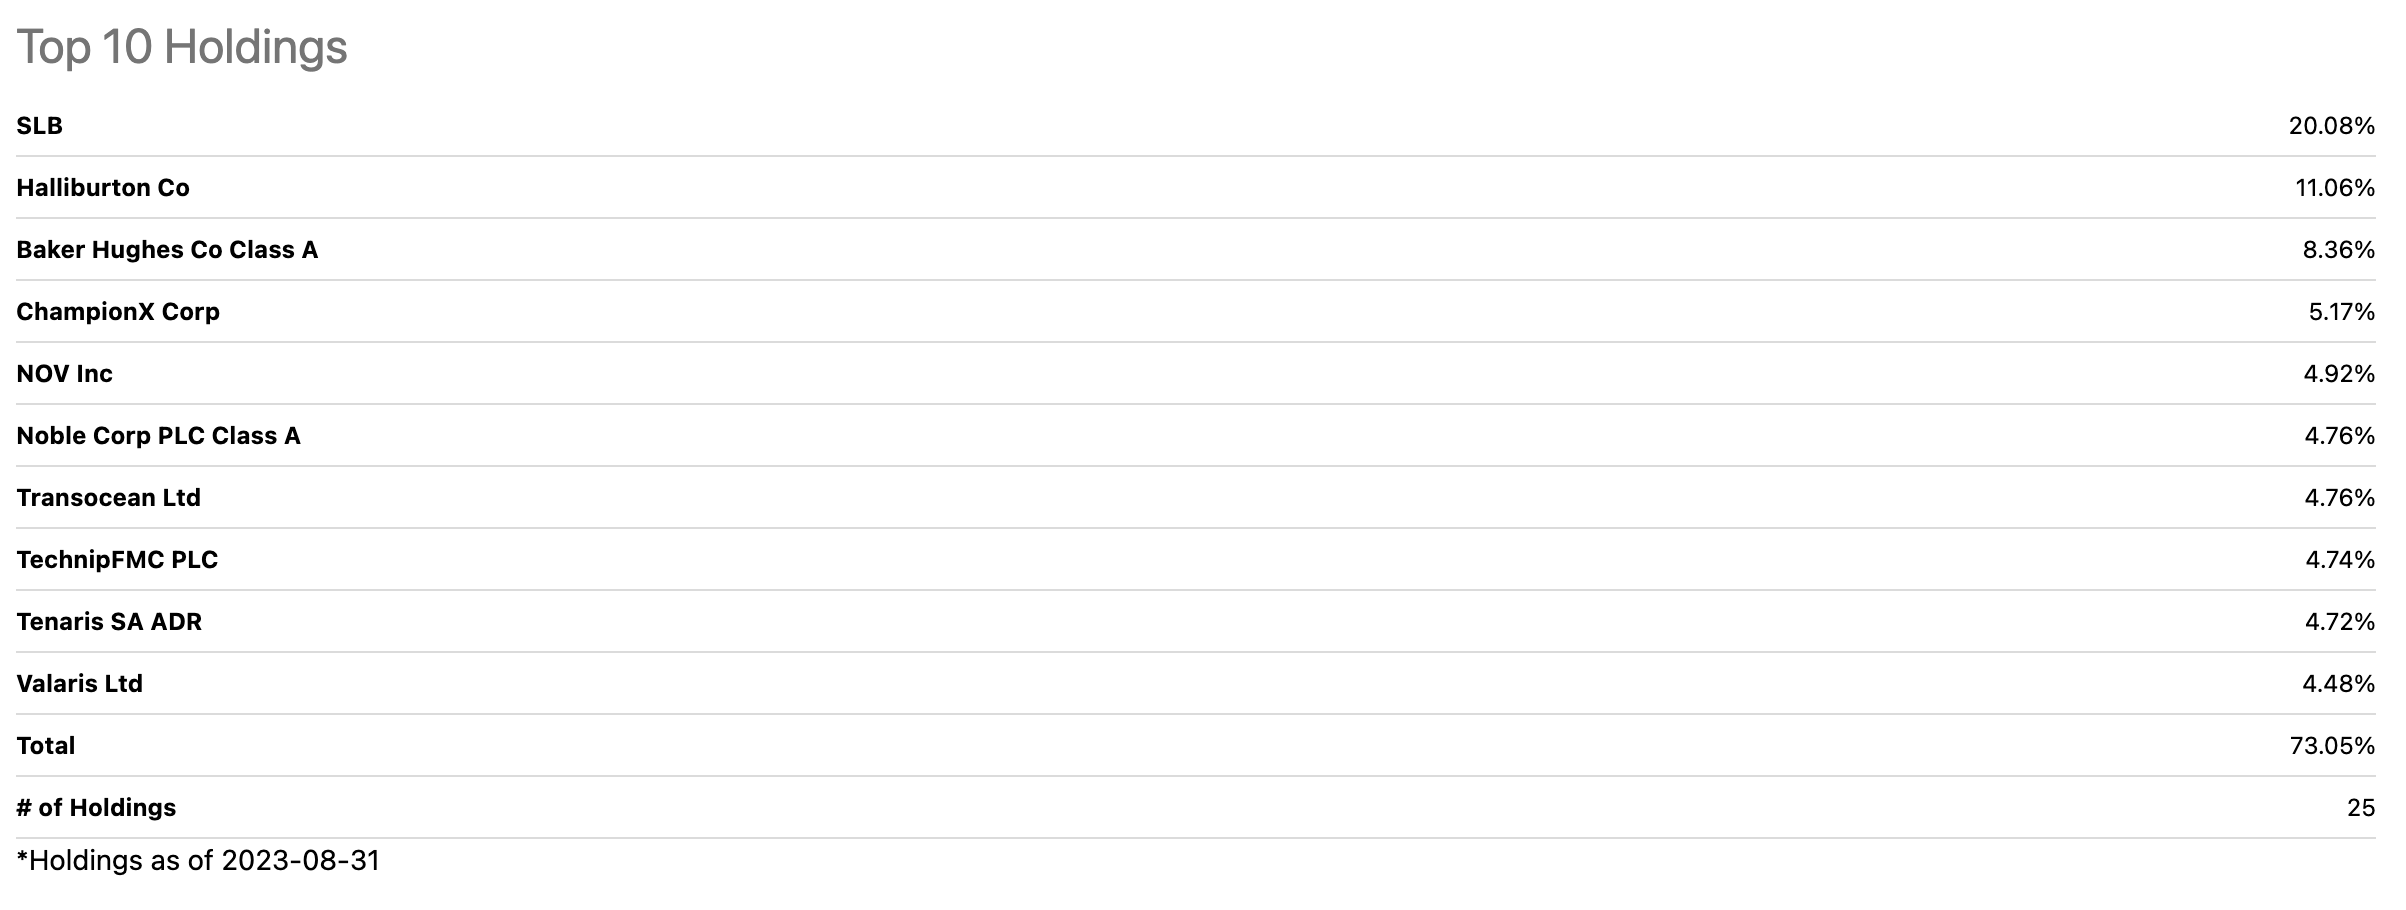
The most recent top holdings include:
Top Holdings of the OIH ETF (Seeking Alpha)
As the chart shows, OIH had 39.5% of its assets invested in the three leading international oil services companies: Schlumberger (SLB), Halliburton (HAL), and Baker Hughes (BKR).
At $349.68 per share on September 5, OIH had $2.57 billion in assets under management. OIH trades an average of over 560,000 shares daily and charges a 0.35% management fee.
The average dividend yield of the S&P 500 SPY ETF is 1.45%. OIH pays shareholders a lower $2.89 yearly dividend, equating to 0.83%. As of September 1, 2023, the SPY was 18% higher in 2023, while OIH had gained 15%. However, since the March 2020 lows, OIH was 432.5% higher compared to a 106.7% increase in SPY.
Meanwhile, on September 1, the XLE integrated oil company ETF was 296.6% higher than the 2020 low, as OIH outperformed the XLE over the past years.
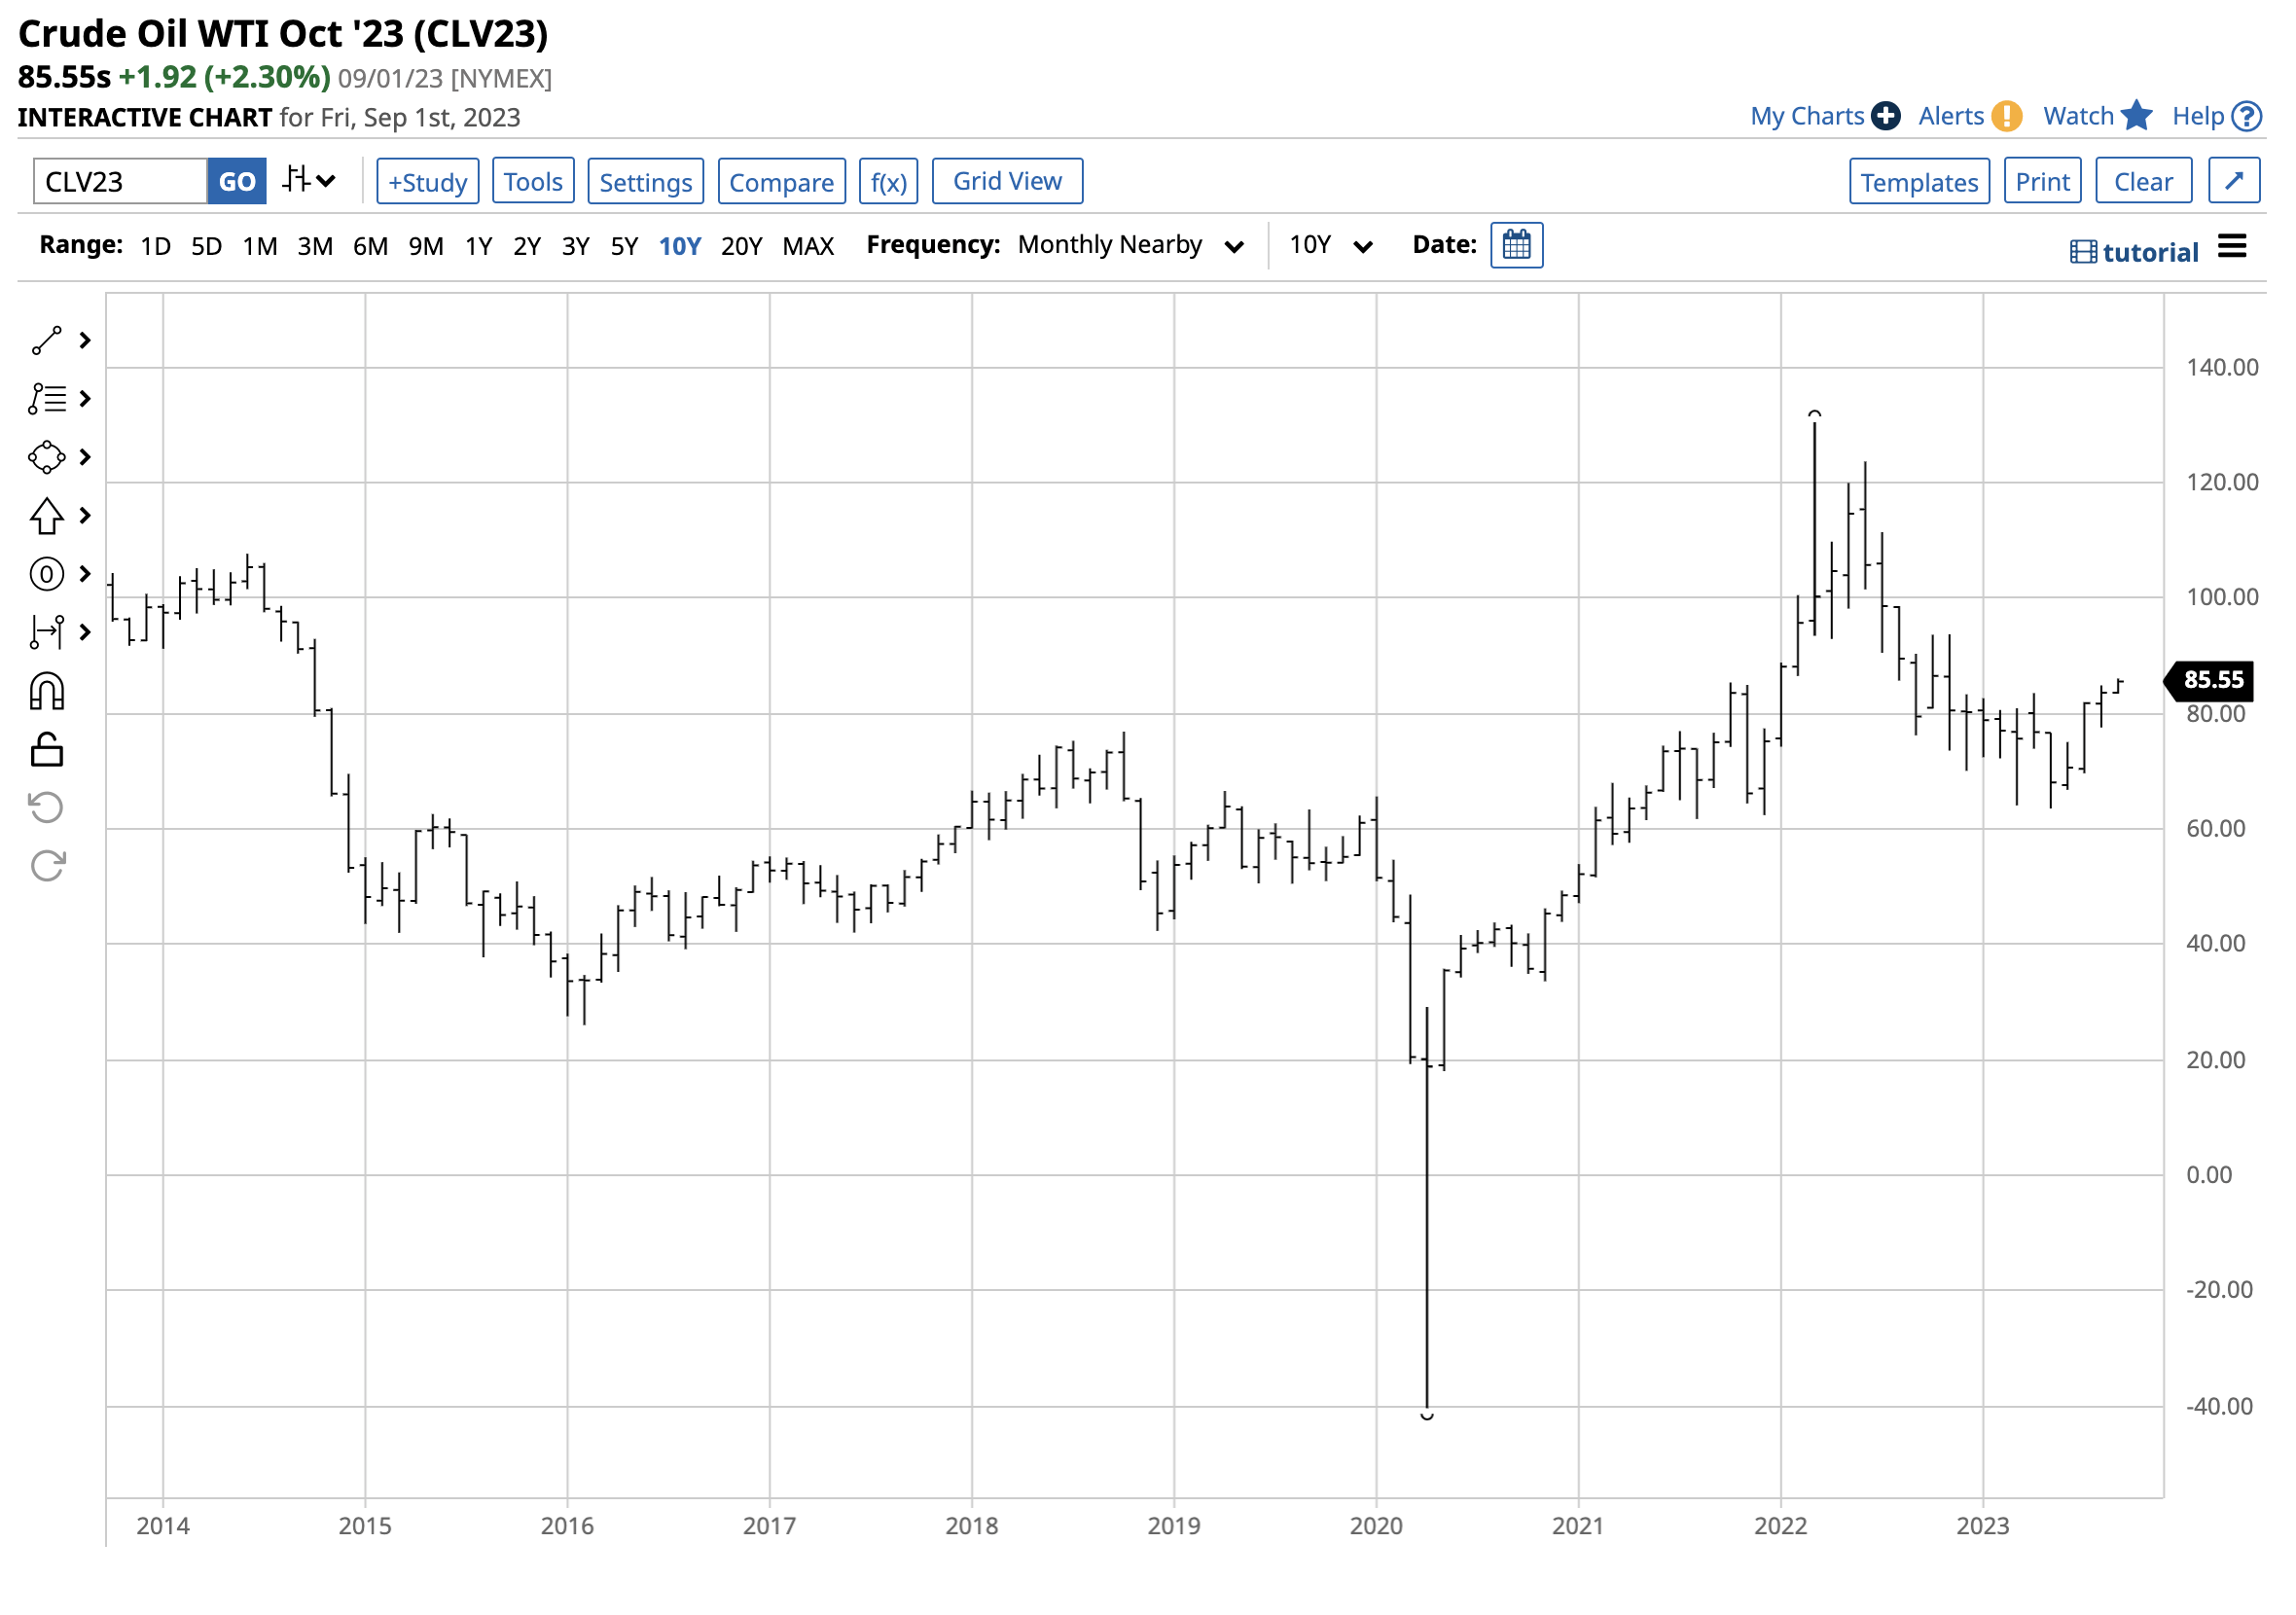
Rising oil prices are bullish for OIH and other oil-related assets. After trading to a $130.50 per barrel high in March 2022, nearby NYMEX crude oil corrected 51.3% to $63.57 in May 2023. Since then, the price rallied to the $85.55 level on September 1, a 34.6% gain from the May 2023 low.
The factors supporting oil and oil services - OPEC+, U.S. and European energy policies, China and India, and inflation
Higher crude oil prices since the May 2023 low support increased profits for the integrated petroleum and oil-related companies, and oil services are no exception. The following factors support higher oil prices in September 2023:
- OPEC+: The Saudis lead the international oil cartel, but since 2016, Russia has been the most influential non-member. Production decisions are a function of negotiations between Riyadh and Moscow as the Russians cooperate with production quotas. The Saudis require a minimum of $80 per barrel crude oil price to balance the domestic budget. Meanwhile, Russia has funded its war in Ukraine with oil revenues. Moreover, Russia has used crude oil and other energy commodities as economic weapons against countries supporting Ukraine. Therefore, the leading powers at OPEC+ favor policies that push oil prices higher.
- U.S. and European energy policies: Addressing climate change has caused the U.S. and European energy policies to support alternative and renewable fuels while inhibiting the production and consumption of fossil fuels. While the U.S. has the potential to lead worldwide oil and gas output, energy policies under the Biden administration handed oil’s pricing power to OPEC+.
- China and India: Crude oil continues to be the energy commodity that powers the world. China and India have over one-third of the world’s population and have not signed on to climate change initiatives, making U.S. and European efforts fall short of goals. Moreover, despite climate change initiatives, gasoline and other fossil fuels are primary energy commodities in the U.S. and Europe. Economic growth in China and India will only increase worldwide crude oil demand, handing more power to OPEC+. In a sign that China and India have divorced from U.S. dominance in the worldwide financial system, China recently purchased Saudi oil for payment in yen. India has bought oil from another OPEC producer in rupees. The bottom line is de-dollarization weakens the U.S. currency, leading to higher oil prices.
- Inflation: While the recent U.S. and global inflation data showed the economic condition is receding, inflation remains over twice the Fed’s 2% target level. Higher interest rates have caused the decline, but it remains at a multi-decade high, and the geopolitical landscape creates supply chain issues beyond monetary policy’s reach. Core consumer and producer price indices exclude “ volatile ” food and energy prices but remain significant inflationary factors in the current environment.
High oil prices and the bifurcation of the world’s nuclear powers cause the demand for companies providing oil services to increase.
The trend in oil is higher, and the U.S. SPR is low - An election is on the horizon, with energy policy as one of the leading topics
Crude oil prices broke out to the upside from the bearish trend from the March 2022 high to the May 2023 low in August 2023.
Ten-Year Chart of NYMEX WTI Crude Oil Prices (Barchart)
The NYMEX crude oil futures chart shows the pattern of lower highs from March 2022 ended in August when crude oil broke above technical resistance at $83.53 per barrel, the April 2023 lower high. NYMEX WTI crude oil futures are the benchmark for one-third of the world’s petroleum. Brent North Sea crude oil is the pricing mechanism for the other two-thirds, reflecting prices of European, Russian, African, and Middle Eastern petroleum.
Ten-Year Chart of Brent Crude Oil Prices (Barchart)
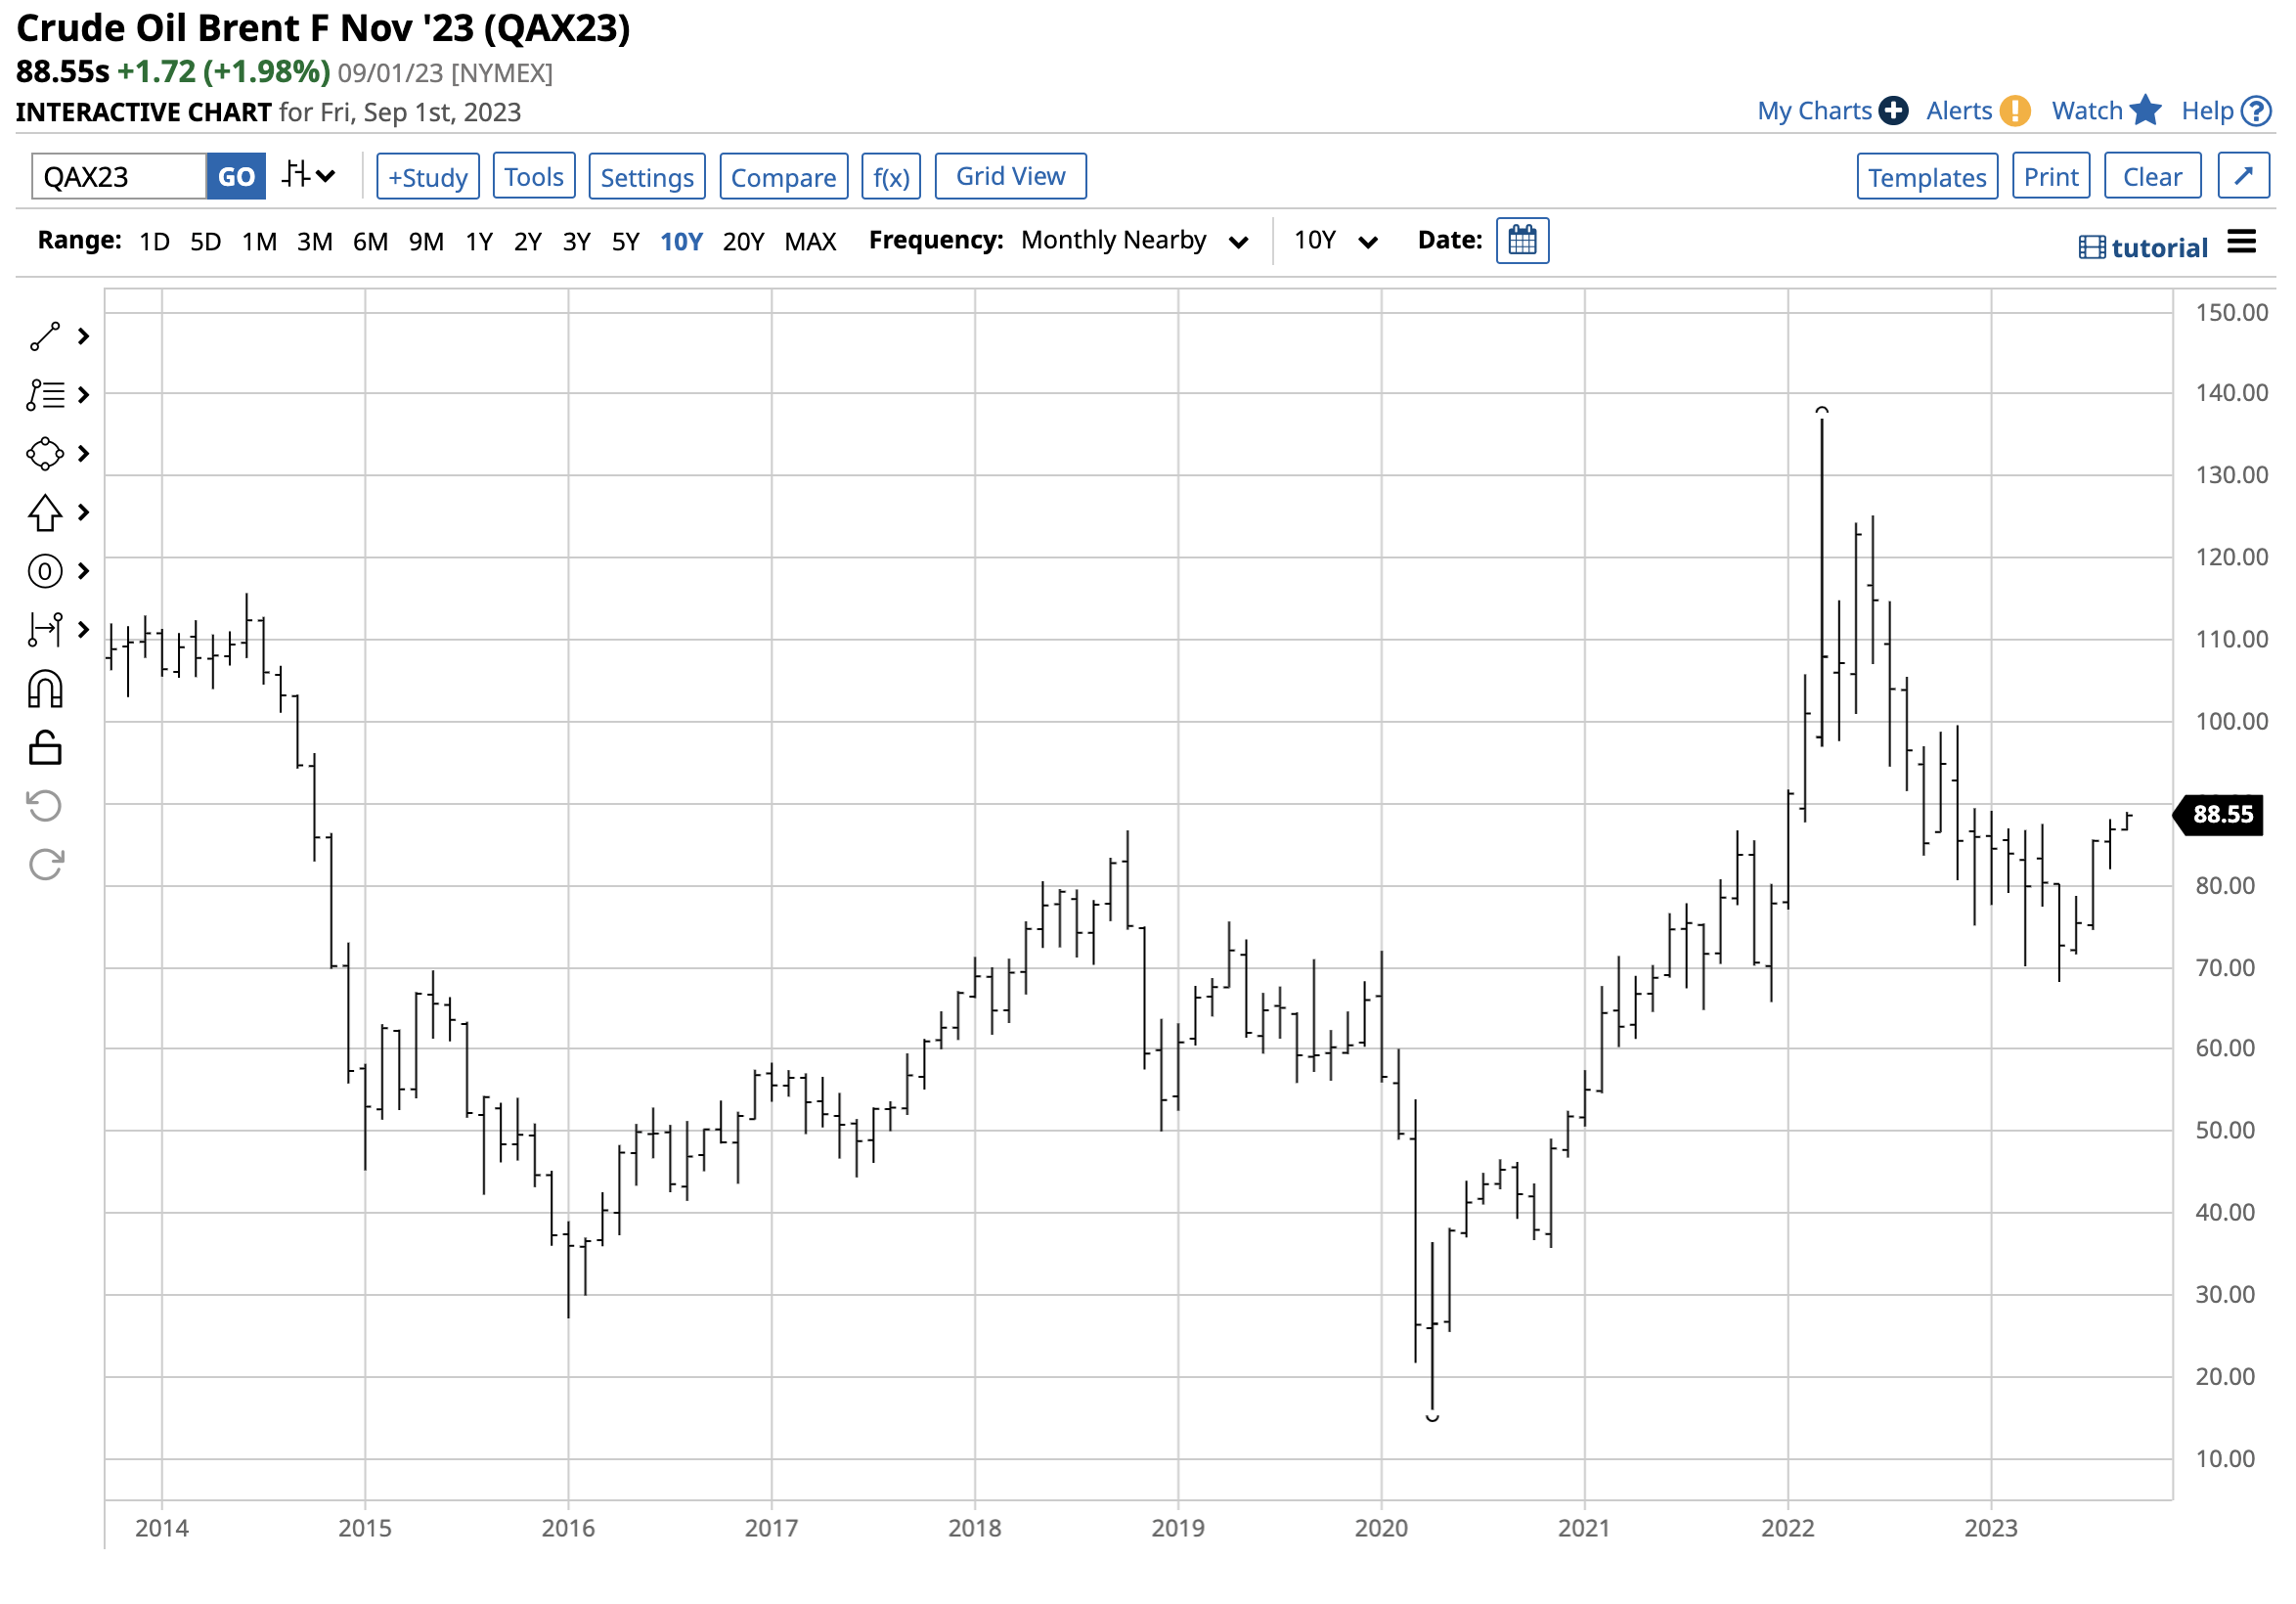
The ICE Brent crude oil futures chart shows the pattern of lower highs from March 2022 ended in August when crude oil broke above technical resistance at $87.49 per barrel, the April 2023 lower high. On September 1, Brent futures for November delivery were at the $88.55 level, with WTI futures for October delivery at $85.55 per barrel.
After rising to fourteen-year highs in March 2022, the U.S. administration authorized a massive crude oil sale from the U.S. Strategic Petroleum Reserve. In late 2021, the U.S. SPR stood at over 600 million barrels. On August 28, it was over 40% lower at 349.5 million. The SPR’s low level in September 2023 has two consequences. First, the administration has far fewer bullets to address rising oil prices. Second, the U.S. is a buyer of crude oil to replace the barrels sold at a target level of $67 to $72 per barrel. Crude oil prices were well above the high end of the range on September 1.
Another split could be on the horizon - The pre-split levels to watch as oil services companies profit
Crude oil prices are back in bullish mode, which is bad news for inflation and energy consumers. While Chinese economic weakness has kept oil prices in check, energy prices could soar if the world’s second-leading economy stabilizes or experiences growth over the coming months. The trend toward de-dollarization and OPEC+’s price influence may only exacerbate price increases. Higher oil prices could cause worldwide inflationary pressures to increase. Meanwhile, rising oil prices support profits for all oil-related companies, and oil services are no exception. The OIH has risen to a level where a stock split is possible. After splitting 1-20 in April 2020, a 2-1 or 3-1 split could be on the horizon if the ETF continues to rise. OIH is approaching technical resistance levels from before the reverse split.
Twenty-Year Chart of the OIH ETF Product (Barchart)
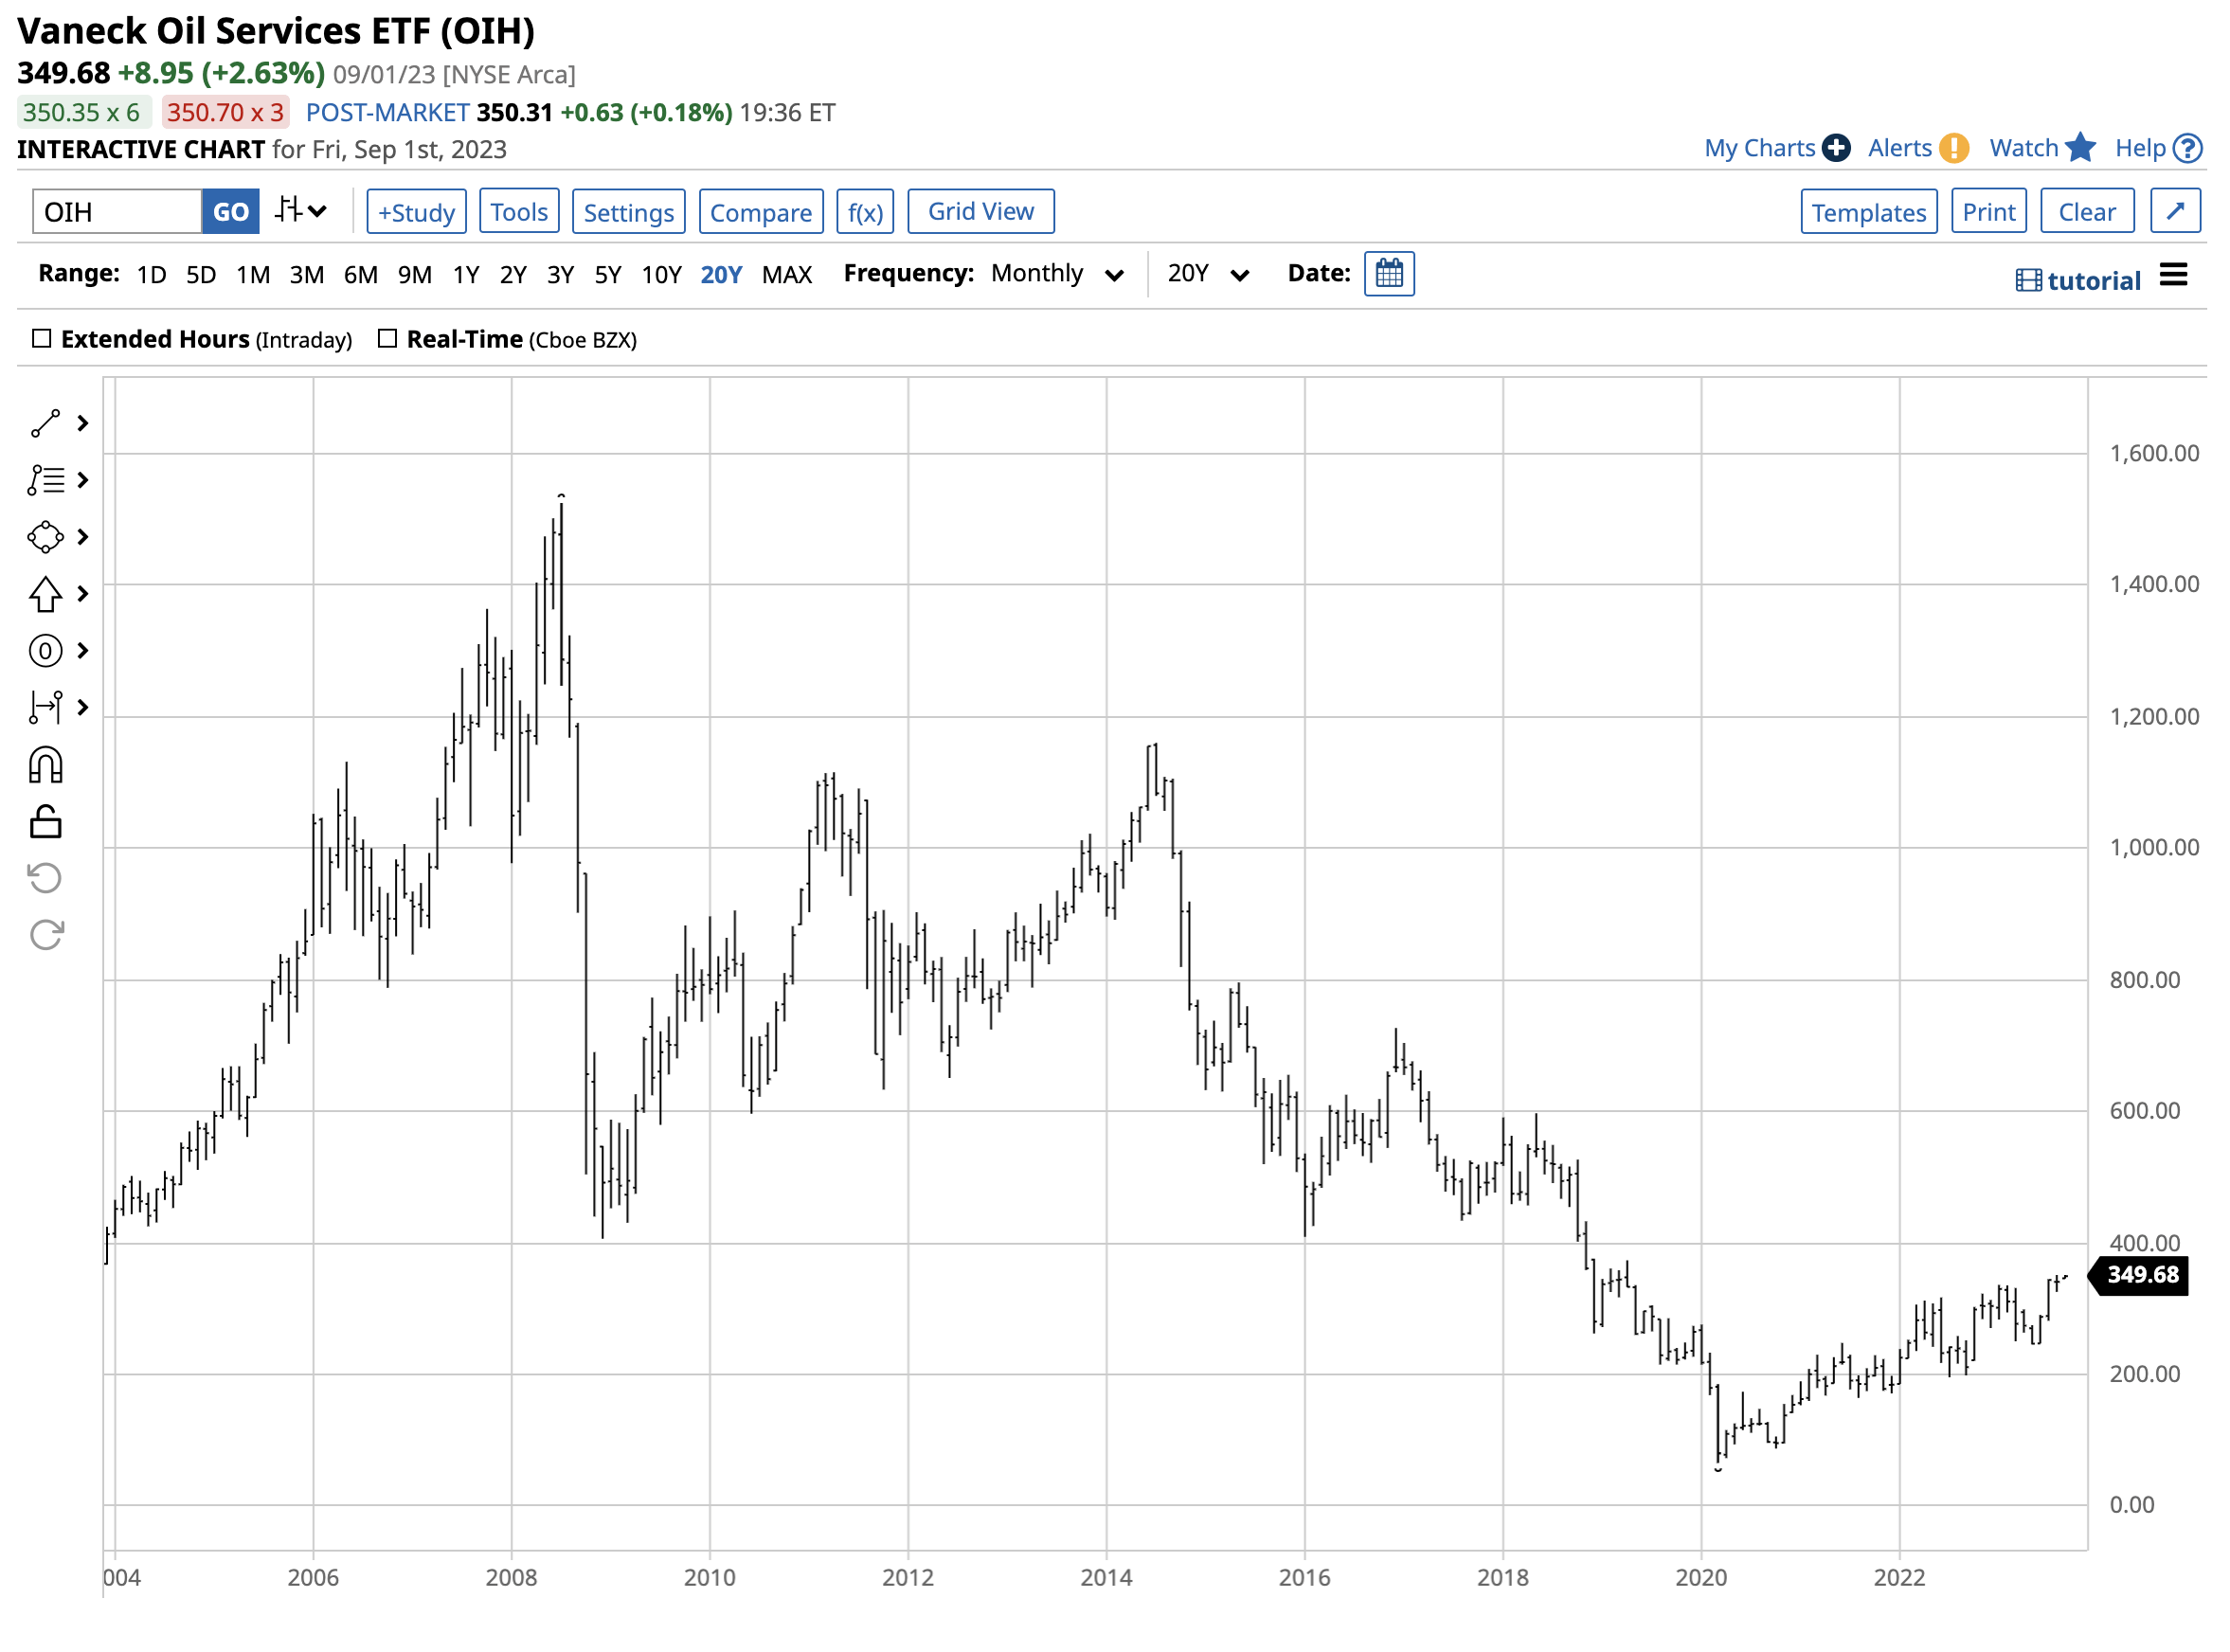
The twenty-year chart shows the first technical resistance level stands at the April 2019 post-split $373.60 high. Above there, the next upside target is at the May 2018 $597.30 peak.
The trend is always your best friend in markets across all assets. The path of least resistance of the OIH ETF product remains higher in September 2023. Bull markets rarely move in straight lines. Buying OIH on pullbacks, leaving room to add on further weakness, could be the optimal diversified approach to the oil services sector over the coming months.
For further details see:
OIH: The Bullish Trend Continues