TOLWF - Oilfield Services: Screening And Matrix Evaluation
2023-03-08 11:16:00 ET
Summary
- Given the uncertainty in energy markets, I believe oilfield services investors should concentrate on quality and profitability.
- 58 oilfield services equities were screened for profitability based on net income margin; only 33 were profitable over the previous twelve months.
- The 34 profitable OFS equities were evaluated using a quality matrix based on valuation, profitability, free cash flow, and debt.
- Based on this evaluation, clear winners were identified including Cactus, Inc., RPC, Inc., and NexTier Oilfield Solutions.
Oilfield Services: The Fed and Oil Prices
On March 7th, the Federal Reserve restated the central bank's intentions to continue raising the Fed Funds Rate in its ongoing effort to reduce inflation. Although many believe the Fed will raise its key rate by 50 basis points at its next policy meeting, investors cannot be certain how oilfield services ((OFS)) equities will respond.
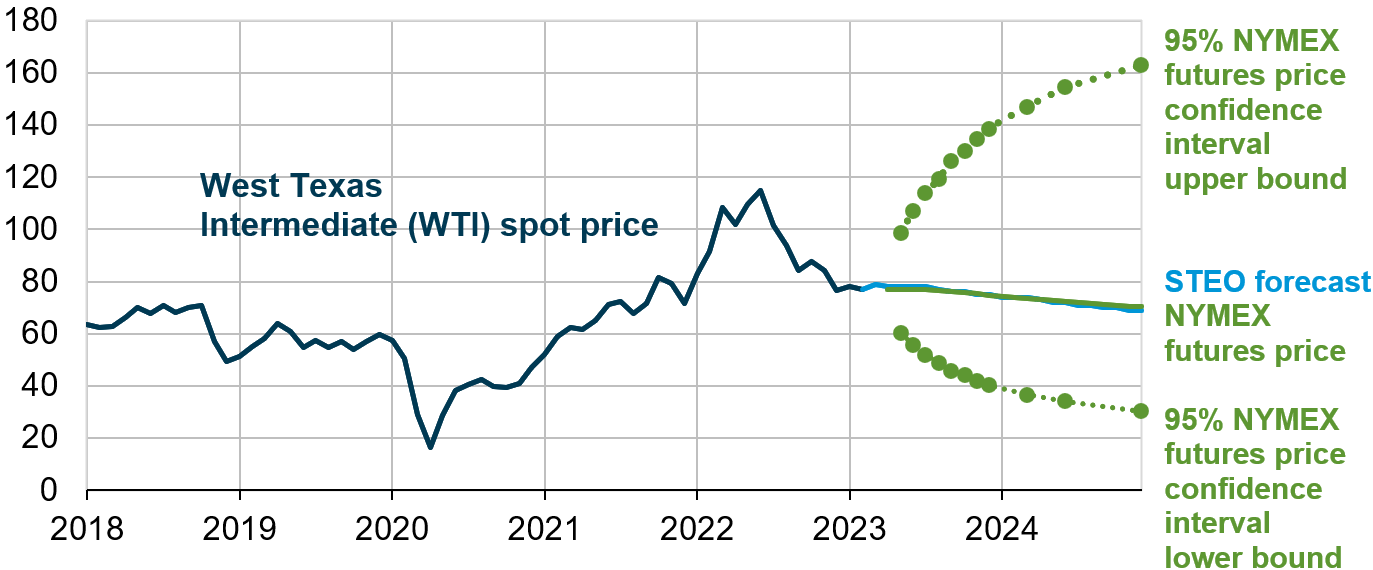
Since early June of last year, WTI has generally trended down from nearly $120/bbl to its more recent range of 75-$80/bbl.
WTI Spot Price
The US Energy Information Agency published its most recent Short Term Energy Outlook on March 7th, 2023. The EIA expects crude oil to continue on a shallow decline through 2023. Notably, EIA's confidence intervals are very wide.
Oilfield Services: Initial Screen
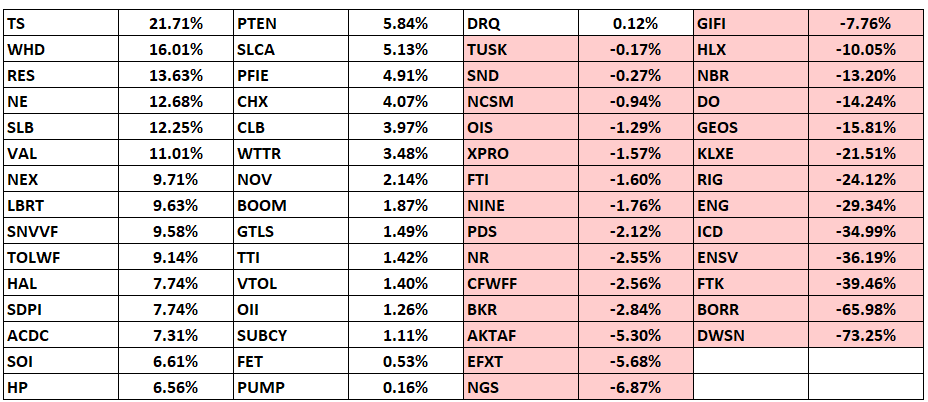
I actively monitor 58 OFS providers and routinely trade the sub-sector on quality, value, sentiment, momentum, and volatility. Given current uncertainties, it seems prudent to refocus on only profitable providers. Below, OFS providers are sorted by descending net income margin.
OFS: Net Income Margin
The OFS providers highlighted in red reported negative net income margin over the last 12 months and will not be considered further within this discussion.
Oilfield Services: Quality Ranking
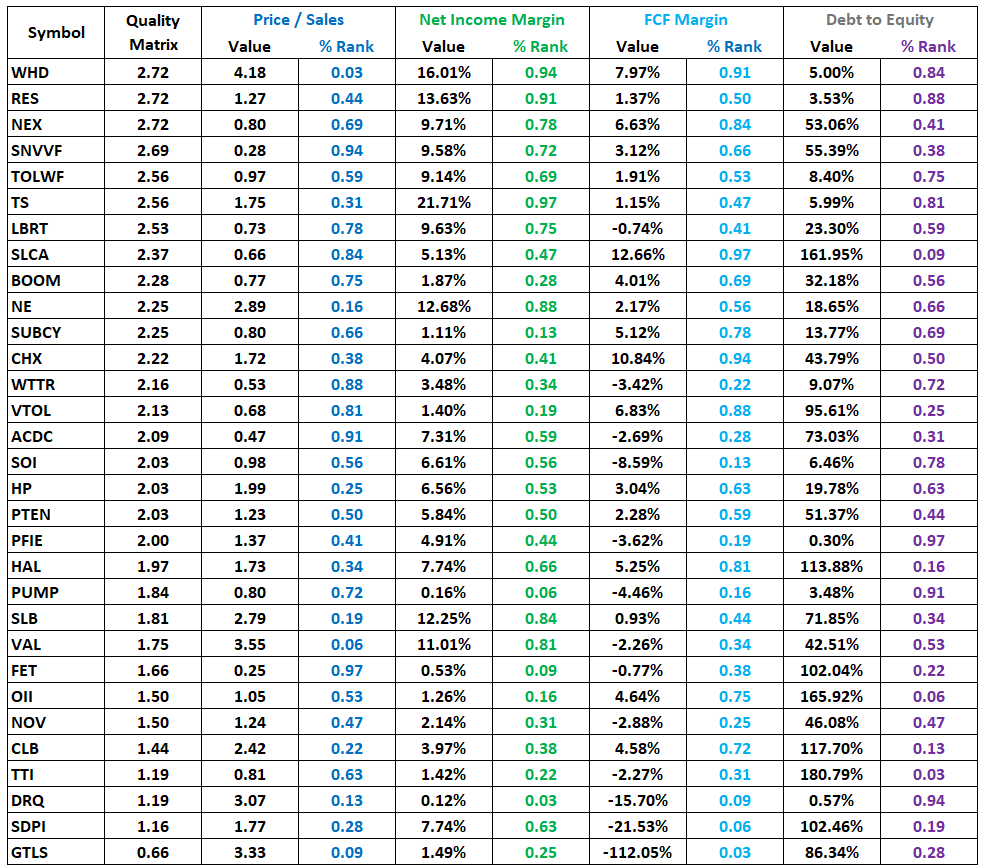
The remaining 34 OFS providers were evaluated using a quality matrix with factors including Price/Sales, Net Income Margin, Free Cash Flow Margin, and Debt to Equity. The values for each provider's factors were normalized by means of statistical percent ranking within the group. The quality matrix was calculated as the sum of the percent ranks of the factors.
OFS Providers: Quality Matrix Chart
The above chart is sorted in descending order of the best quality (highest matrix score) to the poorest quality (lowest matrix score).
OFS Providers: Quality Matrix Plot
Author, SA Data
The quality matrix is presented graphically in the stacked bar chart to the left with cumulative inputs for each factor.
The top three providers (Cactus, Inc. ( WHD ), RPC, Inc. ( RES ), and NexTier Oilfield Solutions ( NEX )) are North American mid-caps. The 4th and 5th highest quality OFS providers (STEP Energy Services ( SNVVF ) and Trican Well Service (TOLWF)) are Canadian small-caps.
Notably absent from the top ten are major international large-caps (Halliburton ( HAL ) and Schlumberger ( SLB ). Amongst drillers, Noble Corporation ( NE ) ranked 10th while (Helmerich & Payne ( HP ), Patterson-UTI ( PTEN ), and Valaris ( VAL )) are ranked in the lower half. Further, several drillers (( ICD ), ( NBR ), and ( BORR )) didn't make the first cut based on profitability.
Risks
Recent volatility in energy markets and broad economic uncertainty suggest elevated risk in oilfield services. Moreover, I believe that many providers have recently traded largely on sentiment and momentum at prices that are unsupported by fundamentals. Further declines in oil and gas prices could trigger steep losses in these OFS providers.
Investors should consider the quality matrix a screen only. The matrix, its factors, normalization method, and weights could all be adjusted and yield different results. Further, the matrix is based on the most readily available and common metrics. Some of these metrics will change rapidly with share price while others will change as new company reports are released. It does not include company-specific data available in quarterly reports and presentations. Every investment decision regarding an individual equity should be based on comprehensive analysis of that equity.
Conclusions and Recommendations
Although risk appears elevated in the sector, I believe some OFS providers remain prudent investments. I believe that energy demand is likely to be sufficient to support a cautious level of investment from oil and gas producers and reliable revenue for some OFS providers.
I recommend those investors who are comfortable in the sector focus on fundamentally sound companies who have recently produced profits and free cash flow. Based on the value matrix, ( WHD ), ( RES ), ( NEX )), ( SNVVF ), and ( TOLWF ), appear to be promising and amongst the safest investments in the sector.
Many seek to know that which they do not yet know; they ought rather seek to know that which they know. - Zhuangzi
For further details see:
Oilfield Services: Screening And Matrix Evaluation