ONB - Old National Bancorp: Positive Earnings Outlook Appears Priced-In (Rating Downgrade)
2023-07-18 04:38:28 ET
Summary
- Earnings will likely surge this year because expenses will return to a more normal level. Further, the anticipated loan growth will help earnings.
- The risk level is comfortable because uninsured deposits are well covered by the available liquidity. Further, exposure to office properties is limited.
- The December 2023 target price suggests a small downside from the current market price. ONB is offering a decent dividend yield.
Earnings of Old National Bancorp ( ONB ) will likely surge this year as provisioning and operating expenses will return to a more normal level. Further, healthy pipelines will ensure that loan growth remains decent this year, which will boost earnings. I’m expecting the company to report earnings of $1.94 per share for 2023, up 29% year-over-year. The year-end target price is quite close to the current market price. Hence, I’m adopting a hold rating on Old National Bancorp.
Continued Deposit Mix Deterioration to Hurt the Margin
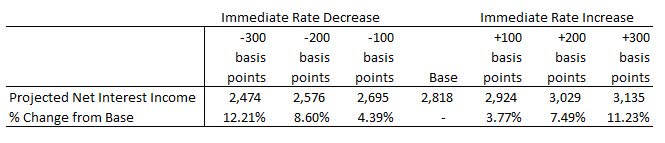
After rising throughout last year, the net interest margin dipped by 16 basis points during the first quarter of 2023 in a sharp reversal of its trend. This result is especially disappointing because Old National Bancorp’s balance sheet is inherently asset sensitive. The first quarter’s interest rate hikes should’ve increased the margin, as suggested by the results of the management’s rate sensitivity analysis given in the 10-Q filing .
1Q 2023 10-Q Filing
The reason why the actual results for the first quarter were far from hypothetical projections is that costly time deposits surged during the quarter, resulting in a significant deterioration of the deposit mix.
SEC Filings
The management will have to continue to let deposits migrate towards higher-rate accounts in order to retain them. Therefore, I’m expecting a further deposit mix deterioration in the near future, which will lead to margin pressure. Overall, I’m expecting the margin to dip by fifteen basis points in the last nine months of 2023.
Robust Pipelines to Sustain Loan Growth
In continuation of last year’s trend, loan growth remained strong during the first quarter of 2023 at 2.3%, or 9.1% annualized. The management mentioned in the latest presentation that it expects loan growth to be in the mid-single-digit range for the remainder of FY2023. This target shows that the management expects a slowdown from the first quarter’s level. To me, this seems reasonable because of the economic slowdown in the country. The latest reading of the Leading Economic Index maintained by the Conference Board was down 0.7% sequentially. Further, the manufacturing purchasing managers index has been in the contractionary phase (below 50) since last year.
One positive factor is the pipeline of the commercial loan segment. As mentioned in the presentation, this segment’s pipeline stood at $5.4 billion at the end of March 2023. To put this number in perspective, $5.4 billion is a massive 17% of the total loans outstanding at the end of the first quarter.
Considering these conflicting factors, I’m expecting loan growth to slow down to 4% annualized for the last nine months of 2023. Further, I’m expecting deposits to grow in line with loans. The following table shows my balance sheet estimates.
| Financial Position |
| FY18 |
| FY19 |
| FY20 |
| FY21 |
| FY22 |
| FY23E |
| Net interest income |
| 538 |
| 604 |
| 596 |
| 596 |
| 1,328 |
| 1,517 |
| Provision for loan losses |
| 7 |
| 5 |
| 38 |
| (29) |
| 145 |
| 43 |
| Non-interest income |
| 195 |
| 199 |
| 239 |
| 214 |
| 400 |
| 287 |
| Non-interest expense |
| 517 |
| 508 |
| 541 |
| 501 |
| 1,038 |
| 1,033 |
| Net income - Common Sh. |
| 191 |
| 238 |
| 226 |
| 278 |
| 414 |
| 567 |
| EPS - Diluted ($) |
| 1.22 |
| 1.38 |
| 1.36 |
| 1.67 |
| 1.50 |
| 1.94 |
| Source: SEC Filings, Author's Estimates In USD million unless otherwise stated |
Risk Level Appears Manageable
Old National Bancorp’s risk level appears comfortable. The following factors bear monitoring, but overall the riskiness is manageable.
- Office loans. McKinsey Global Institute has estimated that remote work could possibly wipe out $800 billion from the value of office buildings in major cities worldwide by 2030, according to news reports . Fortunately, office loans made up just 4% of total loans at the end of March 2023, as mentioned in the presentation.
- Uninsured deposits . According to details given in the presentation, uninsured deposits made up ~30% of total deposits. Fortunately, Old National has ample liquidity with liquidity sources of $15.7 billion, covering ~150% of uninsured deposits.
Adopting a Hold Rating
Old National Bancorp is offering a dividend yield of 3.8% at the current quarterly dividend rate of $0.14 per share. The earnings and dividend estimates suggest a payout ratio of 29% for 2023, which is below the five-year average of 39%. Therefore, there is room for a dividend hike. Nevertheless, I’m not expecting any increase in the dividend level this year as Old National does not change its dividend regularly.
I’m using the peer average price-to-tangible book (“P/TB”) and price-to-earnings (“P/E”) multiples to value Old National Bancorp. Peers are trading at an average P/TB ratio of 1.1 and an average P/E ratio of 7.4, as shown below.
| ONB |
| VLY |
| FNB |
| WAL |
| BPOP |
| Peer Average |
| TBVPS - Dec 2023 ($) |
| 11.0 |
| 11.0 |
| 11.0 |
| 11.0 |
| 11.0 |
| Target Price ($) |
| 10.4 |
| 11.5 |
| 12.6 |
| 13.7 |
| 14.8 |
| Market Price ($) |
| 14.6 |
| 14.6 |
| 14.6 |
| 14.6 |
| 14.6 |
| Upside/(Downside) |
| (28.6)% |
| (21.0)% |
| (13.4)% |
| (5.9)% |
| 1.7% |
| Source: Author's Estimates |
Multiplying the average P/E multiple with the forecast earnings per share of $1.94 gives a target price of $14.3 for the end of 2023. This price target implies a 1.9% downside from the July 14 closing price. The following table shows the sensitivity of the target price to the P/E ratio.
| P/E Multiple |
| 5.4x |
| 6.4x |
| 7.4x |
| 8.4x |
| 9.4x |
| EPS 2023 ($) |
| 1.94 |
| 1.94 |
| 1.94 |
| 1.94 |
| 1.94 |
| Target Price ($) |
| 10.4 |
| 12.3 |
| 14.3 |
| 16.2 |
| 18.2 |
| Market Price ($) |
| 14.6 |
| 14.6 |
| 14.6 |
| 14.6 |
| 14.6 |
| Upside/(Downside) |
| (28.5)% |
| (15.2)% |
| (1.9)% |
| 11.4% |
| 24.7% |
| Source: Author's Estimates |
Equally weighting the target prices from the two valuation methods gives a combined target price of $13.4 , which implies a 7.7% downside from the current market price. Adding the forward dividend yield gives a total expected return of negative 3.8%. Hence, I’m adopting a hold rating on Old National Bancorp.
For further details see:
Old National Bancorp: Positive Earnings Outlook Appears Priced-In (Rating Downgrade)